| Param | Original file | Final file |
|---|---|---|
| Filename | modeM0/AS1A10_058T10_9000004472_30935cztM0_level2.evt | modeM0/AS1A10_058T10_9000004472_30935cztM0_level2_quad_clean.evt |
| Size (bytes) | 549,164,160 | 99,734,400 |
| Size | 523.7 MB | 95.1 MB |
| Events in quadrant A | 3,392,677 | 653,381 |
| Events in quadrant B | 5,352,334 | 647,804 |
| Events in quadrant C | 3,732,711 | 624,179 |
| Events in quadrant D | 3,694,811 | 623,108 |
| Mode M0 | |||
|---|---|---|---|
| Quadrant | BADHDUFLAG | Total packets | Discarded packets |
| A | 0 | 14647 | 329 |
| B | 0 | 21318 | 638 |
| C | 0 | 15568 | 351 |
| D | 0 | 15569 | 306 |
| Mode M9 | |||
|---|---|---|---|
| Quadrant | BADHDUFLAG | Total packets | Discarded packets |
| A | 0 | 15 | 0 |
| B | 0 | 16 | 0 |
| C | 0 | 16 | 0 |
| D | 0 | 16 | 1 |
| Mode SS | |||
|---|---|---|---|
| Quadrant | BADHDUFLAG | Total packets | Discarded packets |
| A | 0 | 140 | 6 |
| B | 0 | 140 | 6 |
| C | 0 | 140 | 0 |
| D | 0 | 140 | 2 |
| Quadrant | Total seconds | Saturated seconds | Saturation percentage |
|---|---|---|---|
| A | 6778 | 65 | 0.958985% |
| B | 6726 | 187 | 2.780256% |
| C | 6775 | 280 | 4.132841% |
| D | 6800 | 49 | 0.720588% |
Noise dominated data is calculated using 1-second bins in cleaned event files. If a bin has >2000 counts, and if more than 50% of those come from <1% of pixels, then it is considered to be noise-dominated and hence unusable.
| Quadrant | # 1 sec bins | Bins with >0 counts | Bins with >2000 counts | High rate bins dominated by noise | Noise dominated (total time) | Noise dominated (detector-on time) | Marked lightcurve |
|---|---|---|---|---|---|---|---|
| A | 8013 | 6917 | 0 | 0 | 0.00% | 0.00% | 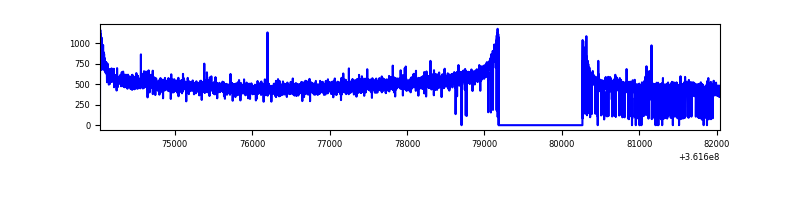 |
| B | 8013 | 6903 | 1 | 1 | 0.01% | 0.01% | 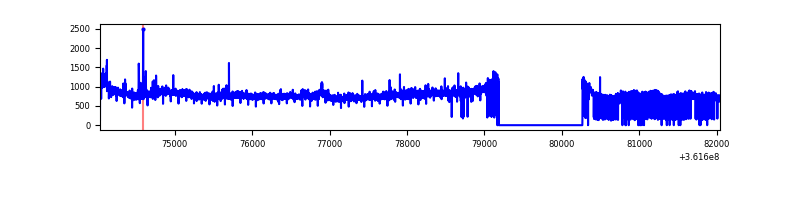 |
| C | 8012 | 6915 | 6 | 6 | 0.07% | 0.09% | 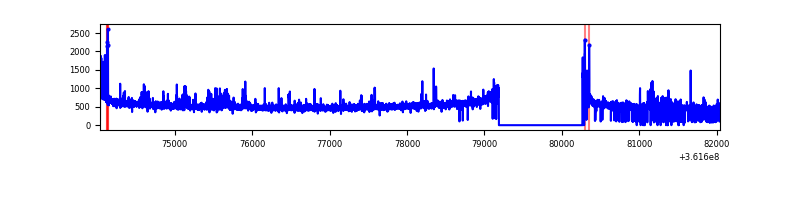 |
| D | 8012 | 6925 | 17 | 17 | 0.21% | 0.25% | 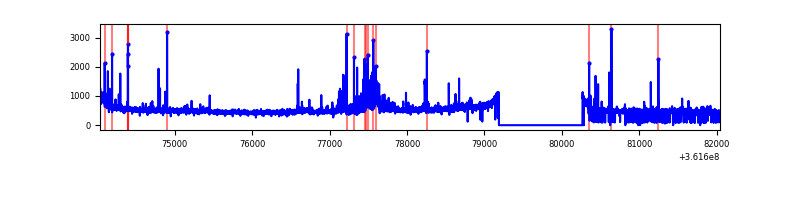 |
Top three noisy pixels from each quadrant. If the there are fewer than three noisy pixels in the level2.evt file, extra rows are filled as -1
| Pixel properties | Quadrant properties | ||||||
|---|---|---|---|---|---|---|---|
| Quadrant | DetID | PixID | Counts | Sigma | Mean | Median | Sigma |
| A | 13 | 254 | 12661 | 67.25 | 878 | 859 | 175.5 |
| A | 3 | 137 | 8405 | 43.0 | 878 | 859 | 175.5 |
| A | 0 | 226 | 7486 | 37.76 | 878 | 859 | 175.5 |
| B | 6 | 159 | 1839719 | 11259.84 | 864 | 845 | 163.3 |
| B | 0 | 190 | 58868 | 355.29 | 864 | 845 | 163.3 |
| B | 12 | 16 | 26883 | 159.44 | 864 | 845 | 163.3 |
| C | 14 | 238 | 185177 | 934.06 | 840 | 848 | 197.3 |
| C | 0 | 10 | 91444 | 459.08 | 840 | 848 | 197.3 |
| C | 14 | 254 | 71711 | 359.09 | 840 | 848 | 197.3 |
| D | 8 | 195 | 204223 | 1005.28 | 858 | 838 | 202.3 |
| D | 2 | 250 | 146814 | 721.52 | 858 | 838 | 202.3 |
| D | 12 | 233 | 64167 | 313.02 | 858 | 838 | 202.3 |
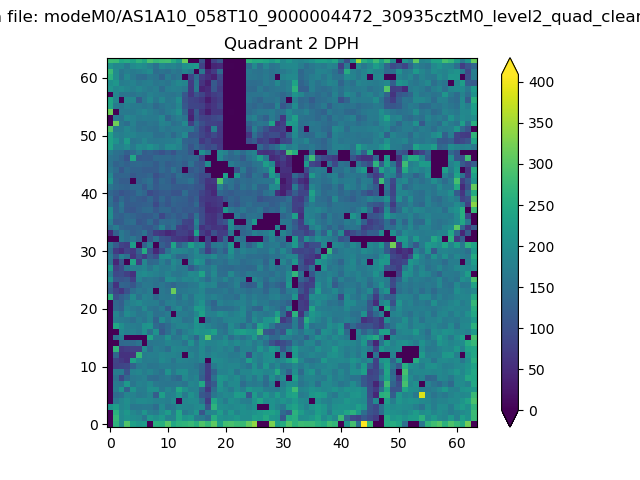
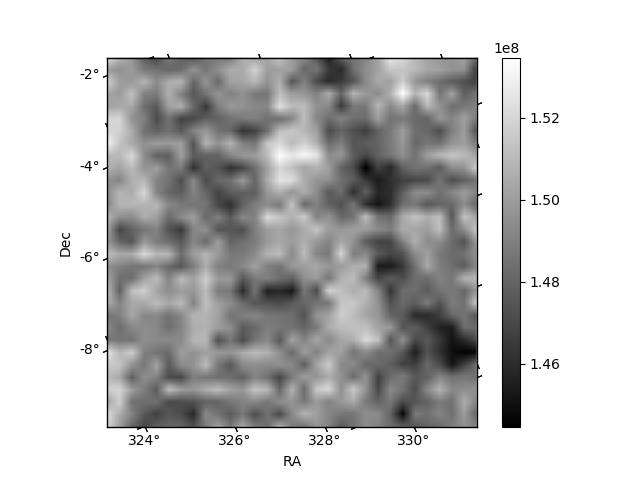
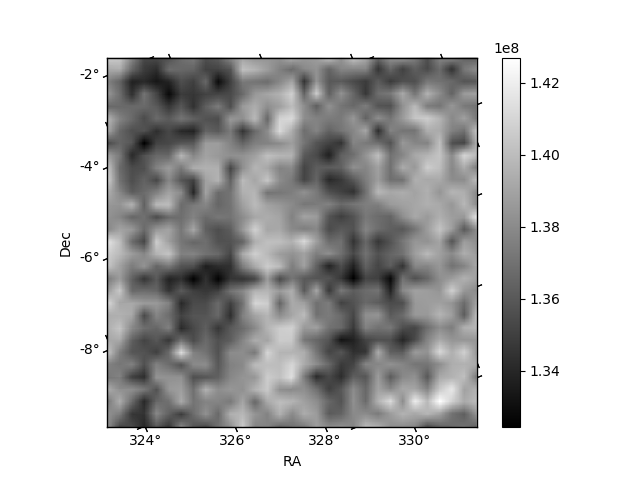
Histogram calculated using DETX and DETY for each event in the final _common_clean file
| Quadrant A | 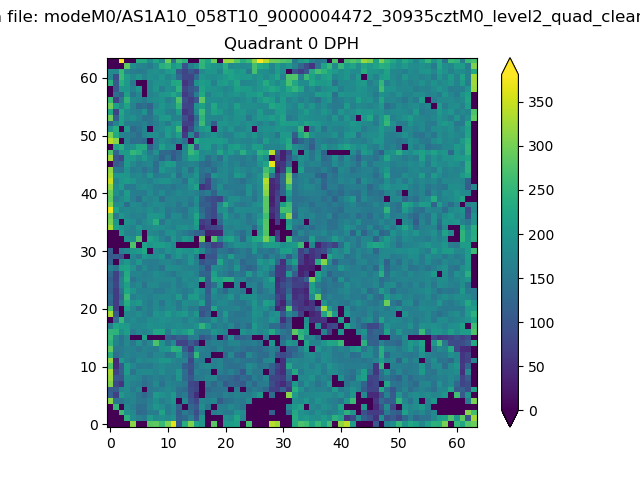 |
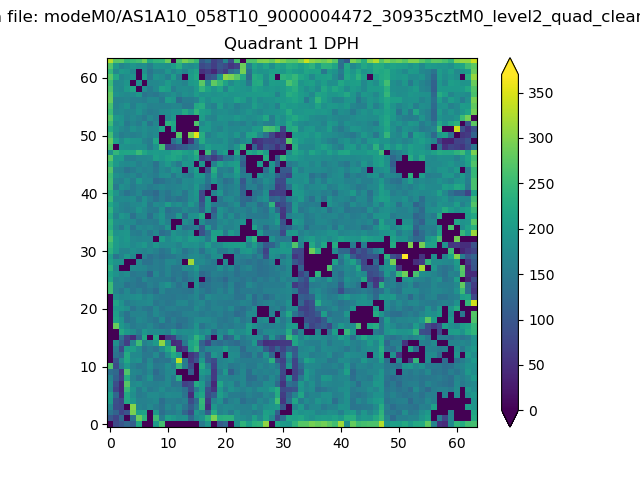 |
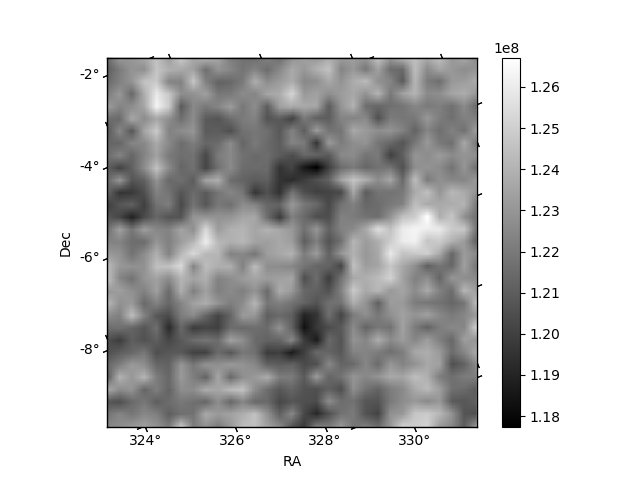
Quadrant B |
|---|---|---|---|
| Quadrant D | 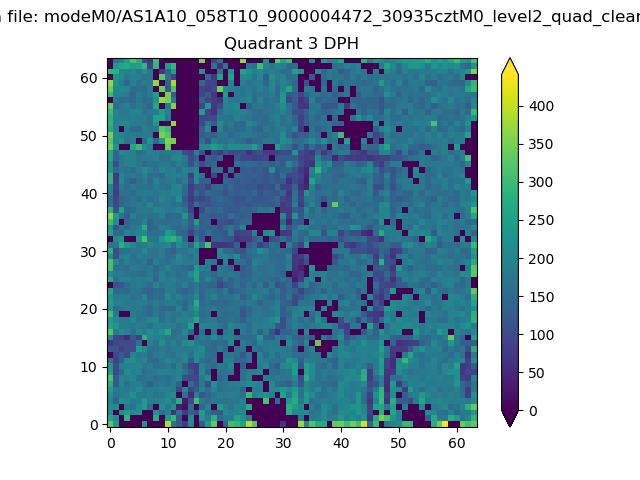 |
 |
Quadrant C |
| Plot type | Count rate plots | Images |
|---|---|---|
| Comparison with Poisson distribution Blue bars denote a histogram of data divided into 1 sec bins. Red curve is a Poisson curve with rate = median count rate of data. |
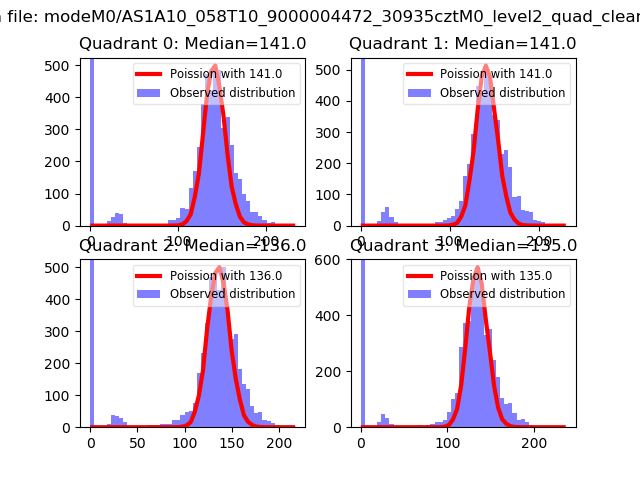 |
 |
| Quadrant-wise count rates Data is divided into 100 sec bins |
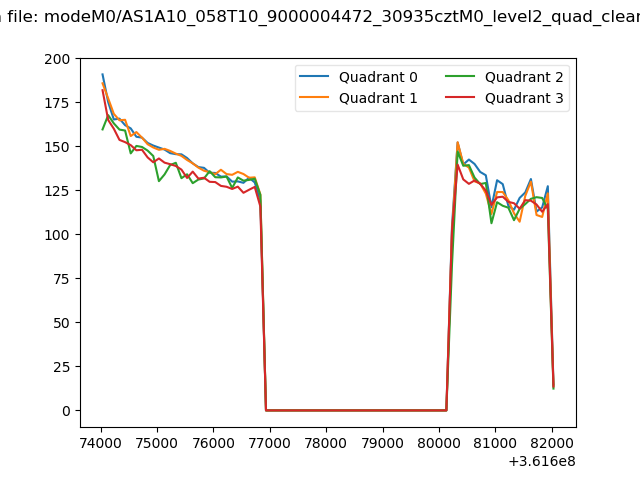 |
|
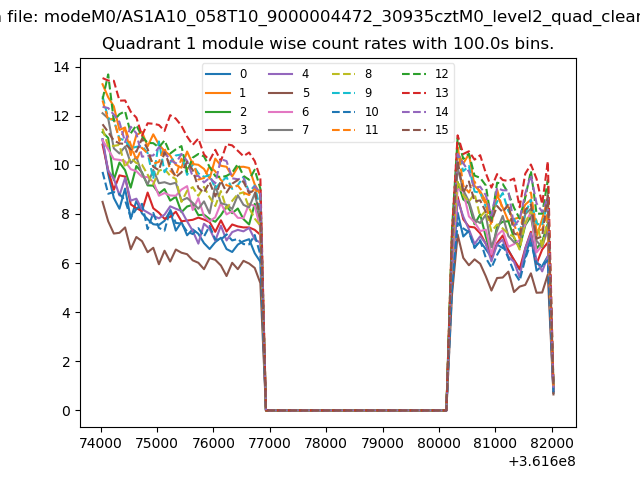
| Module-wise count rates for Quadrant A Data is divided into 100 sec bins |
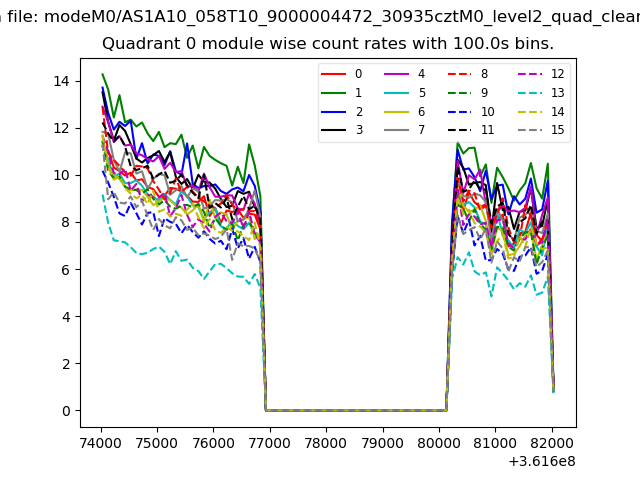 |
 |
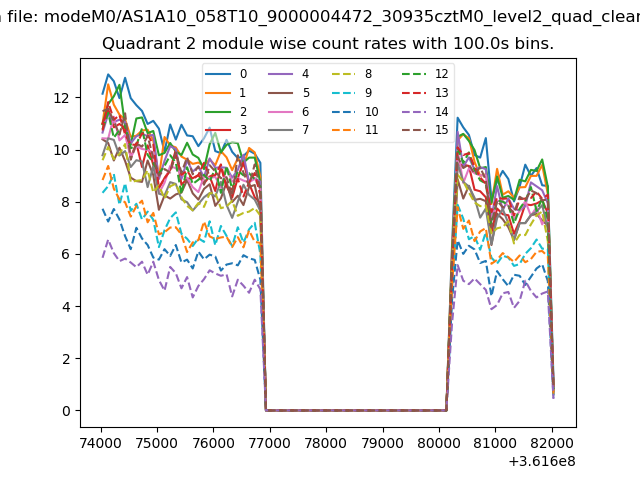
| Module-wise count rates for Quadrant B Data is divided into 100 sec bins |
 |
 |
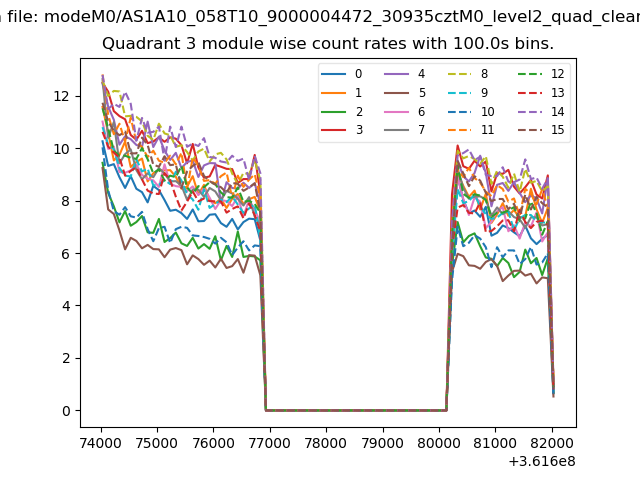
| Module-wise count rates for Quadrant C Data is divided into 100 sec bins |
 |
 |
| Module-wise count rates for Quadrant D Data is divided into 100 sec bins |
 |
 |
| Parameter | Plot |
|---|---|
| CZT HV Monitor | 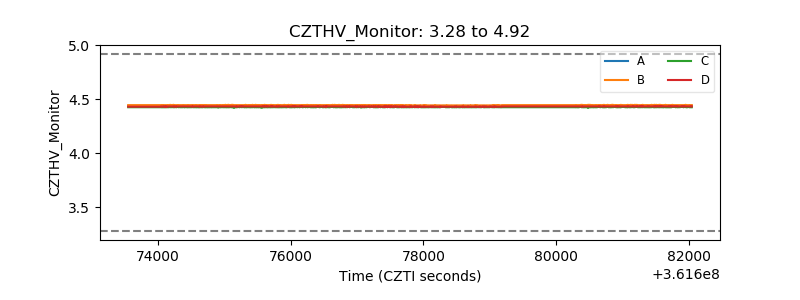 |
| D_VDD | 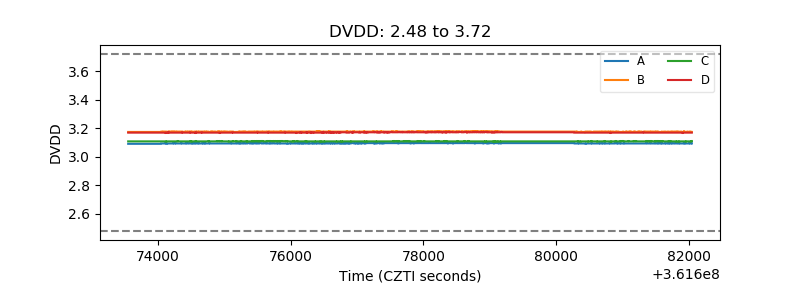 |
| Temperature 1 | 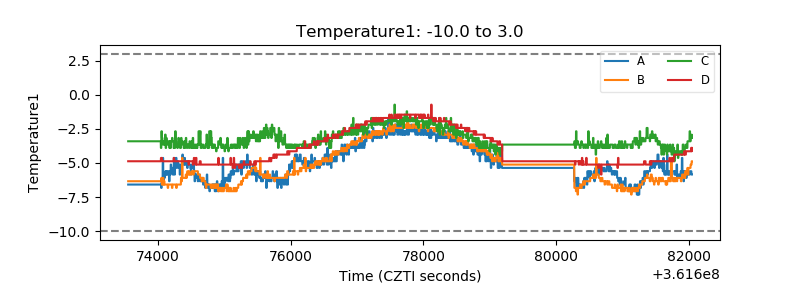 |
| Veto HV Monitor | 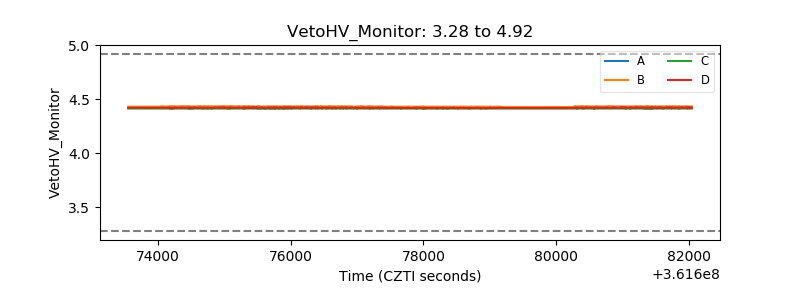 |
| Veto LLD | 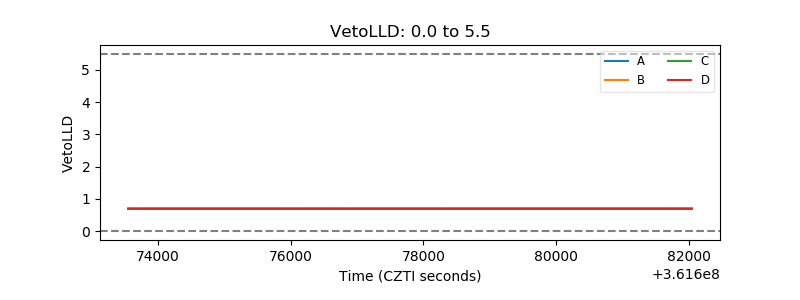 |
| Alpha Counter | 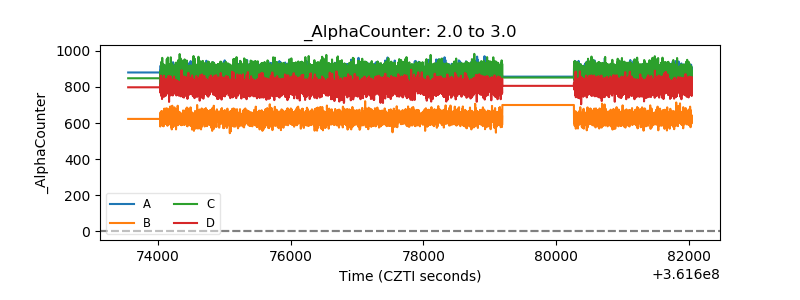 |
| _CPM_Rate | 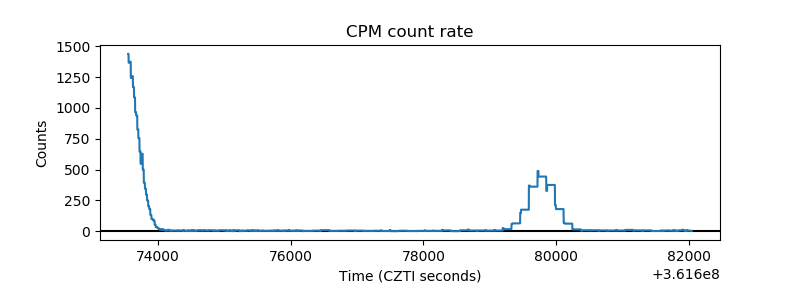 |
| CZT Counter | 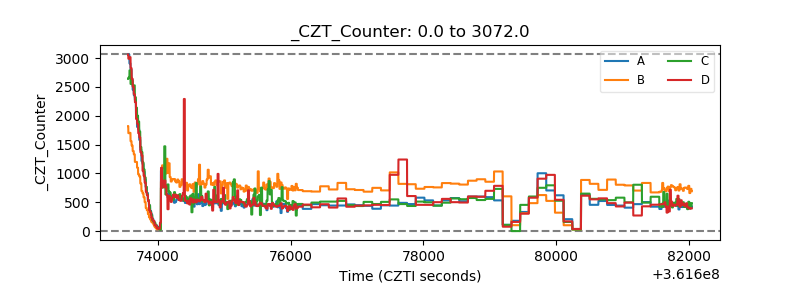 |
| +2.5 Volts monitor |  |
| +5 Volts monitor |  |
| _ROLL_ROT | 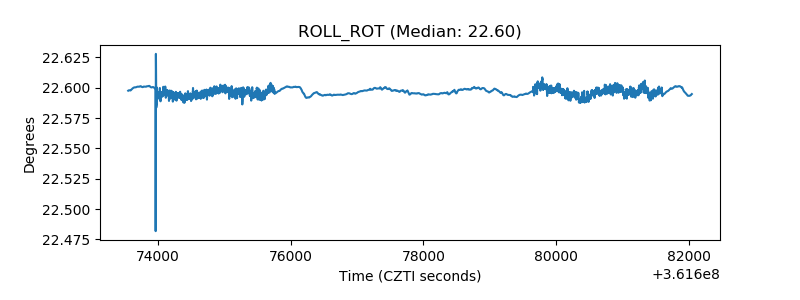 |
| _Roll_DEC | 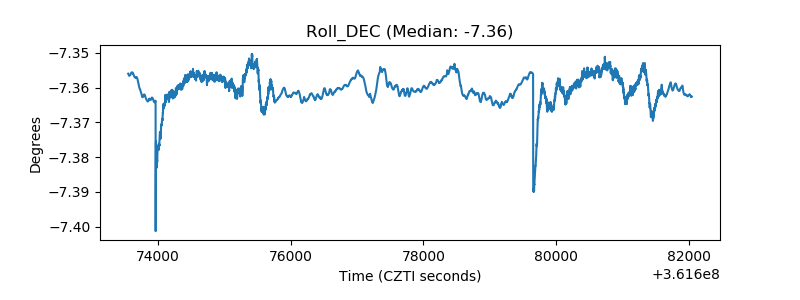 |
| _Roll_RA | 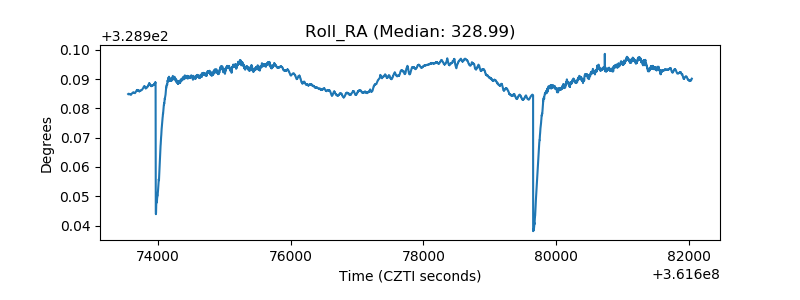 |
| Veto Counter | 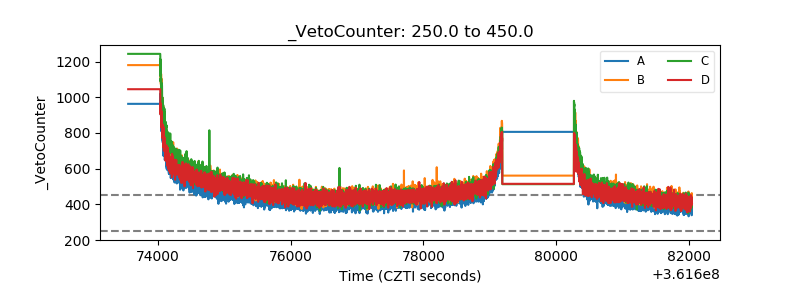 |