| Param | Original file | Final file |
|---|---|---|
| Filename | modeM0/AS1A10_058T10_9000004472_30936cztM0_level2.evt | modeM0/AS1A10_058T10_9000004472_30936cztM0_level2_quad_clean.evt |
| Size (bytes) | 47,658,240 | 12,830,400 |
| Size | 45.5 MB | 12.2 MB |
| Events in quadrant A | 300,481 | 88,172 |
| Events in quadrant B | 458,739 | 79,886 |
| Events in quadrant C | 328,623 | 82,750 |
| Events in quadrant D | 307,581 | 83,820 |
| Mode M0 | |||
|---|---|---|---|
| Quadrant | BADHDUFLAG | Total packets | Discarded packets |
| A | 0 | 2656 | 1304 |
| B | 0 | 3963 | 2145 |
| C | 0 | 2768 | 1388 |
| D | 0 | 2732 | 1376 |
| Mode M9 | |||
|---|---|---|---|
| Quadrant | BADHDUFLAG | Total packets | Discarded packets |
| A | 1 | 140325616880424 | 46 |
| B | 1 | -1 | -1 |
| C | 1 | -1 | -1 |
| D | 1 | -1 | -1 |
| Mode SS | |||
|---|---|---|---|
| Quadrant | BADHDUFLAG | Total packets | Discarded packets |
| A | 0 | 29 | 15 |
| B | 0 | 27 | 15 |
| C | 0 | 26 | 10 |
| D | 0 | 27 | 13 |
| Quadrant | Total seconds | Saturated seconds | Saturation percentage |
|---|---|---|---|
| A | 673 | 0 | 0.000000% |
| B | 607 | 1 | 0.164745% |
| C | 653 | 15 | 2.297090% |
| D | 666 | 1 | 0.150150% |
Noise dominated data is calculated using 1-second bins in cleaned event files. If a bin has >2000 counts, and if more than 50% of those come from <1% of pixels, then it is considered to be noise-dominated and hence unusable.
| Quadrant | # 1 sec bins | Bins with >0 counts | Bins with >2000 counts | High rate bins dominated by noise | Noise dominated (total time) | Noise dominated (detector-on time) | Marked lightcurve |
|---|---|---|---|---|---|---|---|
| A | 7271 | 828 | 0 | 0 | 0.00% | 0.00% | 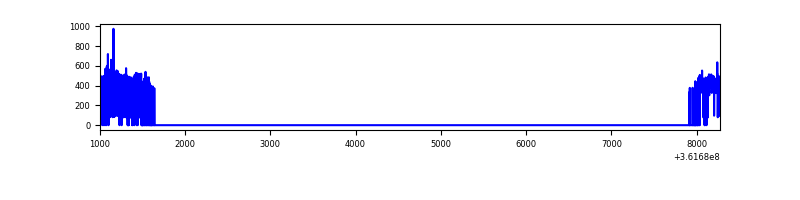 |
| B | 7271 | 758 | 0 | 0 | 0.00% | 0.00% | 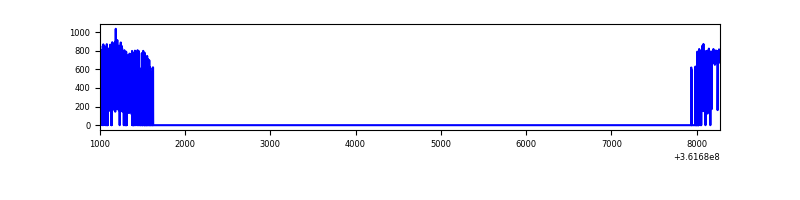 |
| C | 7271 | 800 | 0 | 0 | 0.00% | 0.00% | 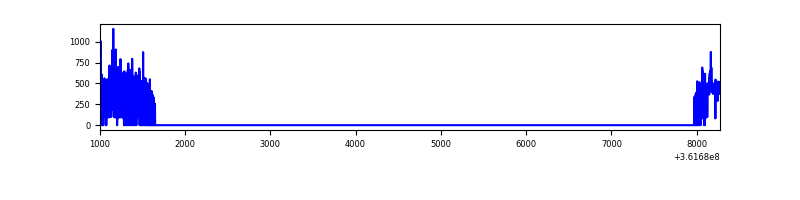 |
| D | 7270 | 826 | 0 | 0 | 0.00% | 0.00% | 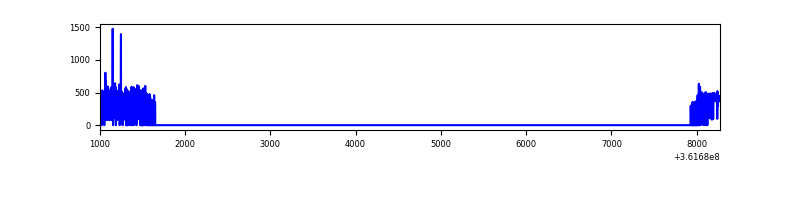 |
Top three noisy pixels from each quadrant. If the there are fewer than three noisy pixels in the level2.evt file, extra rows are filled as -1
| Pixel properties | Quadrant properties | ||||||
|---|---|---|---|---|---|---|---|
| Quadrant | DetID | PixID | Counts | Sigma | Mean | Median | Sigma |
| A | 13 | 254 | 1241 | 65.75 | 77 | 76 | 17.7 |
| A | 3 | 137 | 722 | 36.46 | 77 | 76 | 17.7 |
| A | 0 | 226 | 675 | 33.81 | 77 | 76 | 17.7 |
| B | 6 | 159 | 184927 | 11901.05 | 69 | 68 | 15.5 |
| B | 12 | 111 | 1651 | 101.91 | 69 | 68 | 15.5 |
| B | 14 | 111 | 1435 | 88.01 | 69 | 68 | 15.5 |
| C | 14 | 238 | 16972 | 870.4 | 73 | 73 | 19.4 |
| C | 0 | 10 | 9268 | 473.6 | 73 | 73 | 19.4 |
| C | 14 | 254 | 7835 | 399.79 | 73 | 73 | 19.4 |
| D | 8 | 195 | 19318 | 958.75 | 75 | 73 | 20.1 |
| D | 2 | 250 | 3154 | 153.49 | 75 | 73 | 20.1 |
| D | 12 | 227 | 2441 | 117.97 | 75 | 73 | 20.1 |
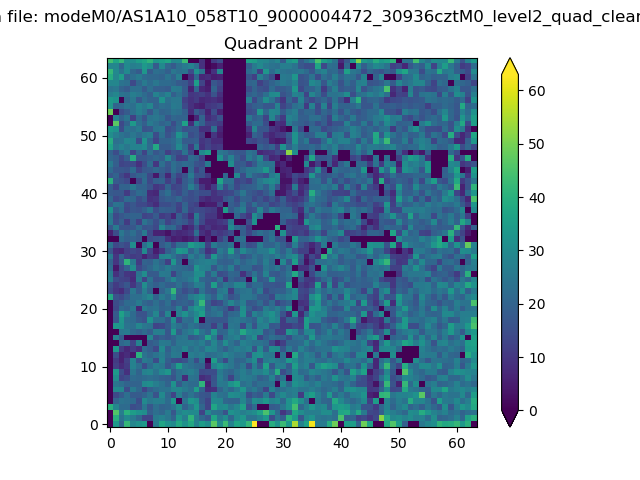
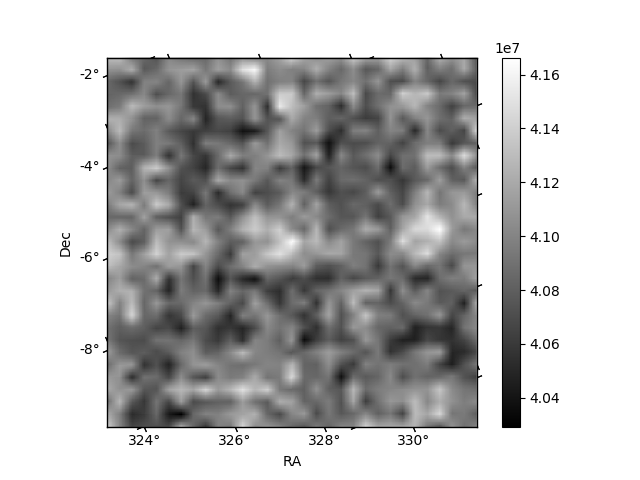
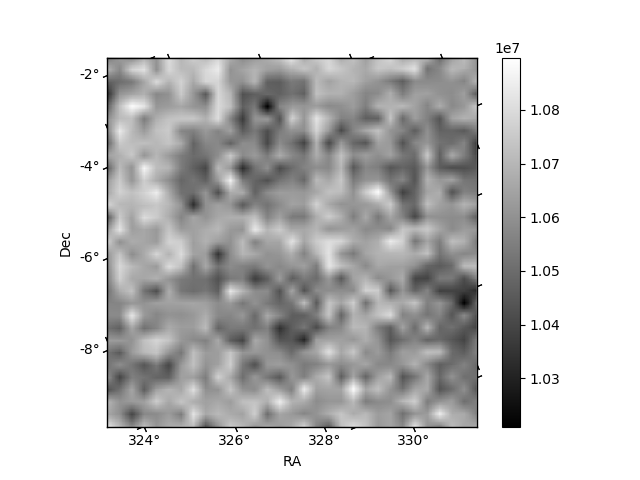
Histogram calculated using DETX and DETY for each event in the final _common_clean file
| Quadrant A | 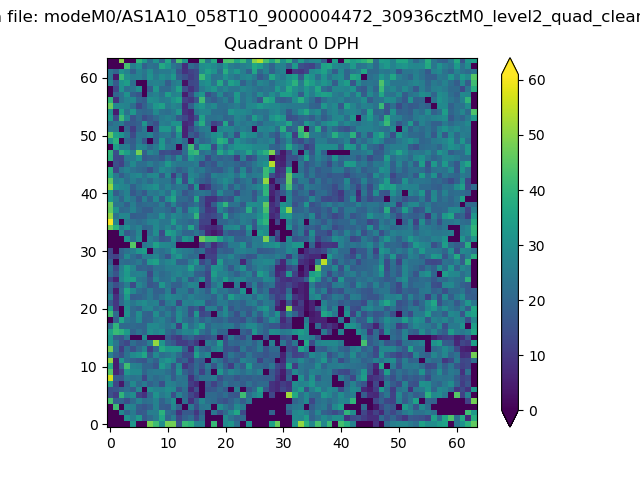 |
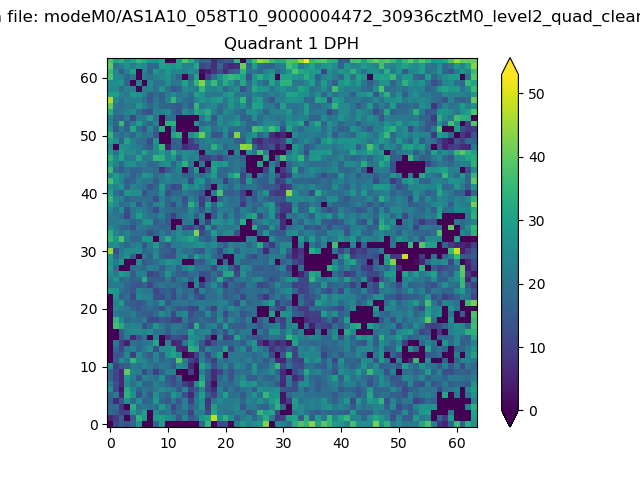 |
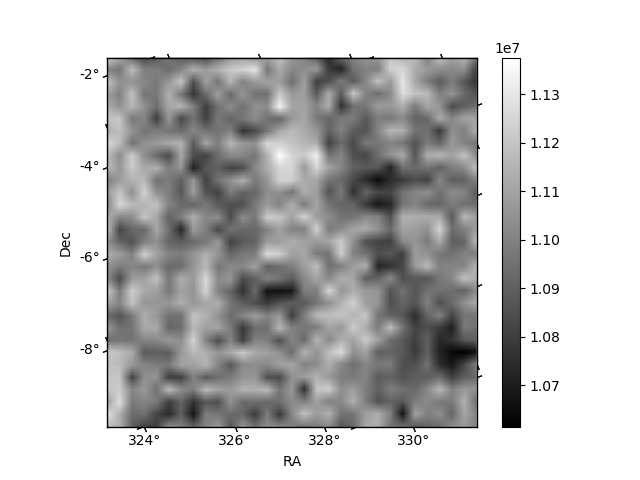
Quadrant B |
|---|---|---|---|
| Quadrant D | 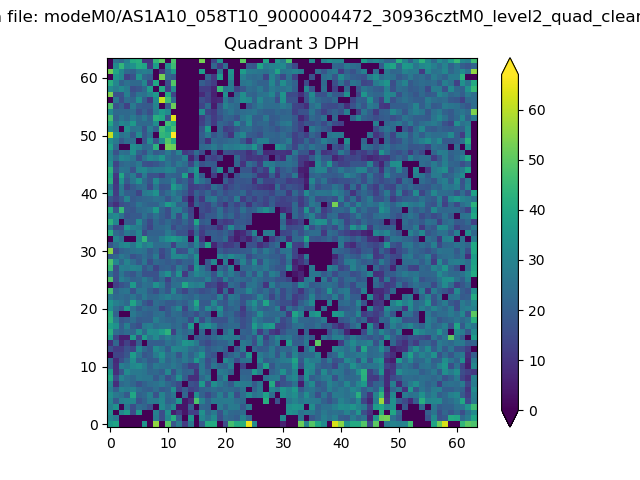 |
 |
Quadrant C |
| Plot type | Count rate plots | Images |
|---|---|---|
| Comparison with Poisson distribution Blue bars denote a histogram of data divided into 1 sec bins. Red curve is a Poisson curve with rate = median count rate of data. |
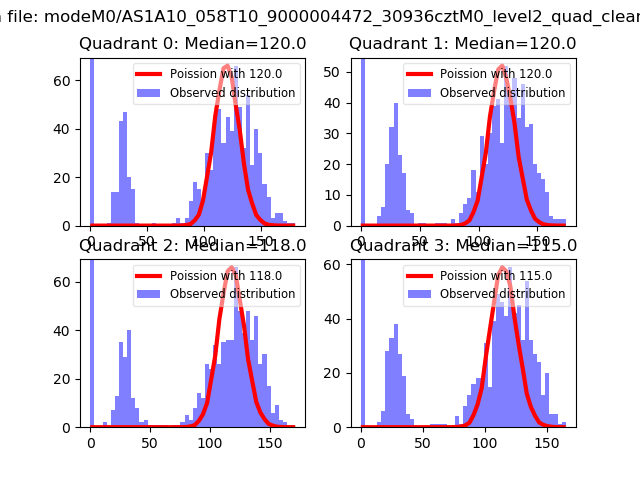 |
 |
| Quadrant-wise count rates Data is divided into 100 sec bins |
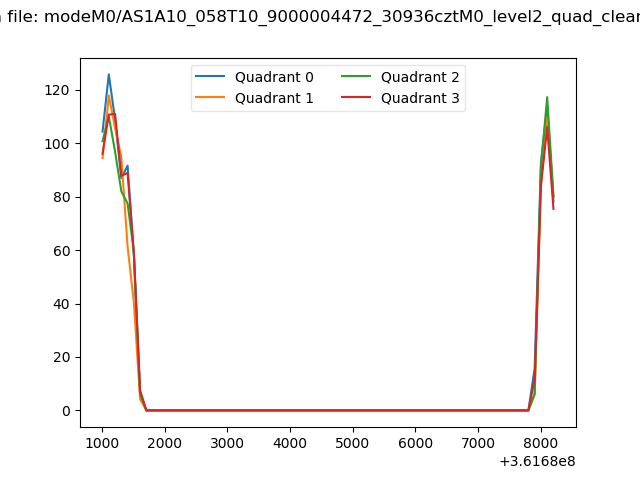 |
|
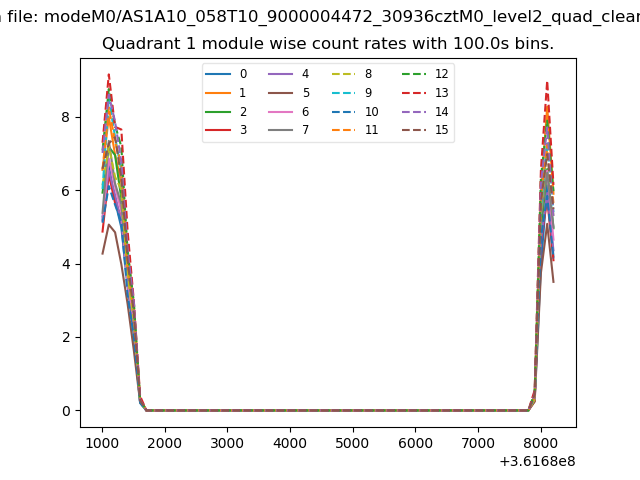
| Module-wise count rates for Quadrant A Data is divided into 100 sec bins |
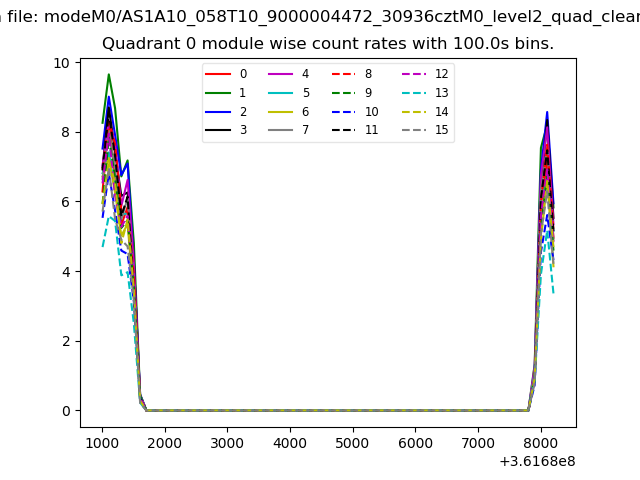 |
 |
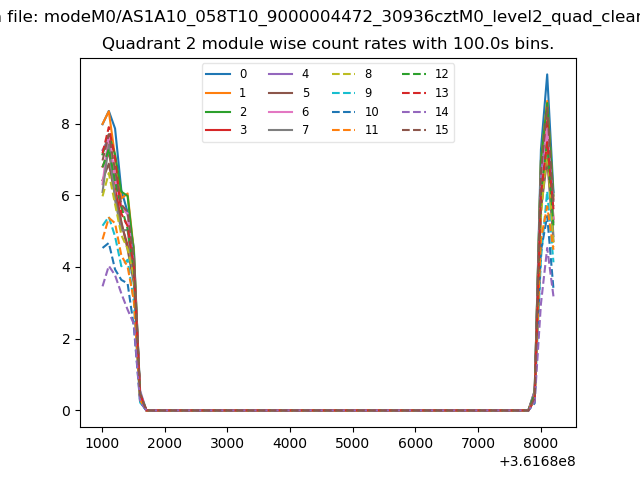
| Module-wise count rates for Quadrant B Data is divided into 100 sec bins |
 |
 |
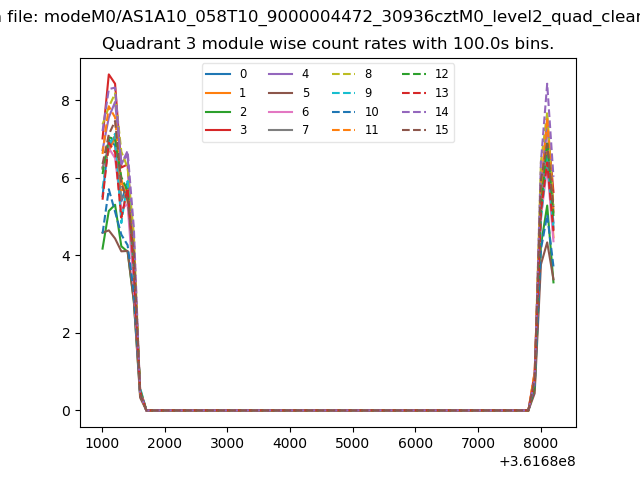
| Module-wise count rates for Quadrant C Data is divided into 100 sec bins |
 |
 |
| Module-wise count rates for Quadrant D Data is divided into 100 sec bins |
 |
 |
| Parameter | Plot |
|---|---|
| CZT HV Monitor | 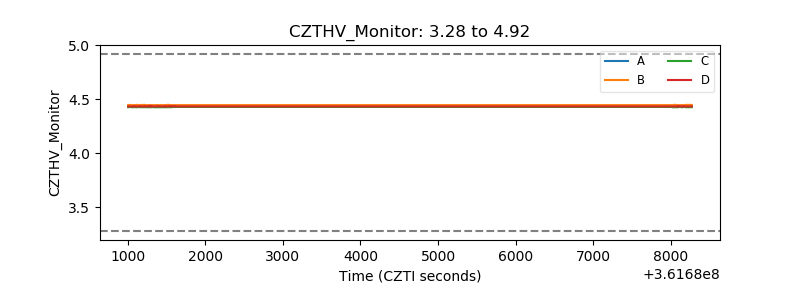 |
| D_VDD | 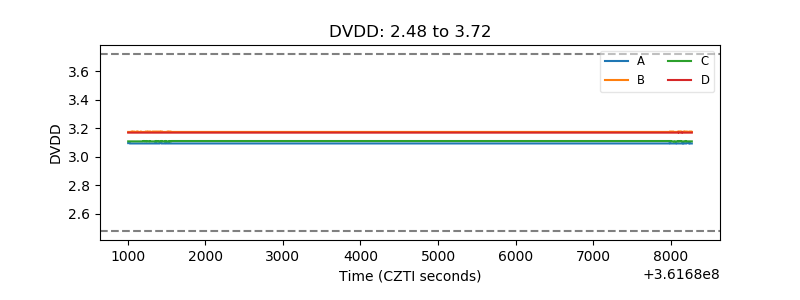 |
| Temperature 1 |  |
| Veto HV Monitor | 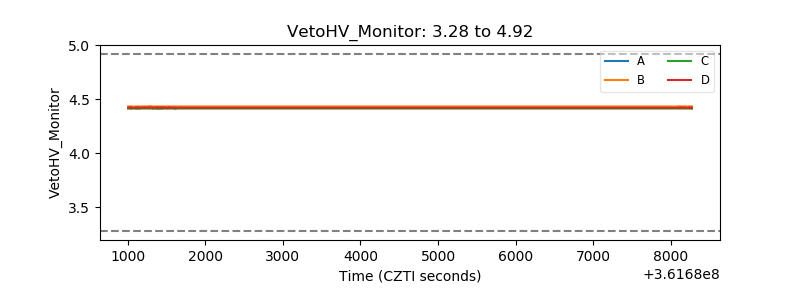 |
| Veto LLD | 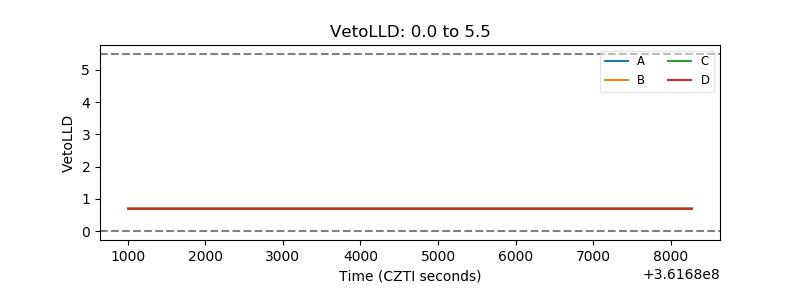 |
| Alpha Counter | 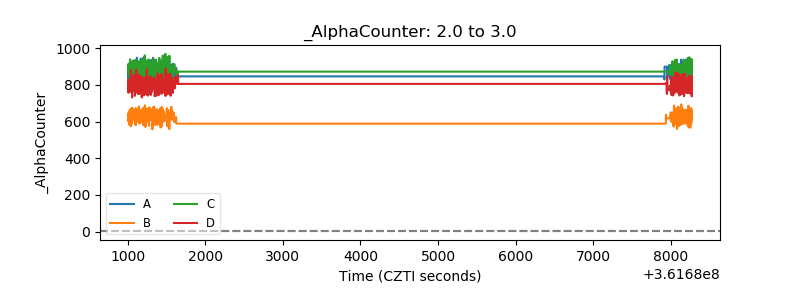 |
| _CPM_Rate | 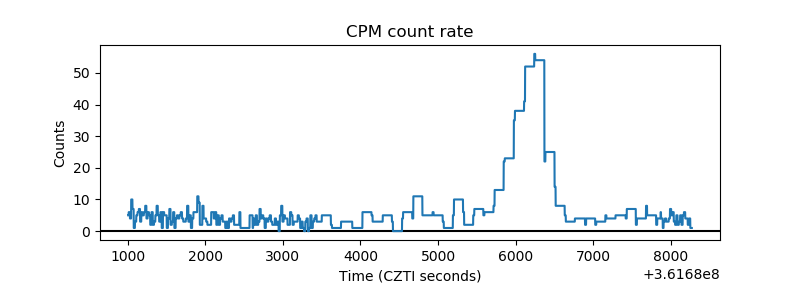 |
| CZT Counter |  |
| +2.5 Volts monitor |  |
| +5 Volts monitor |  |
| _ROLL_ROT | 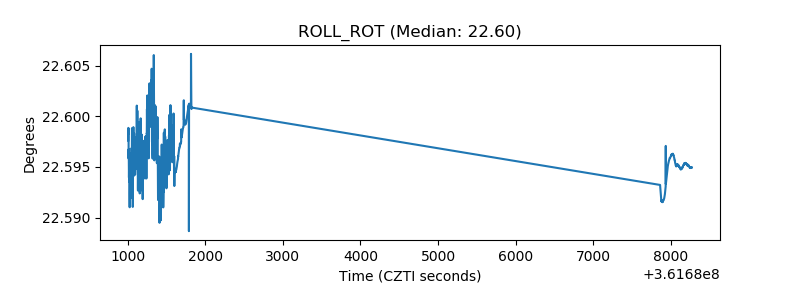 |
| _Roll_DEC | 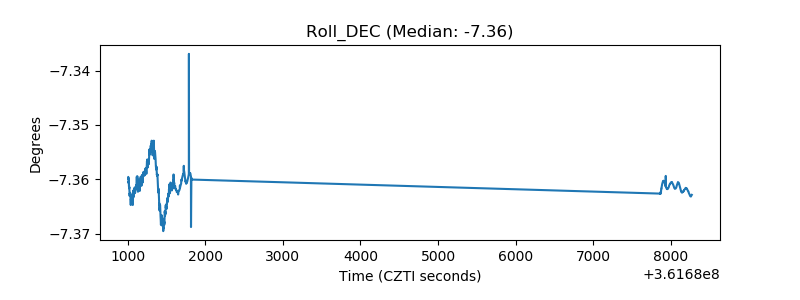 |
| _Roll_RA | 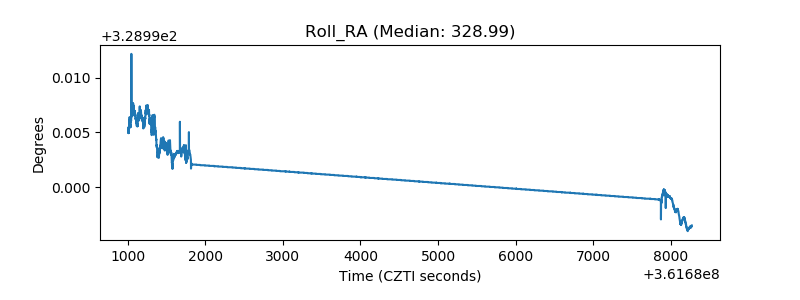 |
| Veto Counter | 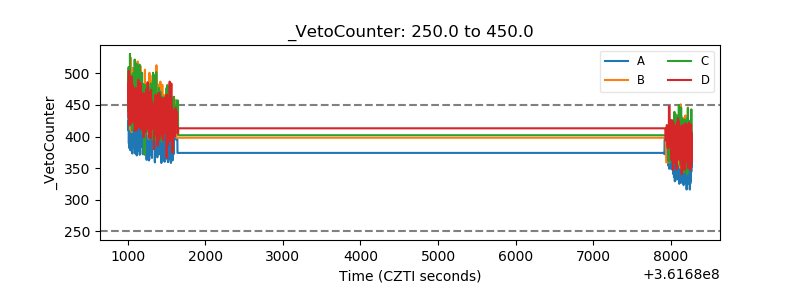 |