| Param | Original file | Final file |
|---|---|---|
| Filename | modeM0/AS1A10_058T10_9000004472_30938cztM0_level2.evt | modeM0/AS1A10_058T10_9000004472_30938cztM0_level2_quad_clean.evt |
| Size (bytes) | 621,673,920 | 105,992,640 |
| Size | 592.9 MB | 101.1 MB |
| Events in quadrant A | 3,789,918 | 680,770 |
| Events in quadrant B | 6,343,875 | 672,630 |
| Events in quadrant C | 4,032,765 | 652,959 |
| Events in quadrant D | 4,123,075 | 651,519 |
| Mode M0 | |||
|---|---|---|---|
| Quadrant | BADHDUFLAG | Total packets | Discarded packets |
| A | 0 | 16345 | 1 |
| B | 0 | 24803 | 0 |
| C | 0 | 16847 | 0 |
| D | 0 | 17041 | 0 |
| Mode SS | |||
|---|---|---|---|
| Quadrant | BADHDUFLAG | Total packets | Discarded packets |
| A | 0 | 160 | 0 |
| B | 0 | 160 | 0 |
| C | 0 | 160 | 0 |
| D | 0 | 160 | 0 |
| Quadrant | Total seconds | Saturated seconds | Saturation percentage |
|---|---|---|---|
| A | 7931 | 230 | 2.900013% |
| B | 7931 | 381 | 4.803934% |
| C | 7931 | 335 | 4.223931% |
| D | 7931 | 189 | 2.383054% |
Noise dominated data is calculated using 1-second bins in cleaned event files. If a bin has >2000 counts, and if more than 50% of those come from <1% of pixels, then it is considered to be noise-dominated and hence unusable.
| Quadrant | # 1 sec bins | Bins with >0 counts | Bins with >2000 counts | High rate bins dominated by noise | Noise dominated (total time) | Noise dominated (detector-on time) | Marked lightcurve |
|---|---|---|---|---|---|---|---|
| A | 7931 | 7931 | 0 | 0 | 0.00% | 0.00% | 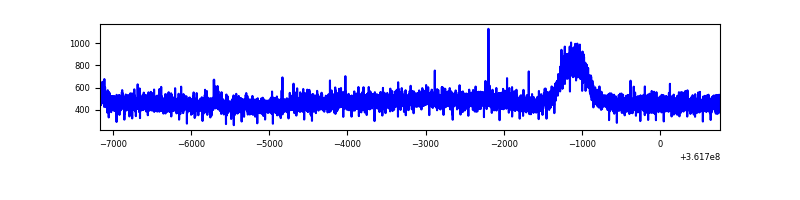 |
| B | 7931 | 7931 | 56 | 56 | 0.71% | 0.71% | 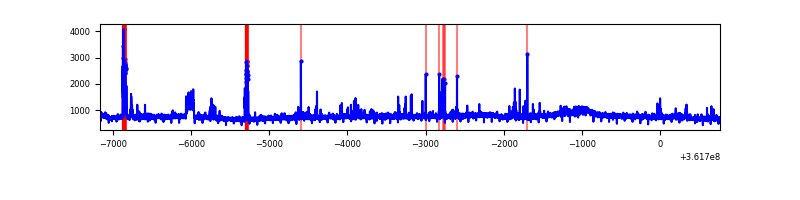 |
| C | 7931 | 7931 | 1 | 1 | 0.01% | 0.01% | 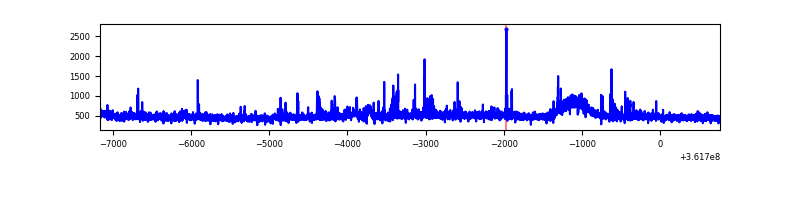 |
| D | 7931 | 7931 | 15 | 15 | 0.19% | 0.19% | 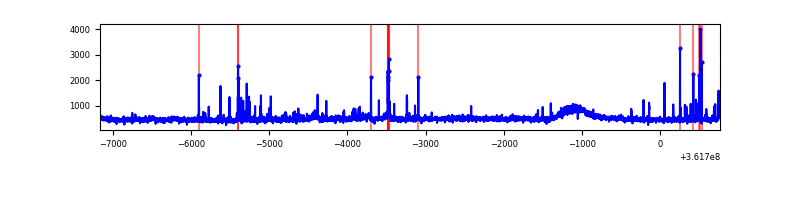 |
Top three noisy pixels from each quadrant. If the there are fewer than three noisy pixels in the level2.evt file, extra rows are filled as -1
| Pixel properties | Quadrant properties | ||||||
|---|---|---|---|---|---|---|---|
| Quadrant | DetID | PixID | Counts | Sigma | Mean | Median | Sigma |
| A | 13 | 254 | 14732 | 69.5 | 979 | 957 | 198.2 |
| A | 3 | 137 | 10293 | 47.1 | 979 | 957 | 198.2 |
| A | 0 | 226 | 8234 | 36.71 | 979 | 957 | 198.2 |
| B | 6 | 159 | 2203328 | 11793.57 | 956 | 931 | 186.7 |
| B | 5 | 172 | 147141 | 782.94 | 956 | 931 | 186.7 |
| B | 0 | 190 | 124309 | 660.67 | 956 | 931 | 186.7 |
| C | 14 | 238 | 182827 | 827.59 | 932 | 938 | 219.8 |
| C | 0 | 10 | 69828 | 313.45 | 932 | 938 | 219.8 |
| C | 14 | 254 | 52621 | 235.16 | 932 | 938 | 219.8 |
| D | 8 | 195 | 344561 | 1500.9 | 956 | 932 | 228.9 |
| D | 2 | 250 | 69397 | 299.04 | 956 | 932 | 228.9 |
| D | 2 | 234 | 42575 | 181.89 | 956 | 932 | 228.9 |
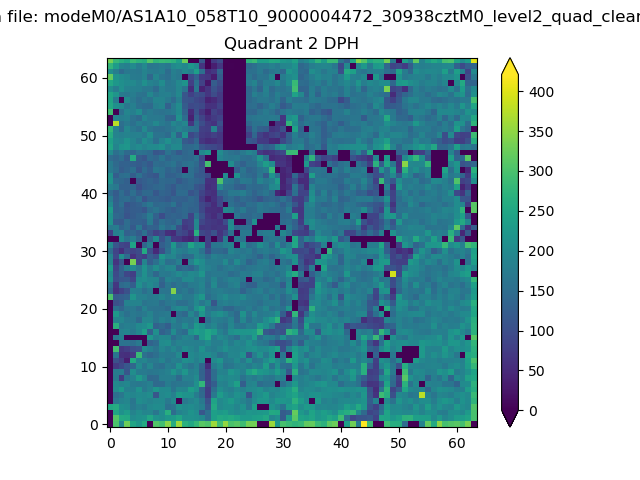
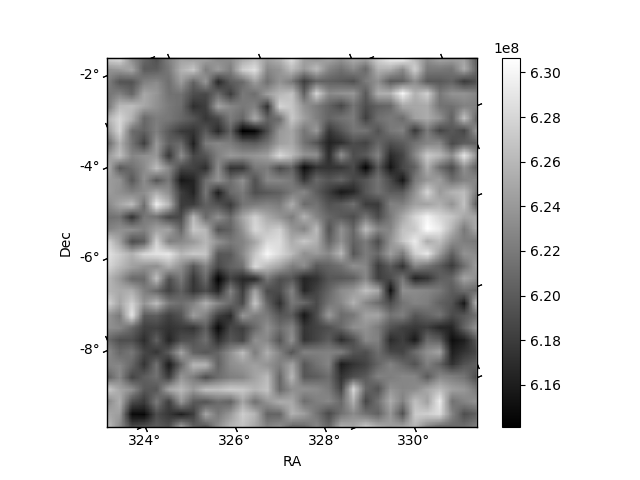
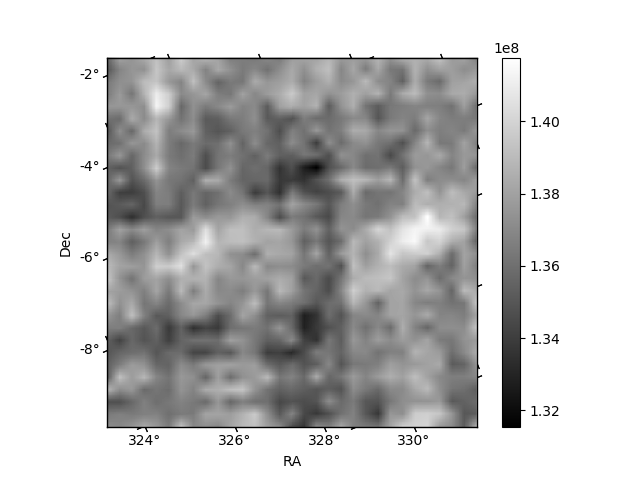
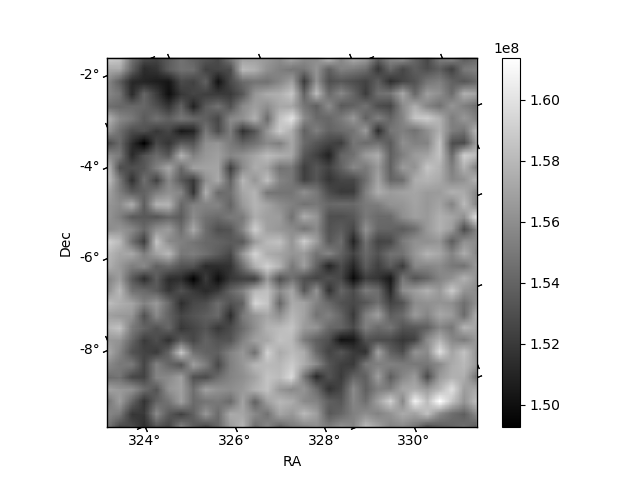
Histogram calculated using DETX and DETY for each event in the final _common_clean file
| Quadrant A | 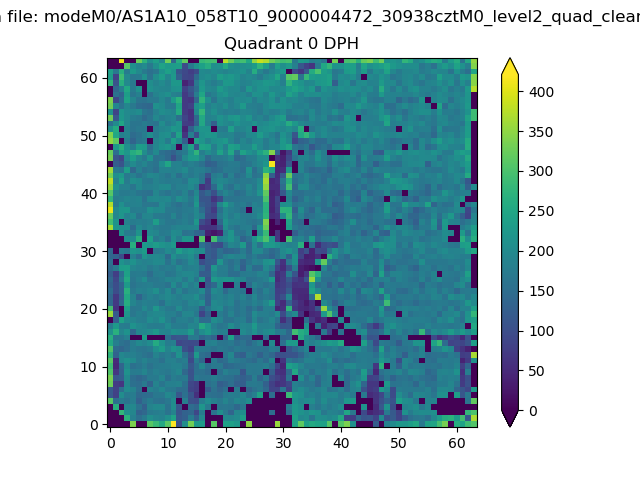 |
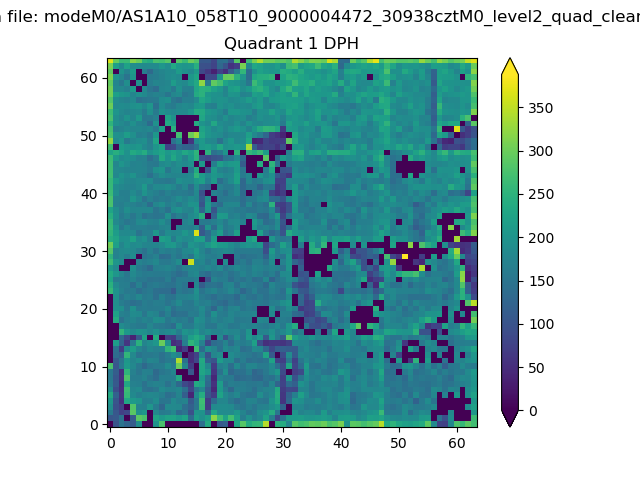 |
Quadrant B |
|---|---|---|---|
| Quadrant D | 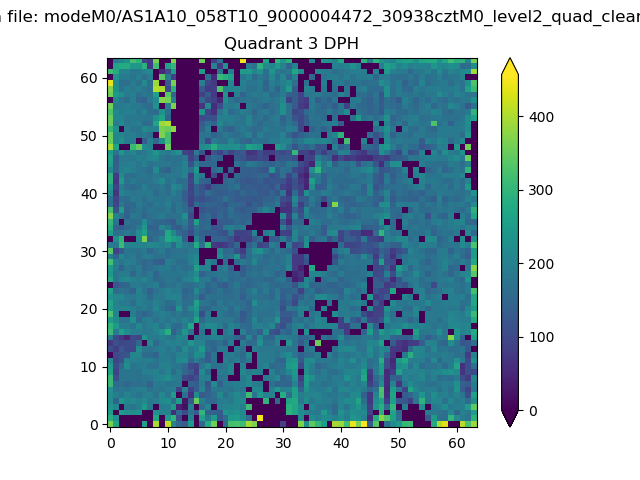 |
 |
Quadrant C |
| Plot type | Count rate plots | Images |
|---|---|---|
| Comparison with Poisson distribution Blue bars denote a histogram of data divided into 1 sec bins. Red curve is a Poisson curve with rate = median count rate of data. |
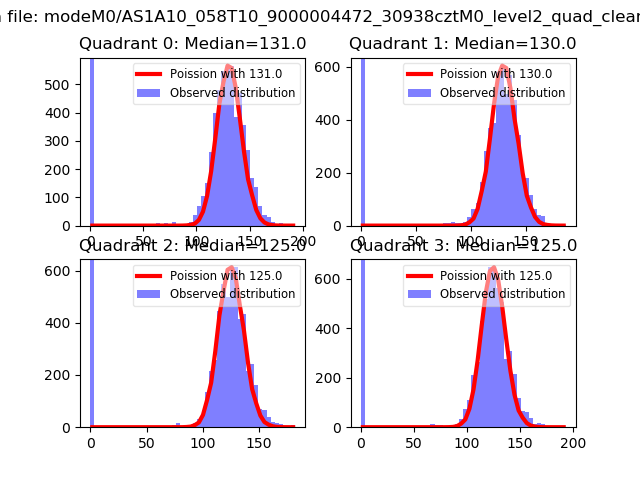 |
 |
| Quadrant-wise count rates Data is divided into 100 sec bins |
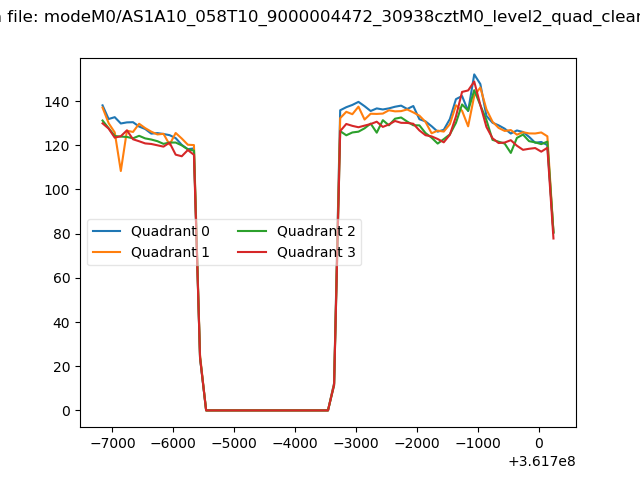 |
|
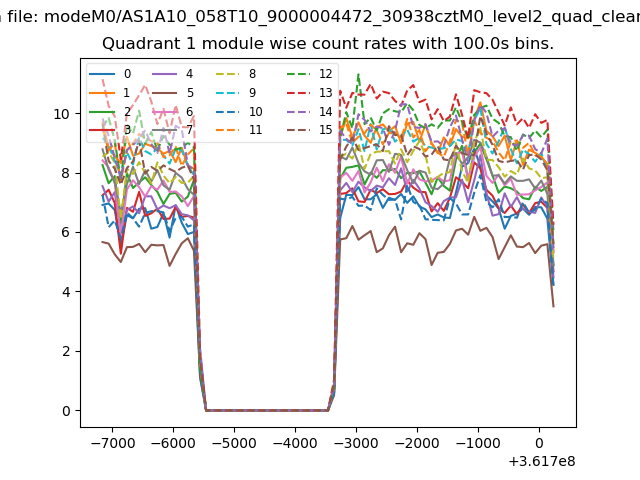
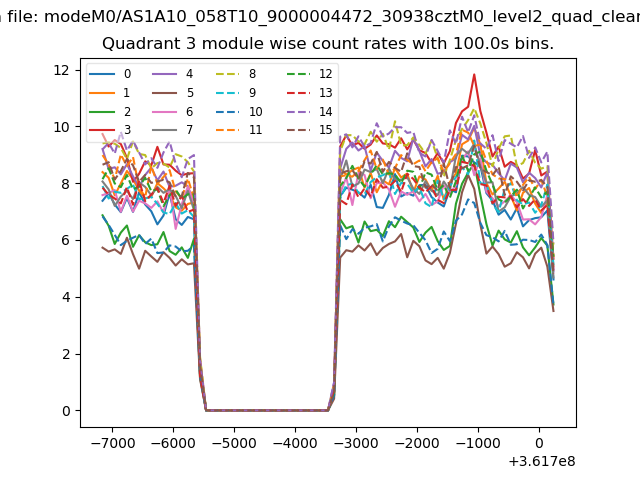
| Module-wise count rates for Quadrant A Data is divided into 100 sec bins |
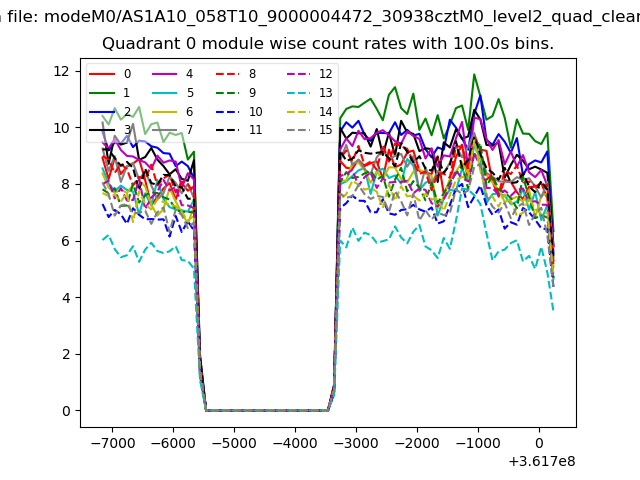 |
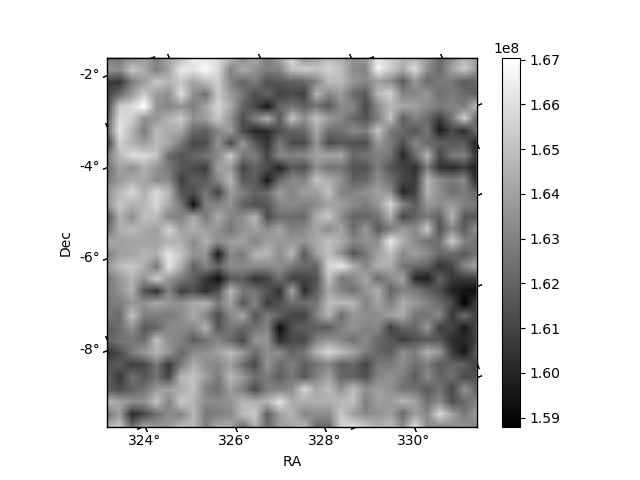 |
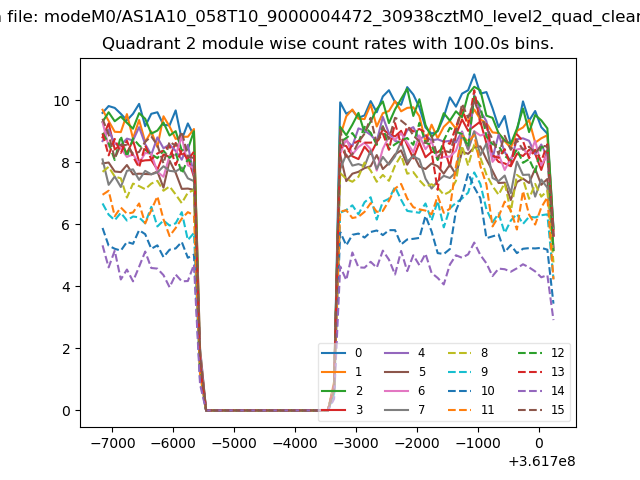
| Module-wise count rates for Quadrant B Data is divided into 100 sec bins |
 |
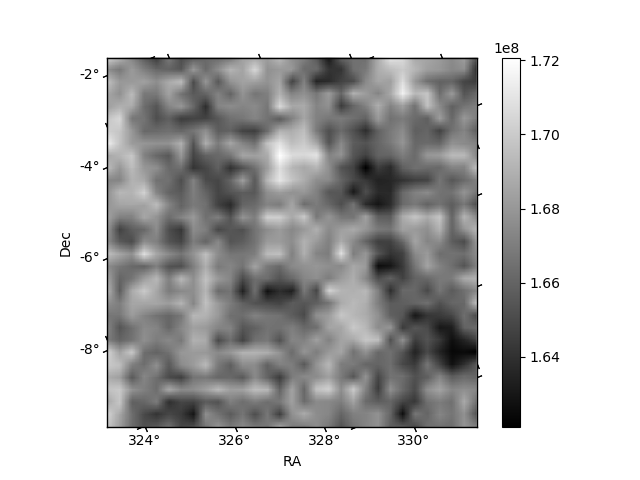 |
| Module-wise count rates for Quadrant C Data is divided into 100 sec bins |
 |
 |
| Module-wise count rates for Quadrant D Data is divided into 100 sec bins |
 |
 |
| Parameter | Plot |
|---|---|
| CZT HV Monitor | 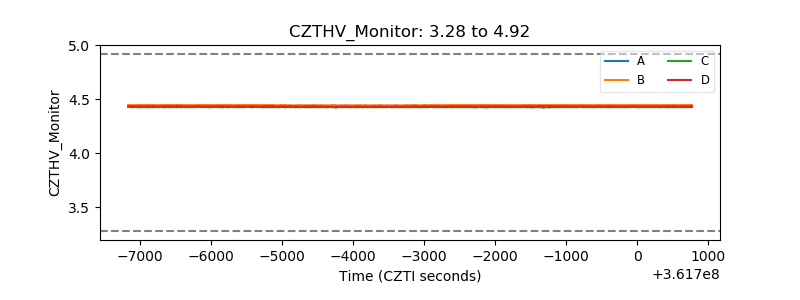 |
| D_VDD | 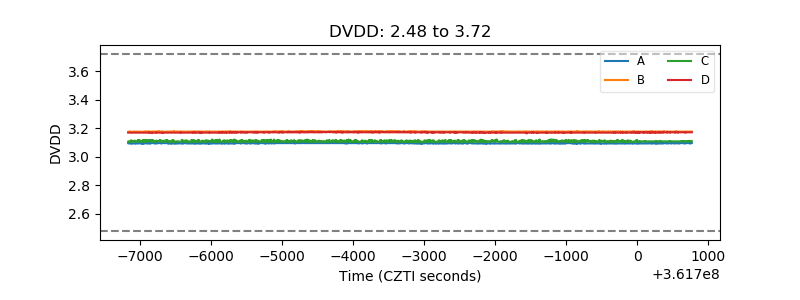 |
| Temperature 1 | 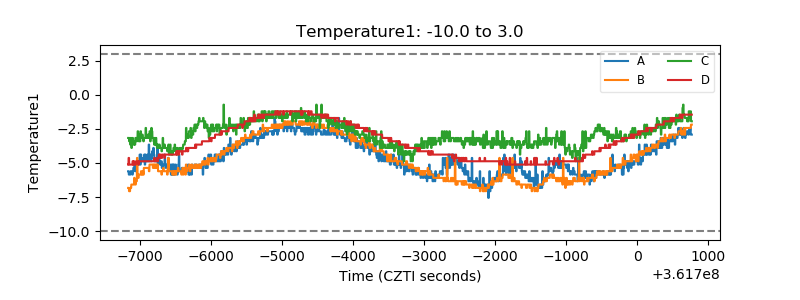 |
| Veto HV Monitor |  |
| Veto LLD | 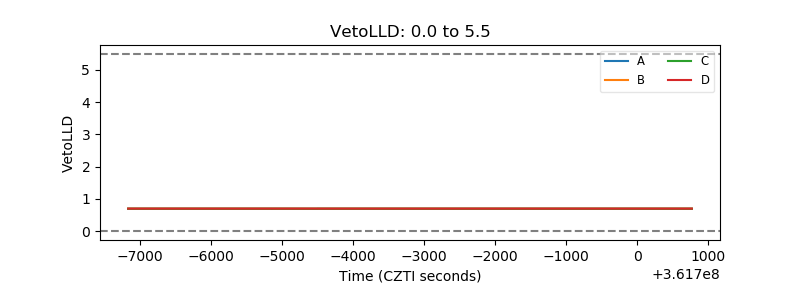 |
| Alpha Counter | 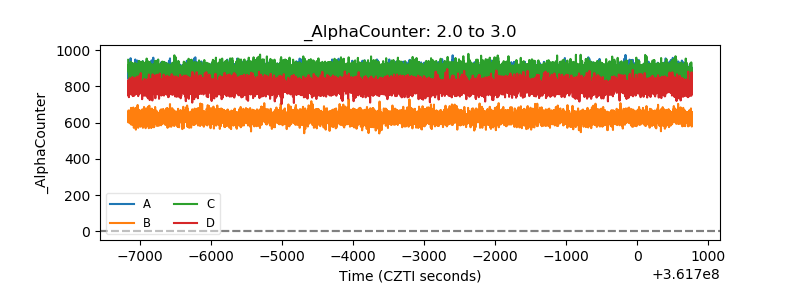 |
| _CPM_Rate | 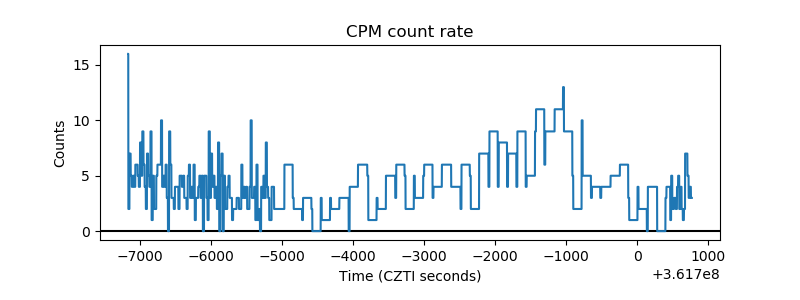 |
| CZT Counter | 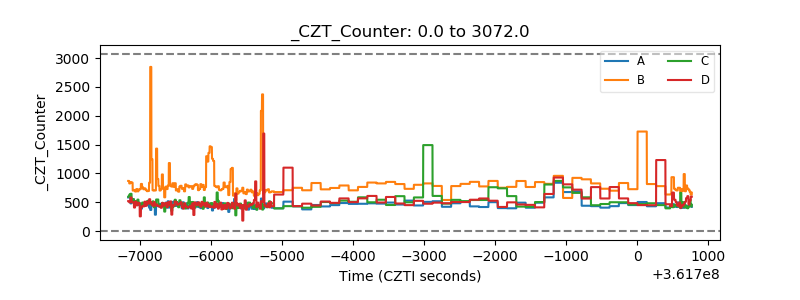 |
| +2.5 Volts monitor |  |
| +5 Volts monitor |  |
| _ROLL_ROT | 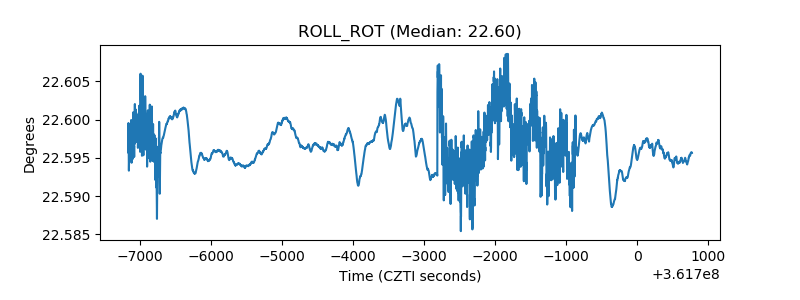 |
| _Roll_DEC | 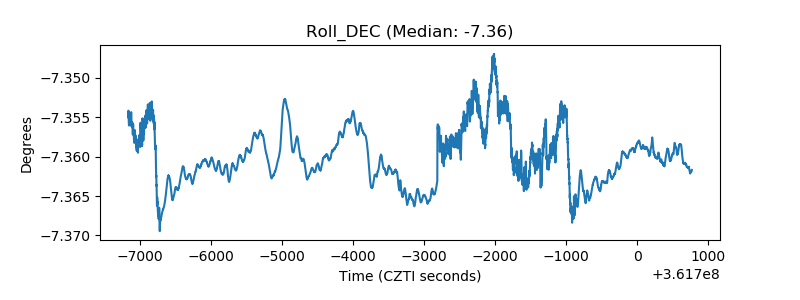 |
| _Roll_RA | 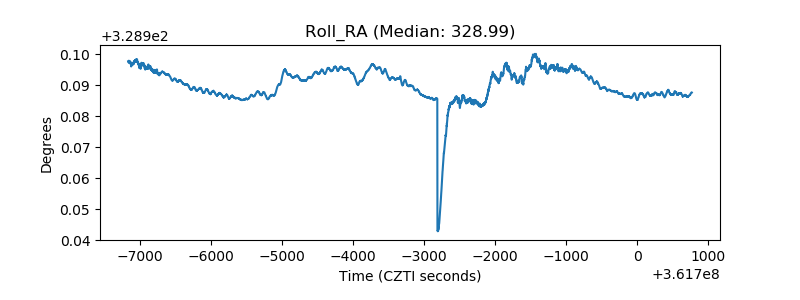 |
| Veto Counter | 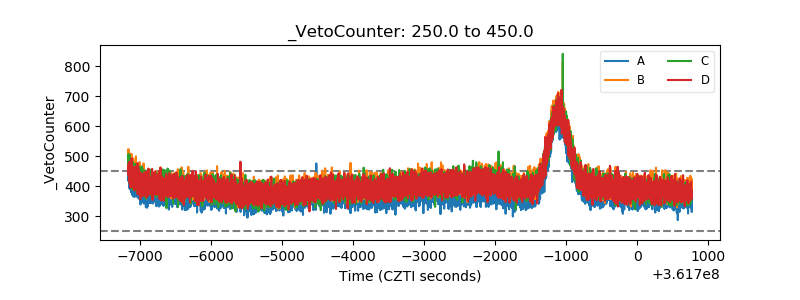 |