| Param | Original file | Final file |
|---|---|---|
| Filename | modeM0/AS1A10_058T10_9000004472_30941cztM0_level2.evt | modeM0/AS1A10_058T10_9000004472_30941cztM0_level2_quad_clean.evt |
| Size (bytes) | 998,562,240 | 138,464,640 |
| Size | 952.3 MB | 132.1 MB |
| Events in quadrant A | 6,033,236 | 858,165 |
| Events in quadrant B | 9,844,341 | 842,579 |
| Events in quadrant C | 6,511,536 | 809,698 |
| Events in quadrant D | 6,996,956 | 807,143 |
| Mode M0 | |||
|---|---|---|---|
| Quadrant | BADHDUFLAG | Total packets | Discarded packets |
| A | 0 | 25875 | 2 |
| B | 0 | 38874 | 2 |
| C | 0 | 26925 | 2 |
| D | 0 | 28474 | 2 |
| Mode M9 | |||
|---|---|---|---|
| Quadrant | BADHDUFLAG | Total packets | Discarded packets |
| A | 0 | 13 | 0 |
| B | 0 | 13 | 0 |
| C | 0 | 13 | 0 |
| D | 0 | 13 | 0 |
| Mode SS | |||
|---|---|---|---|
| Quadrant | BADHDUFLAG | Total packets | Discarded packets |
| A | 0 | 256 | 0 |
| B | 0 | 256 | 0 |
| C | 0 | 256 | 0 |
| D | 0 | 256 | 0 |
| Quadrant | Total seconds | Saturated seconds | Saturation percentage |
|---|---|---|---|
| A | 12670 | 133 | 1.049724% |
| B | 12670 | 291 | 2.296764% |
| C | 12670 | 339 | 2.675612% |
| D | 12669 | 164 | 1.294498% |
Noise dominated data is calculated using 1-second bins in cleaned event files. If a bin has >2000 counts, and if more than 50% of those come from <1% of pixels, then it is considered to be noise-dominated and hence unusable.
| Quadrant | # 1 sec bins | Bins with >0 counts | Bins with >2000 counts | High rate bins dominated by noise | Noise dominated (total time) | Noise dominated (detector-on time) | Marked lightcurve |
|---|---|---|---|---|---|---|---|
| A | 13920 | 12670 | 1 | 1 | 0.01% | 0.01% | 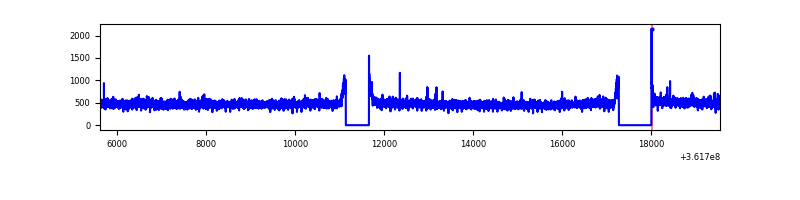 |
| B | 13920 | 12670 | 72 | 72 | 0.52% | 0.57% | 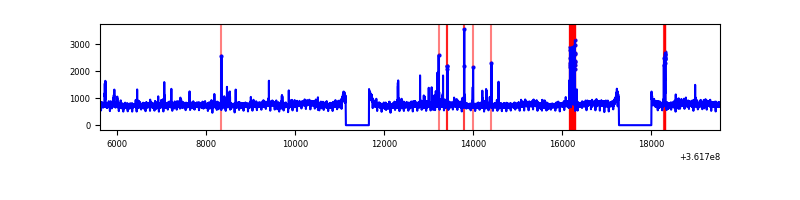 |
| C | 13920 | 12670 | 41 | 41 | 0.29% | 0.32% | 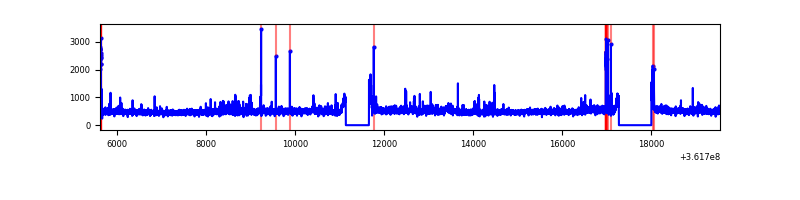 |
| D | 13919 | 12669 | 48 | 48 | 0.34% | 0.38% | 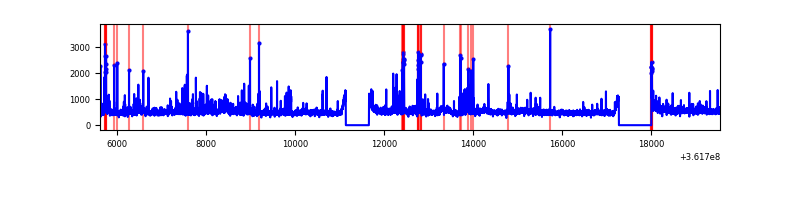 |
Top three noisy pixels from each quadrant. If the there are fewer than three noisy pixels in the level2.evt file, extra rows are filled as -1
| Pixel properties | Quadrant properties | ||||||
|---|---|---|---|---|---|---|---|
| Quadrant | DetID | PixID | Counts | Sigma | Mean | Median | Sigma |
| A | 11 | 47 | 27857 | 84.3 | 1553 | 1521 | 312.4 |
| A | 13 | 254 | 22109 | 65.9 | 1553 | 1521 | 312.4 |
| A | 3 | 137 | 16175 | 46.91 | 1553 | 1521 | 312.4 |
| B | 6 | 159 | 3455446 | 11675.62 | 1523 | 1479 | 295.8 |
| B | 15 | 222 | 124924 | 417.29 | 1523 | 1479 | 295.8 |
| B | 5 | 172 | 107260 | 357.58 | 1523 | 1479 | 295.8 |
| C | 14 | 238 | 280385 | 802.37 | 1474 | 1481 | 347.6 |
| C | 0 | 10 | 176114 | 502.4 | 1474 | 1481 | 347.6 |
| C | 3 | 233 | 169062 | 482.11 | 1474 | 1481 | 347.6 |
| D | 8 | 195 | 743930 | 2072.13 | 1502 | 1459 | 358.3 |
| D | 2 | 250 | 199019 | 551.36 | 1502 | 1459 | 358.3 |
| D | 12 | 233 | 184762 | 511.57 | 1502 | 1459 | 358.3 |
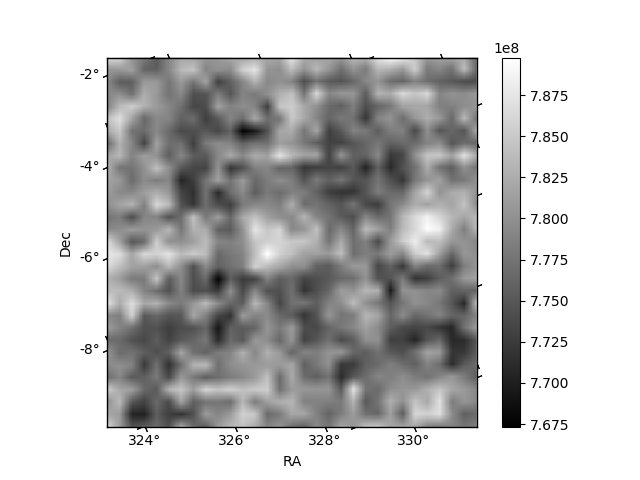
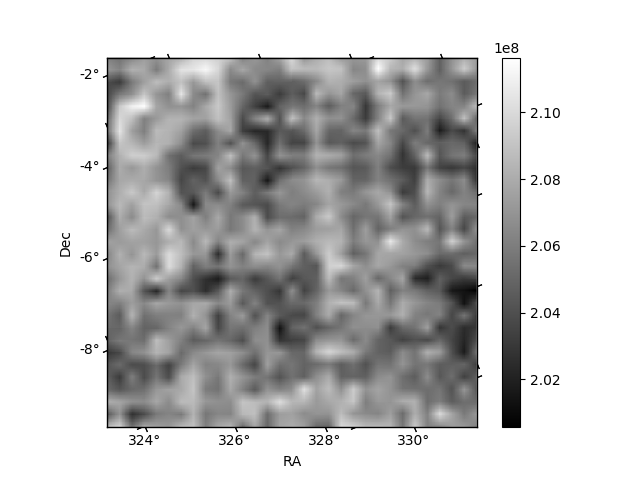
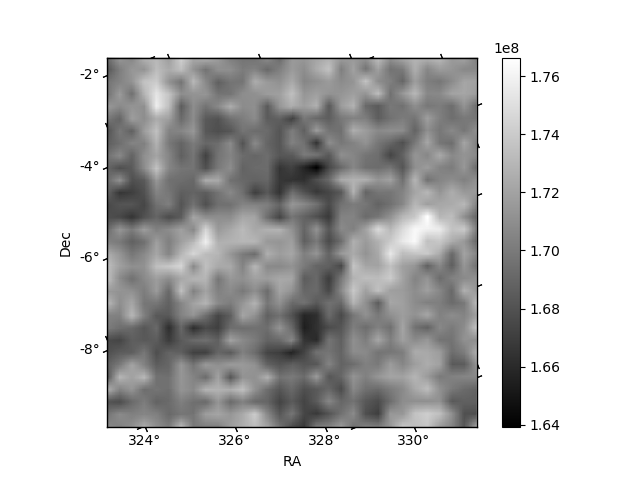
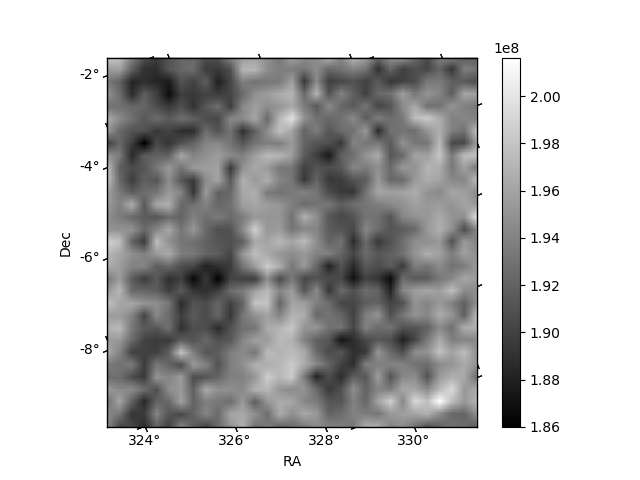
Histogram calculated using DETX and DETY for each event in the final _common_clean file
| Quadrant A | 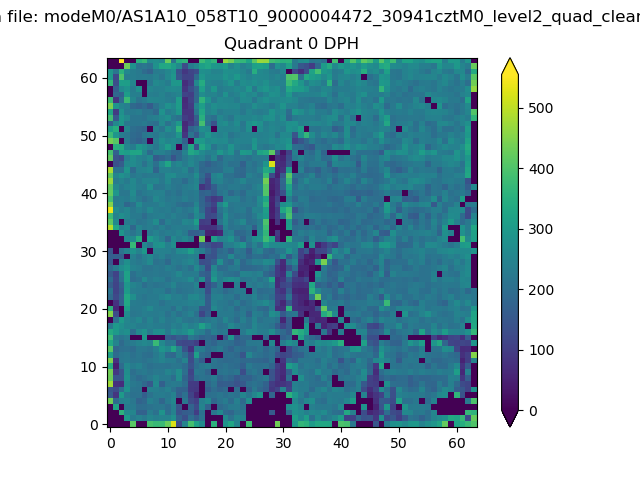 |
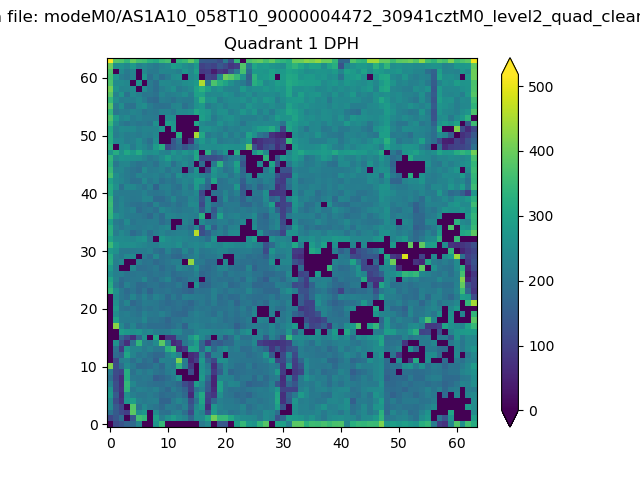 |
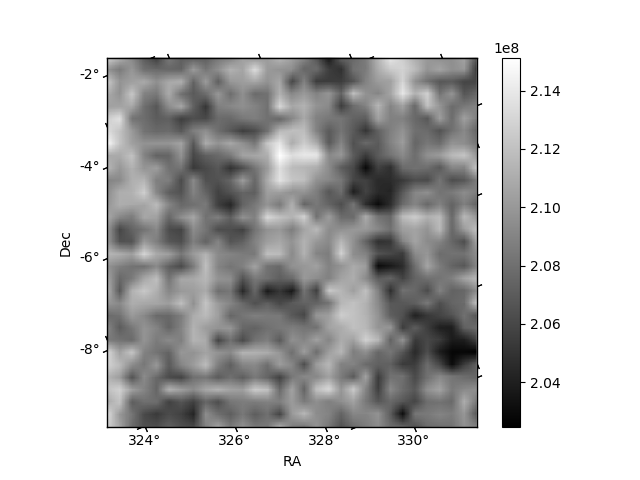
Quadrant B |
|---|---|---|---|
| Quadrant D | 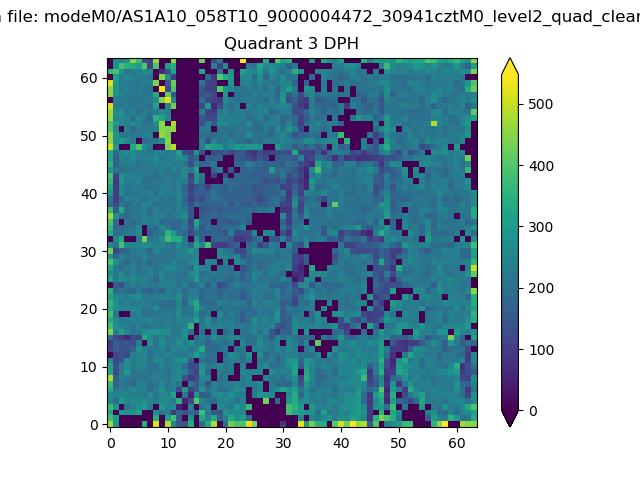 |
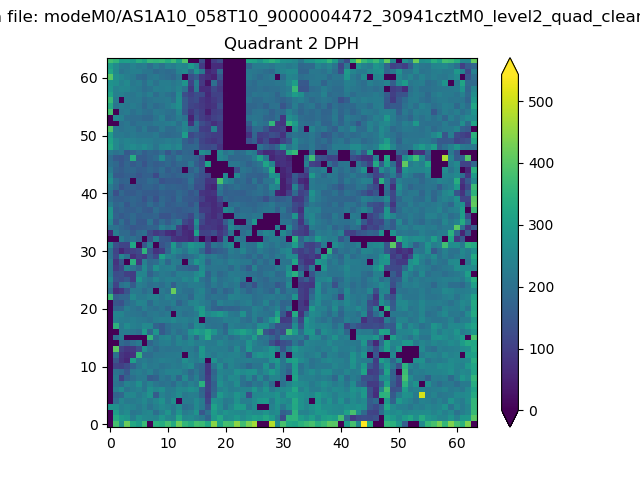 |
Quadrant C |
| Plot type | Count rate plots | Images |
|---|---|---|
| Comparison with Poisson distribution Blue bars denote a histogram of data divided into 1 sec bins. Red curve is a Poisson curve with rate = median count rate of data. |
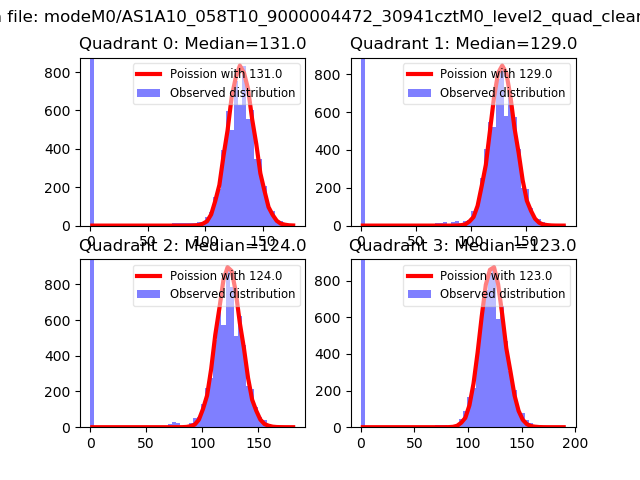 |
 |
| Quadrant-wise count rates Data is divided into 100 sec bins |
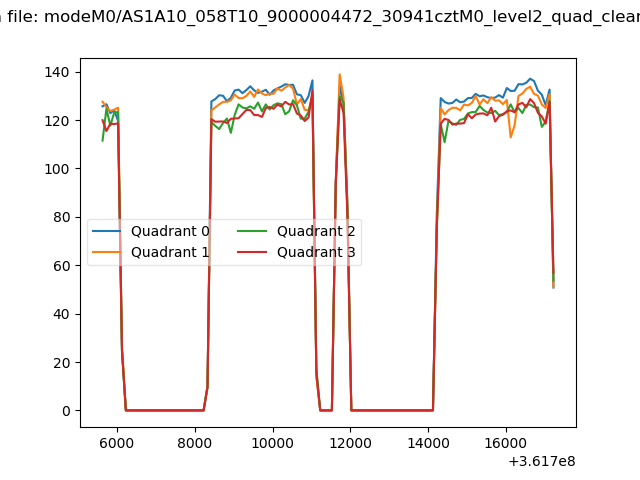 |
|
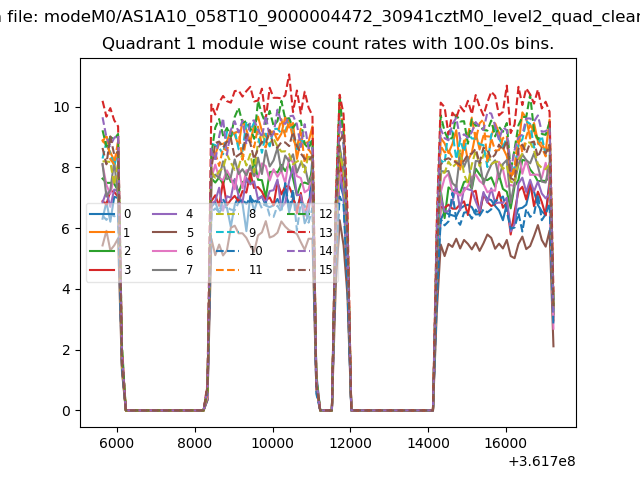
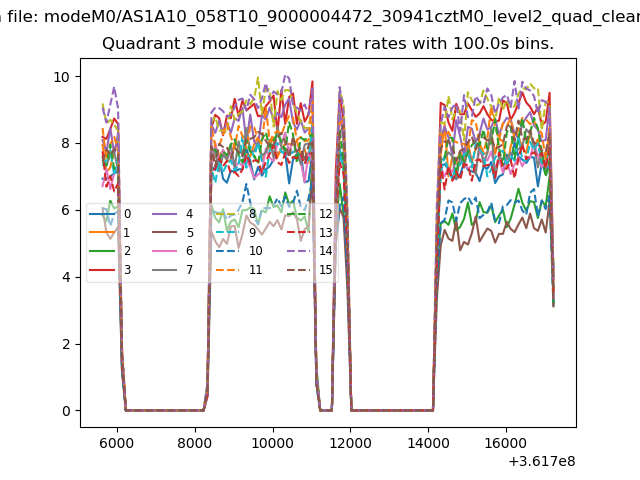
| Module-wise count rates for Quadrant A Data is divided into 100 sec bins |
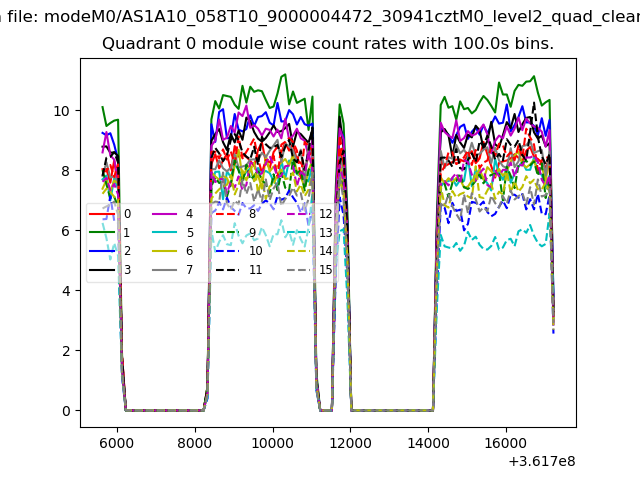 |
 |
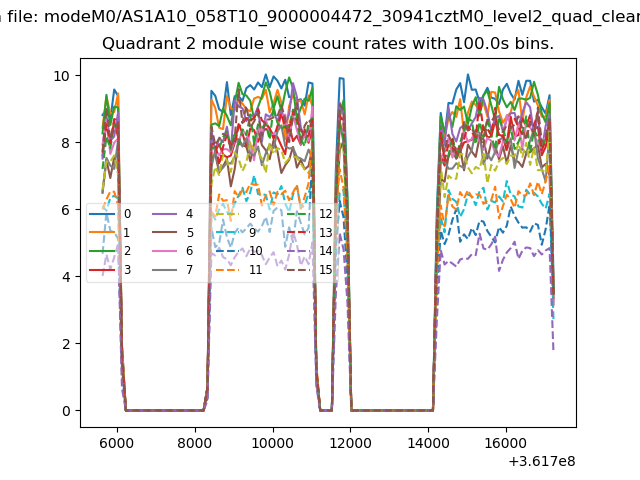
| Module-wise count rates for Quadrant B Data is divided into 100 sec bins |
 |
 |
| Module-wise count rates for Quadrant C Data is divided into 100 sec bins |
 |
 |
| Module-wise count rates for Quadrant D Data is divided into 100 sec bins |
 |
 |
| Parameter | Plot |
|---|---|
| CZT HV Monitor | 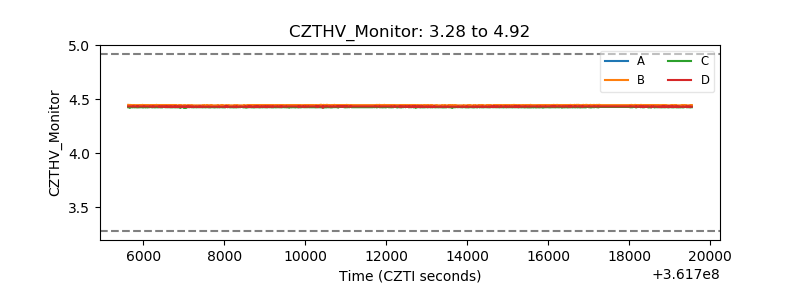 |
| D_VDD | 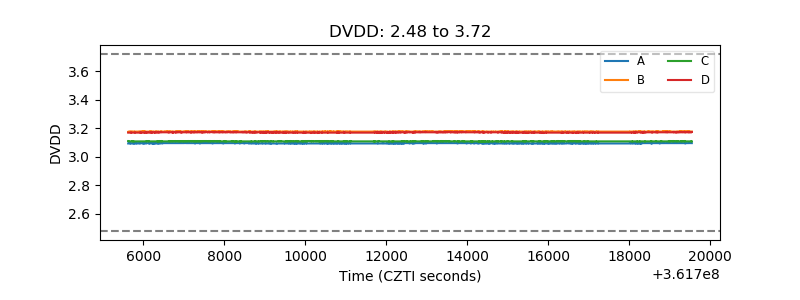 |
| Temperature 1 |  |
| Veto HV Monitor | 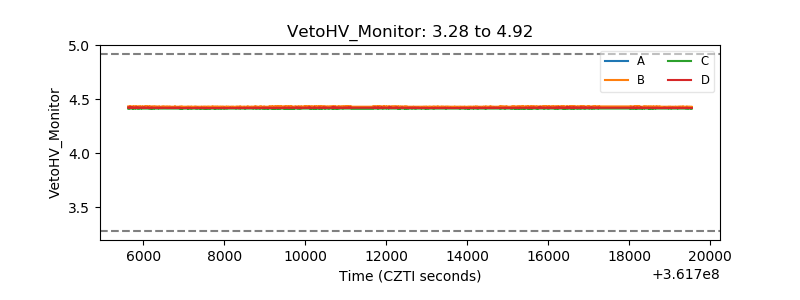 |
| Veto LLD | 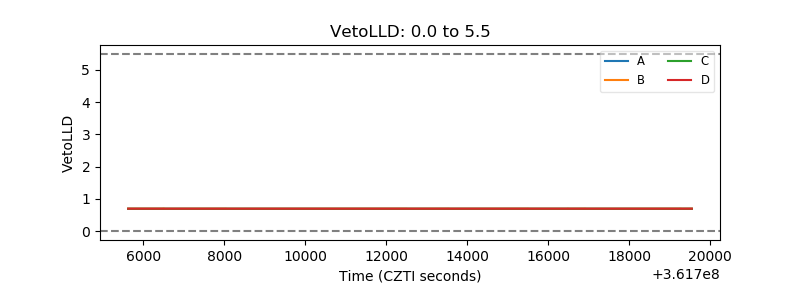 |
| Alpha Counter | 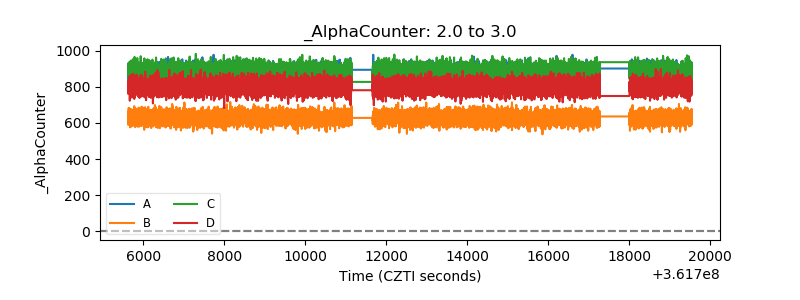 |
| _CPM_Rate | 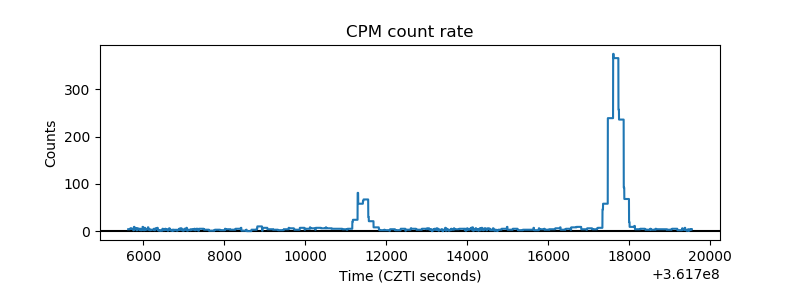 |
| CZT Counter | 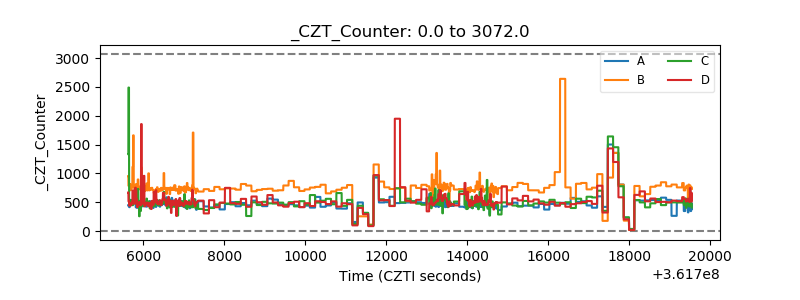 |
| +2.5 Volts monitor |  |
| +5 Volts monitor |  |
| _ROLL_ROT | 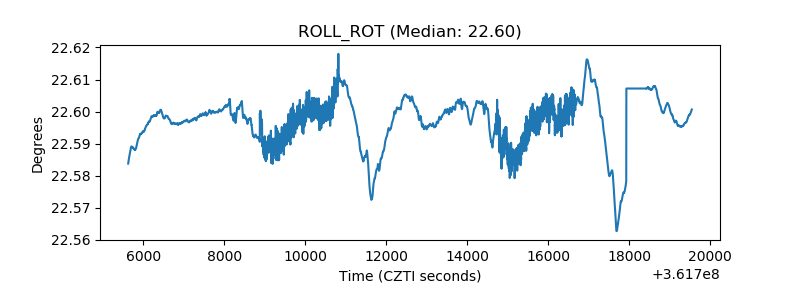 |
| _Roll_DEC | 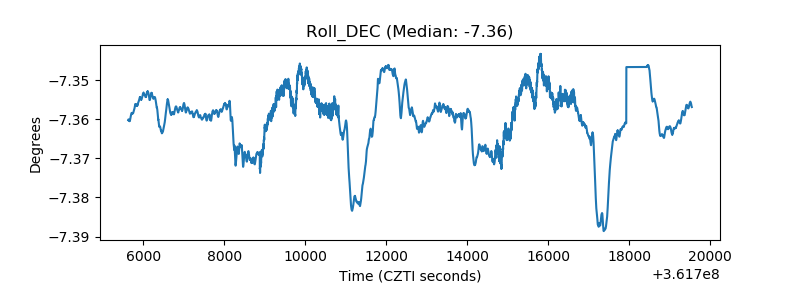 |
| _Roll_RA |  |
| Veto Counter | 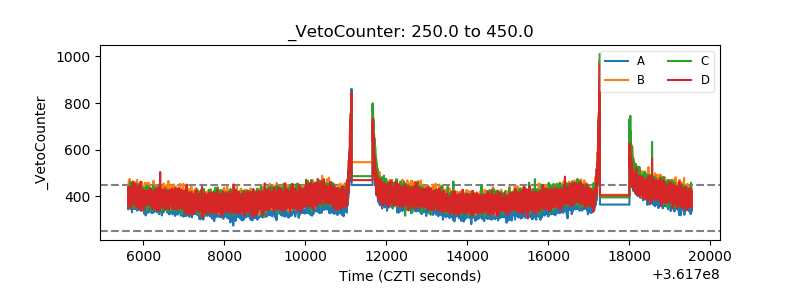 |