| Param | Original file | Final file |
|---|---|---|
| Filename | modeM0/AS1A10_058T10_9000004472_30943cztM0_level2.evt | modeM0/AS1A10_058T10_9000004472_30943cztM0_level2_quad_clean.evt |
| Size (bytes) | 543,530,880 | 77,587,200 |
| Size | 518.4 MB | 74.0 MB |
| Events in quadrant A | 3,255,600 | 490,777 |
| Events in quadrant B | 5,477,552 | 480,990 |
| Events in quadrant C | 3,557,749 | 459,265 |
| Events in quadrant D | 3,728,878 | 464,239 |
| Mode M0 | |||
|---|---|---|---|
| Quadrant | BADHDUFLAG | Total packets | Discarded packets |
| A | 0 | 13809 | 2 |
| B | 0 | 20745 | 2 |
| C | 0 | 14592 | 2 |
| D | 0 | 15454 | 2 |
| Mode M9 | |||
|---|---|---|---|
| Quadrant | BADHDUFLAG | Total packets | Discarded packets |
| A | 0 | 18 | 0 |
| B | 0 | 19 | 0 |
| C | 0 | 19 | 0 |
| D | 0 | 19 | 0 |
| Mode SS | |||
|---|---|---|---|
| Quadrant | BADHDUFLAG | Total packets | Discarded packets |
| A | 0 | 132 | 0 |
| B | 0 | 132 | 0 |
| C | 0 | 132 | 0 |
| D | 0 | 132 | 0 |
| Quadrant | Total seconds | Saturated seconds | Saturation percentage |
|---|---|---|---|
| A | 6511 | 26 | 0.399324% |
| B | 6511 | 187 | 2.872063% |
| C | 6511 | 450 | 6.911381% |
| D | 6511 | 75 | 1.151897% |
Noise dominated data is calculated using 1-second bins in cleaned event files. If a bin has >2000 counts, and if more than 50% of those come from <1% of pixels, then it is considered to be noise-dominated and hence unusable.
| Quadrant | # 1 sec bins | Bins with >0 counts | Bins with >2000 counts | High rate bins dominated by noise | Noise dominated (total time) | Noise dominated (detector-on time) | Marked lightcurve |
|---|---|---|---|---|---|---|---|
| A | 7601 | 6511 | 1 | 1 | 0.01% | 0.02% | 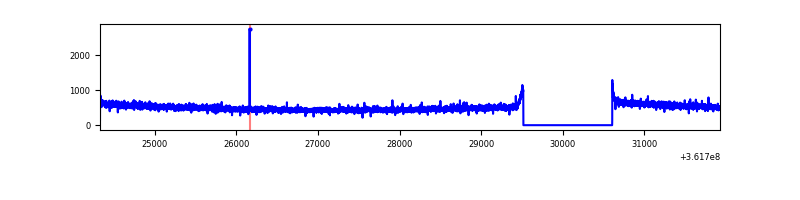 |
| B | 7601 | 6511 | 52 | 52 | 0.68% | 0.80% | 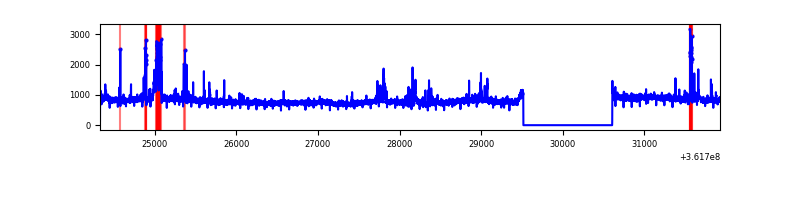 |
| C | 7601 | 6511 | 20 | 20 | 0.26% | 0.31% | 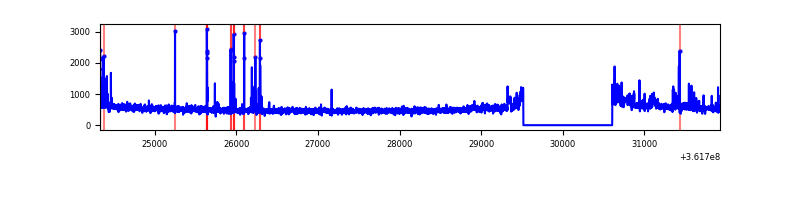 |
| D | 7601 | 6511 | 56 | 56 | 0.74% | 0.86% | 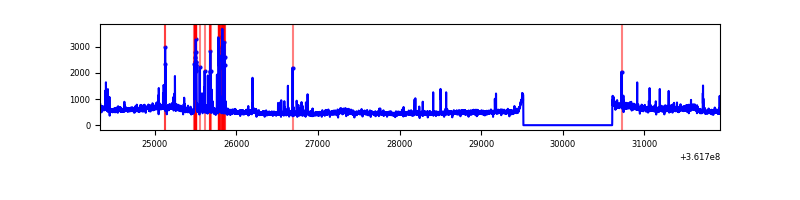 |
Top three noisy pixels from each quadrant. If the there are fewer than three noisy pixels in the level2.evt file, extra rows are filled as -1
| Pixel properties | Quadrant properties | ||||||
|---|---|---|---|---|---|---|---|
| Quadrant | DetID | PixID | Counts | Sigma | Mean | Median | Sigma |
| A | 13 | 254 | 12750 | 70.94 | 839 | 825 | 168.1 |
| A | 3 | 137 | 8254 | 44.19 | 839 | 825 | 168.1 |
| A | 0 | 226 | 7193 | 37.88 | 839 | 825 | 168.1 |
| B | 6 | 159 | 1837649 | 11599.22 | 826 | 806 | 158.4 |
| B | 5 | 172 | 209079 | 1315.19 | 826 | 806 | 158.4 |
| B | 0 | 190 | 64817 | 404.21 | 826 | 806 | 158.4 |
| C | 14 | 238 | 222339 | 1225.98 | 775 | 781 | 180.7 |
| C | 14 | 254 | 135781 | 747.01 | 775 | 781 | 180.7 |
| C | 0 | 10 | 121180 | 666.22 | 775 | 781 | 180.7 |
| D | 8 | 195 | 413747 | 2165.68 | 812 | 793 | 190.7 |
| D | 12 | 233 | 117935 | 614.34 | 812 | 793 | 190.7 |
| D | 2 | 153 | 81031 | 420.8 | 812 | 793 | 190.7 |
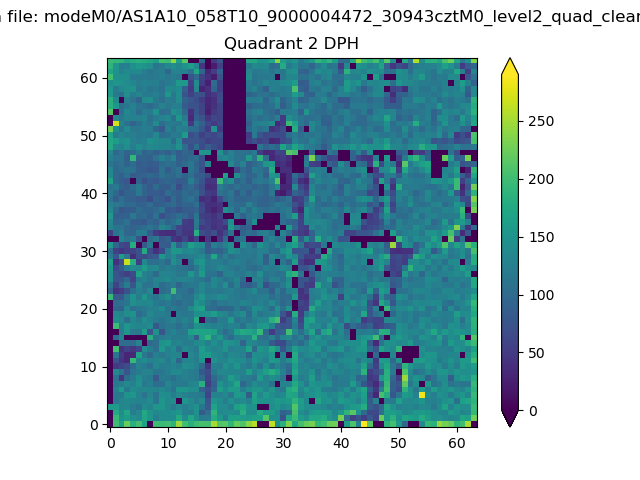
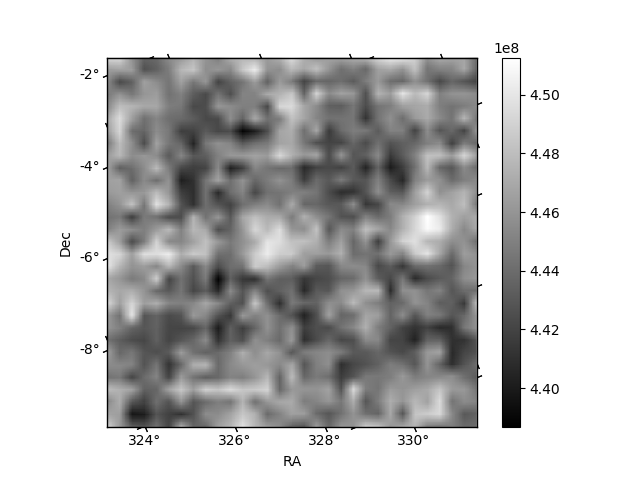
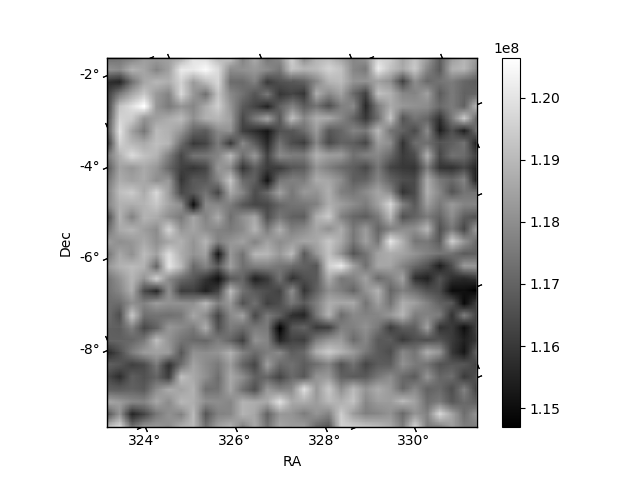
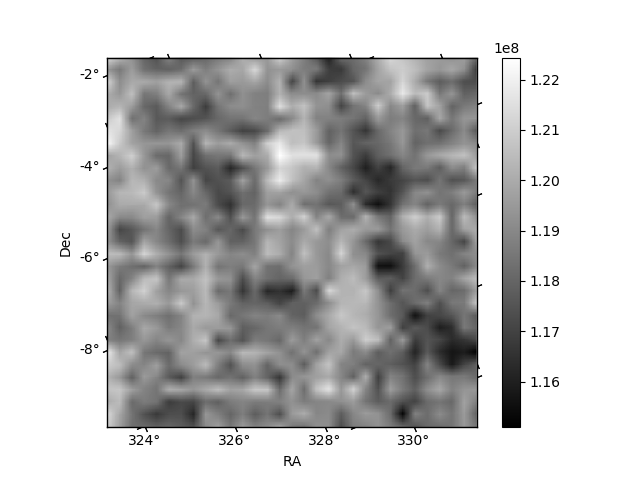
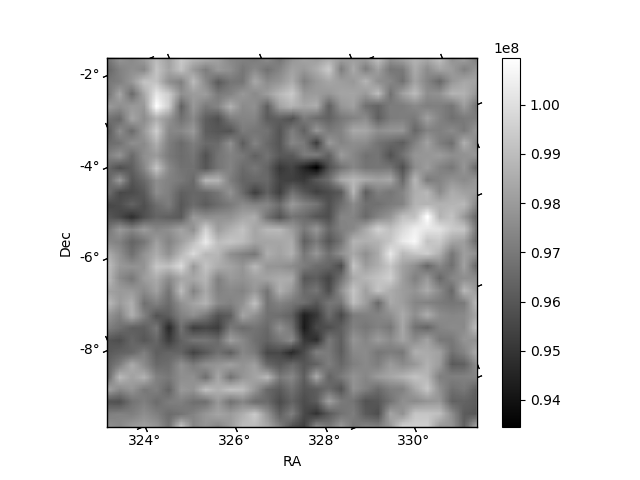
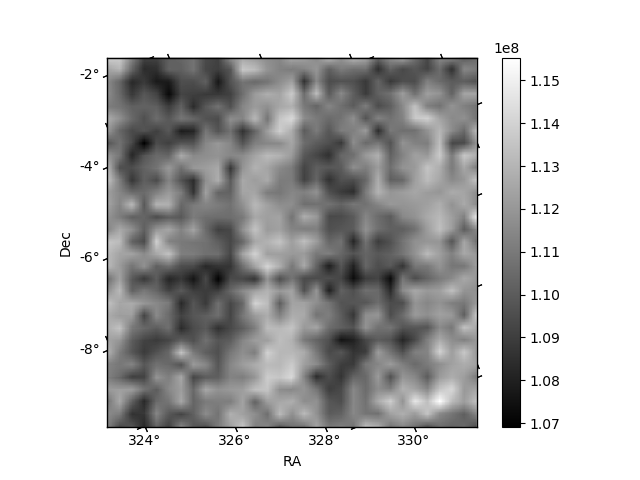
Histogram calculated using DETX and DETY for each event in the final _common_clean file
| Quadrant A | 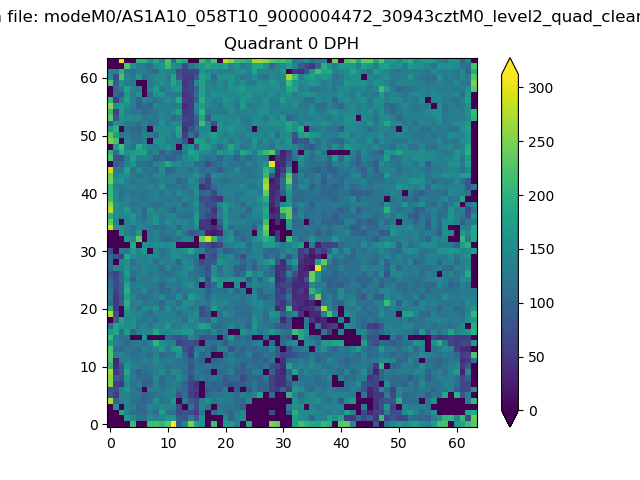 |
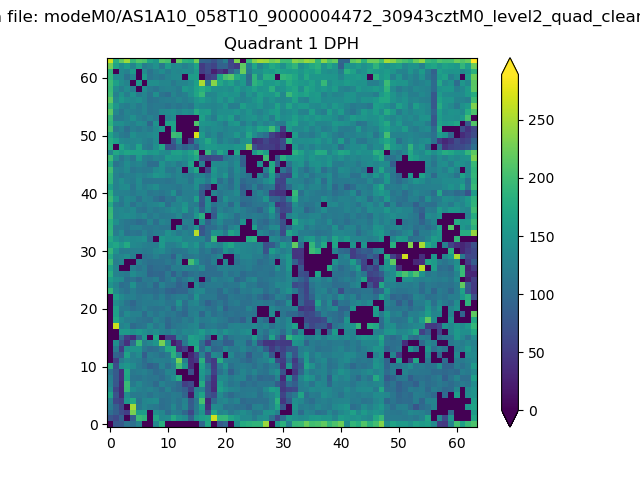 |
Quadrant B |
|---|---|---|---|
| Quadrant D | 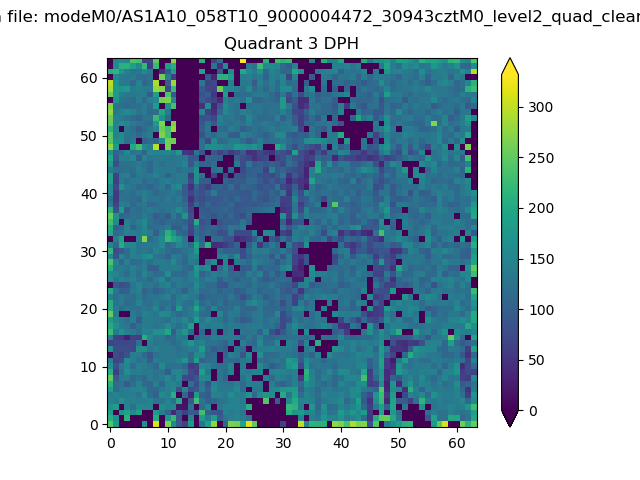 |
 |
Quadrant C |
| Plot type | Count rate plots | Images |
|---|---|---|
| Comparison with Poisson distribution Blue bars denote a histogram of data divided into 1 sec bins. Red curve is a Poisson curve with rate = median count rate of data. |
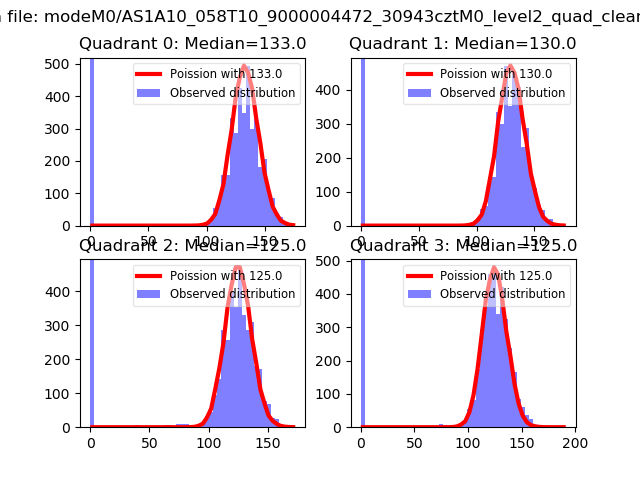 |
 |
| Quadrant-wise count rates Data is divided into 100 sec bins |
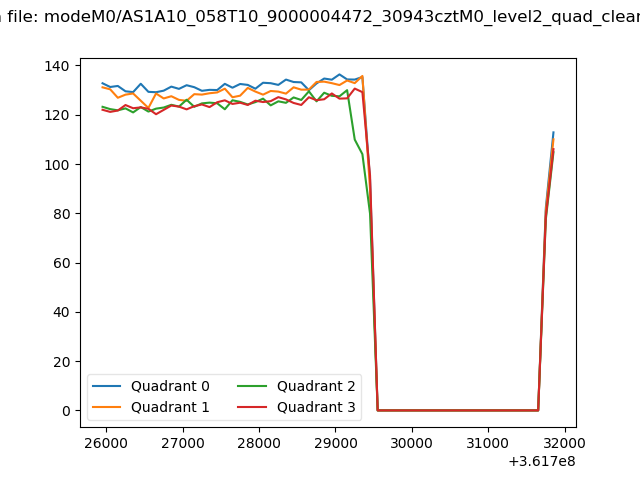 |
|
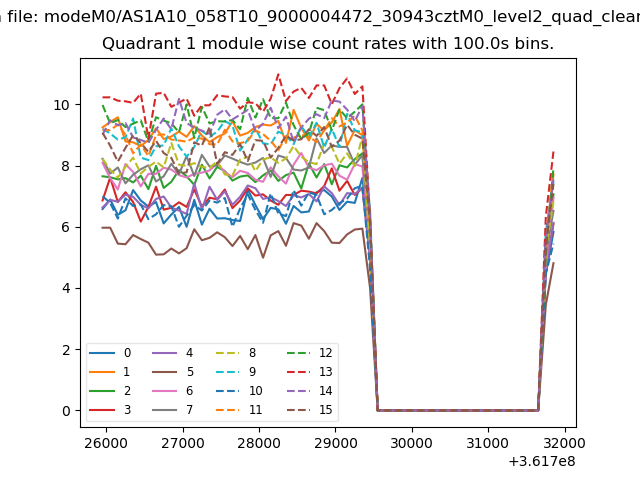
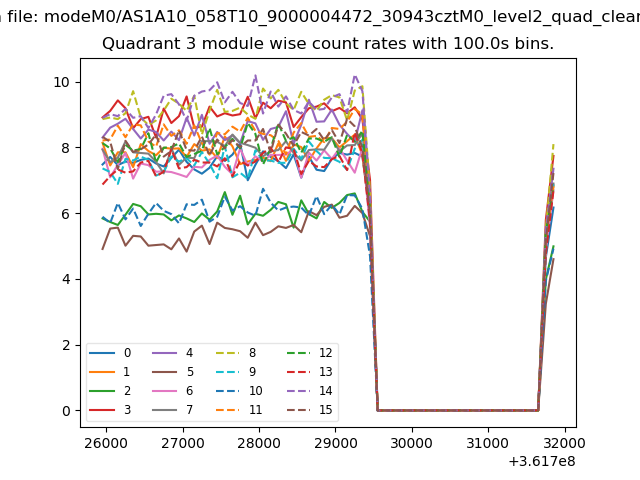
| Module-wise count rates for Quadrant A Data is divided into 100 sec bins |
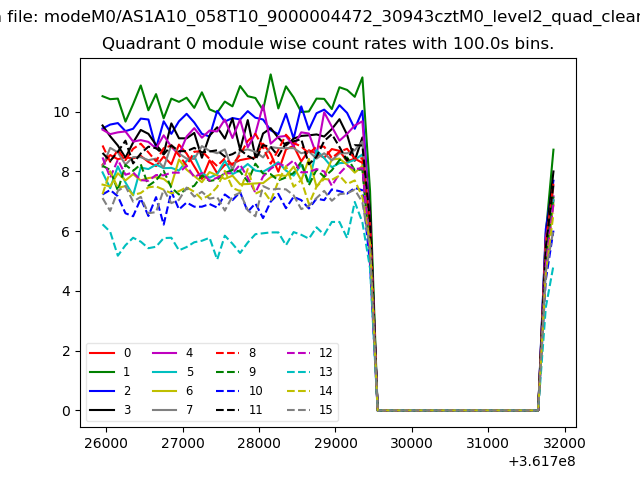 |
 |
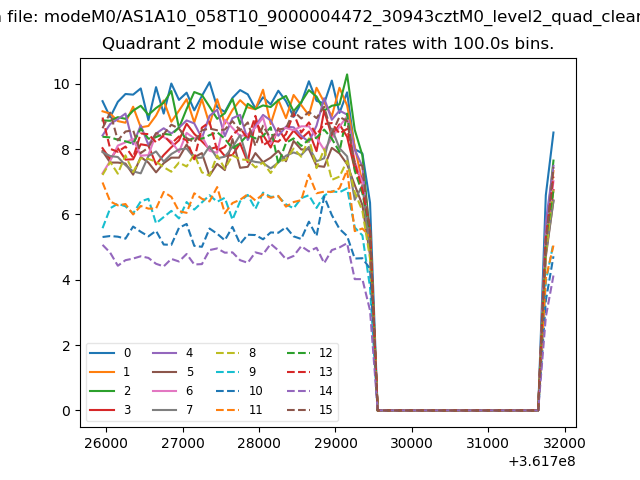
| Module-wise count rates for Quadrant B Data is divided into 100 sec bins |
 |
 |
| Module-wise count rates for Quadrant C Data is divided into 100 sec bins |
 |
 |
| Module-wise count rates for Quadrant D Data is divided into 100 sec bins |
 |
 |
| Parameter | Plot |
|---|---|
| CZT HV Monitor |  |
| D_VDD | 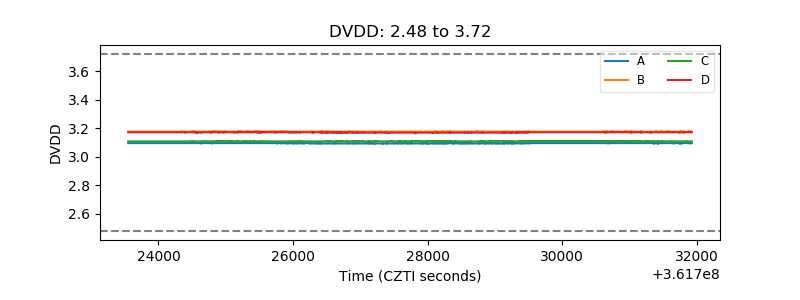 |
| Temperature 1 | 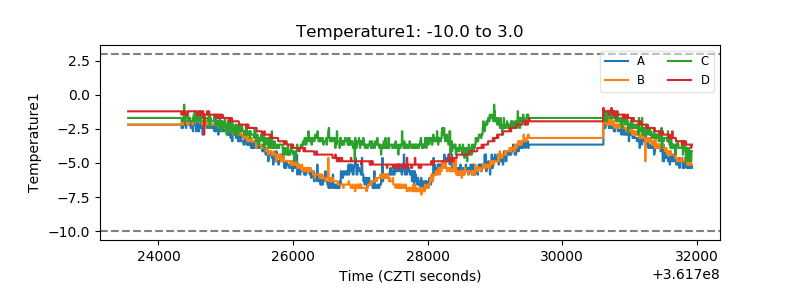 |
| Veto HV Monitor | 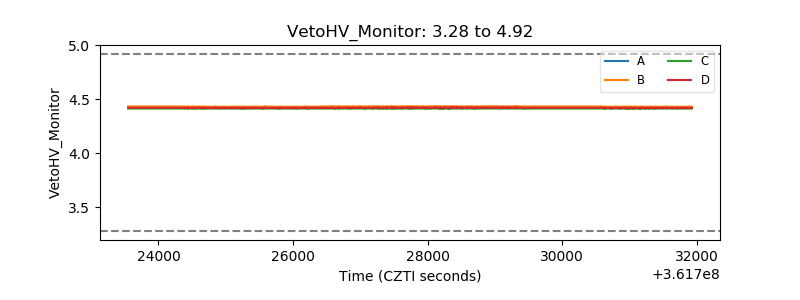 |
| Veto LLD | 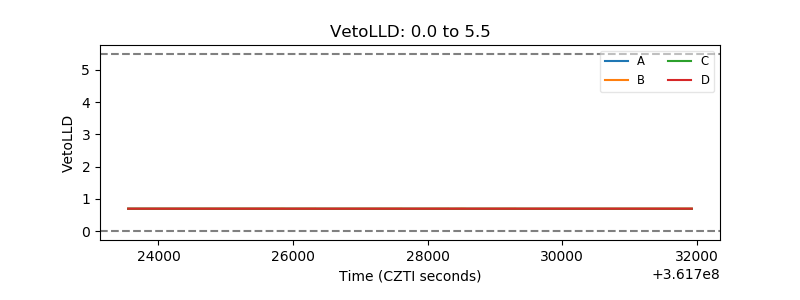 |
| Alpha Counter | 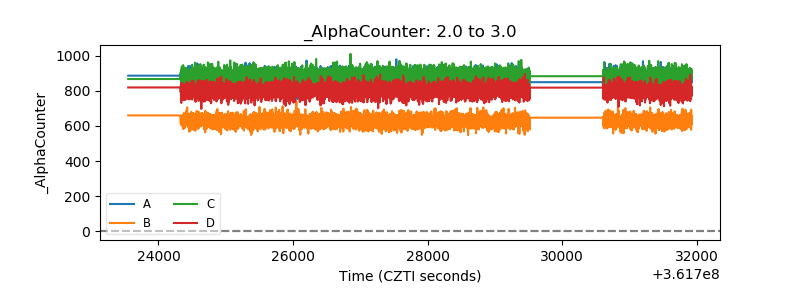 |
| _CPM_Rate | 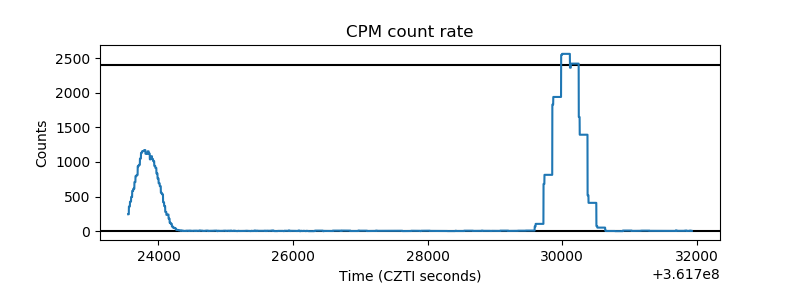 |
| CZT Counter | 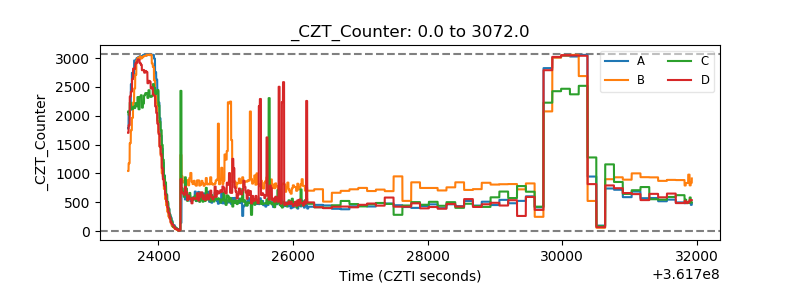 |
| +2.5 Volts monitor |  |
| +5 Volts monitor | 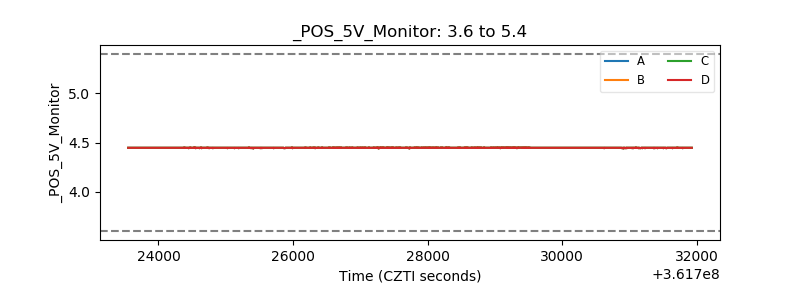 |
| _ROLL_ROT | 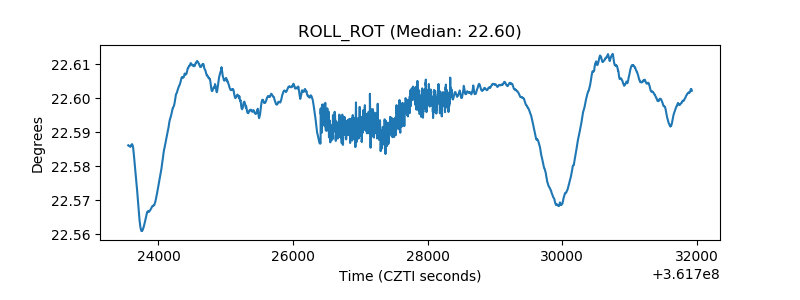 |
| _Roll_DEC | 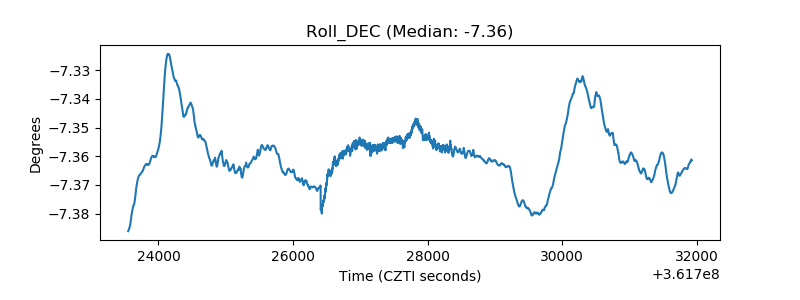 |
| _Roll_RA | 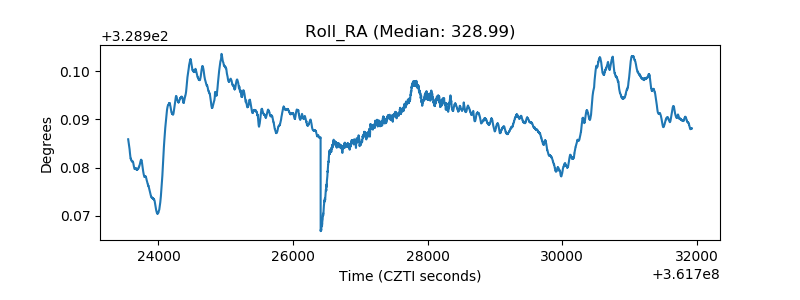 |
| Veto Counter | 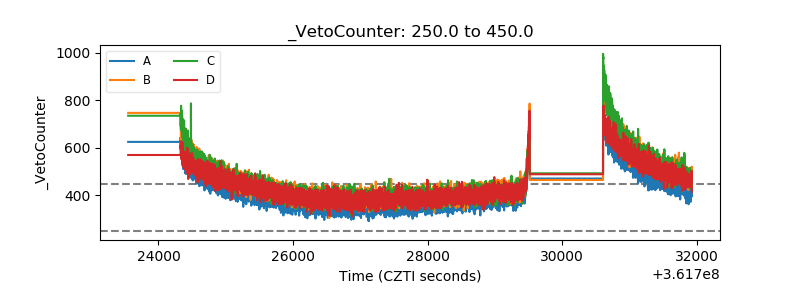 |