| Param | Original file | Final file |
|---|---|---|
| Filename | modeM0/AS1A10_058T10_9000004472_30946cztM0_level2.evt | modeM0/AS1A10_058T10_9000004472_30946cztM0_level2_quad_clean.evt |
| Size (bytes) | 652,055,040 | 103,052,160 |
| Size | 621.8 MB | 98.3 MB |
| Events in quadrant A | 3,392,924 | 695,534 |
| Events in quadrant B | 5,351,222 | 700,759 |
| Events in quadrant C | 3,701,044 | 679,045 |
| Events in quadrant D | 6,876,994 | 606,247 |
| Mode M0 | |||
|---|---|---|---|
| Quadrant | BADHDUFLAG | Total packets | Discarded packets |
| A | 0 | 14115 | 2 |
| B | 0 | 19947 | 2 |
| C | 0 | 15098 | 3 |
| D | 0 | 24657 | 2 |
| Mode M9 | |||
|---|---|---|---|
| Quadrant | BADHDUFLAG | Total packets | Discarded packets |
| A | 0 | 22 | 0 |
| B | 0 | 23 | 0 |
| C | 0 | 23 | 0 |
| D | 0 | 23 | 0 |
| Mode SS | |||
|---|---|---|---|
| Quadrant | BADHDUFLAG | Total packets | Discarded packets |
| A | 0 | 126 | 0 |
| B | 0 | 126 | 0 |
| C | 0 | 126 | 0 |
| D | 0 | 126 | 0 |
| Quadrant | Total seconds | Saturated seconds | Saturation percentage |
|---|---|---|---|
| A | 6299 | 54 | 0.857279% |
| B | 6299 | 138 | 2.190824% |
| C | 6298 | 210 | 3.334392% |
| D | 6298 | 1407 | 22.340426% |
Noise dominated data is calculated using 1-second bins in cleaned event files. If a bin has >2000 counts, and if more than 50% of those come from <1% of pixels, then it is considered to be noise-dominated and hence unusable.
| Quadrant | # 1 sec bins | Bins with >0 counts | Bins with >2000 counts | High rate bins dominated by noise | Noise dominated (total time) | Noise dominated (detector-on time) | Marked lightcurve |
|---|---|---|---|---|---|---|---|
| A | 7584 | 6299 | 1 | 1 | 0.01% | 0.02% | 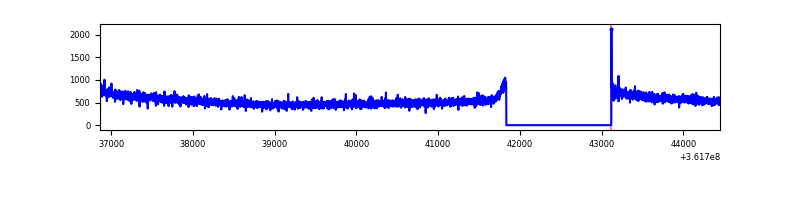 |
| B | 7584 | 6299 | 3 | 3 | 0.04% | 0.05% | 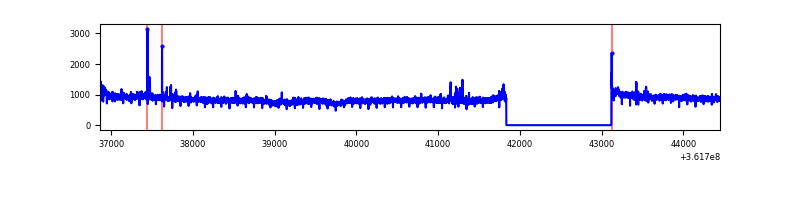 |
| C | 7583 | 6298 | 31 | 31 | 0.41% | 0.49% | 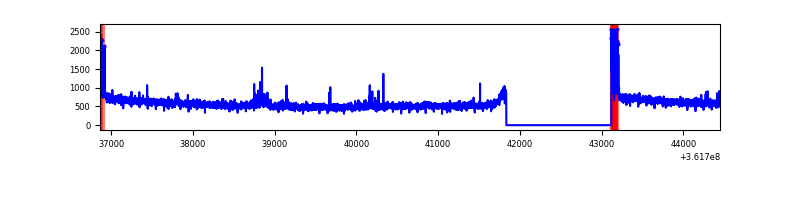 |
| D | 7582 | 6297 | 1099 | 1099 | 14.49% | 17.45% | 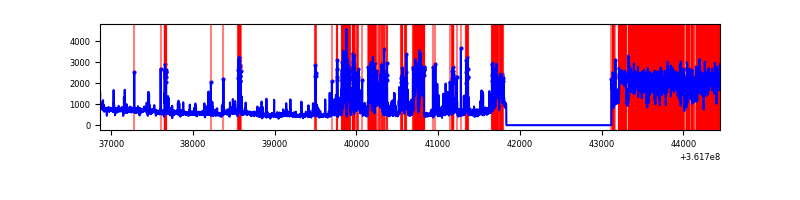 |
Top three noisy pixels from each quadrant. If the there are fewer than three noisy pixels in the level2.evt file, extra rows are filled as -1
| Pixel properties | Quadrant properties | ||||||
|---|---|---|---|---|---|---|---|
| Quadrant | DetID | PixID | Counts | Sigma | Mean | Median | Sigma |
| A | 11 | 47 | 11713 | 62.56 | 875 | 860 | 173.5 |
| A | 13 | 254 | 11549 | 61.62 | 875 | 860 | 173.5 |
| A | 3 | 137 | 8196 | 42.29 | 875 | 860 | 173.5 |
| B | 6 | 159 | 1819625 | 11238.48 | 871 | 853 | 161.8 |
| B | 0 | 190 | 40596 | 245.58 | 871 | 853 | 161.8 |
| B | 0 | 183 | 31048 | 186.58 | 871 | 853 | 161.8 |
| C | 14 | 238 | 158268 | 799.48 | 851 | 861 | 196.9 |
| C | 0 | 10 | 155599 | 785.92 | 851 | 861 | 196.9 |
| C | 14 | 254 | 33723 | 166.91 | 851 | 861 | 196.9 |
| D | 13 | 174 | 1896989 | 10213.44 | 799 | 784 | 185.7 |
| D | 15 | 47 | 1328487 | 7151.34 | 799 | 784 | 185.7 |
| D | 2 | 250 | 287467 | 1544.15 | 799 | 784 | 185.7 |
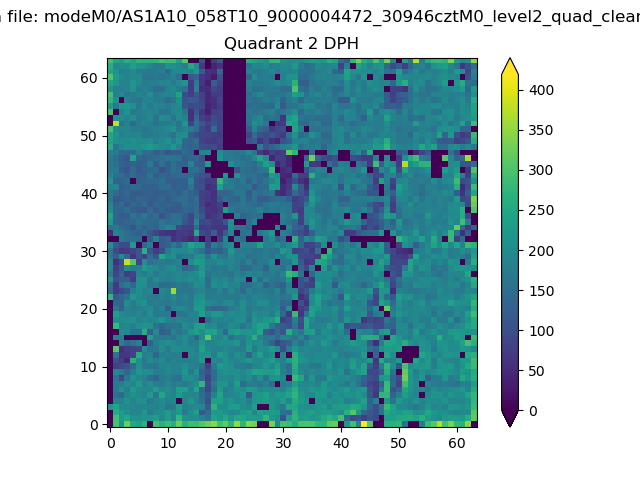
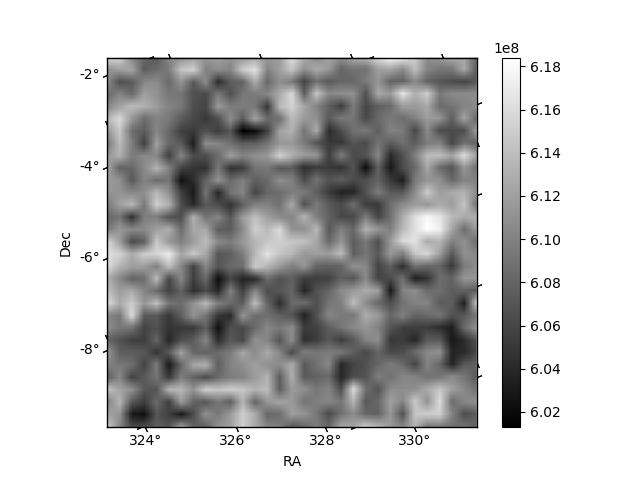
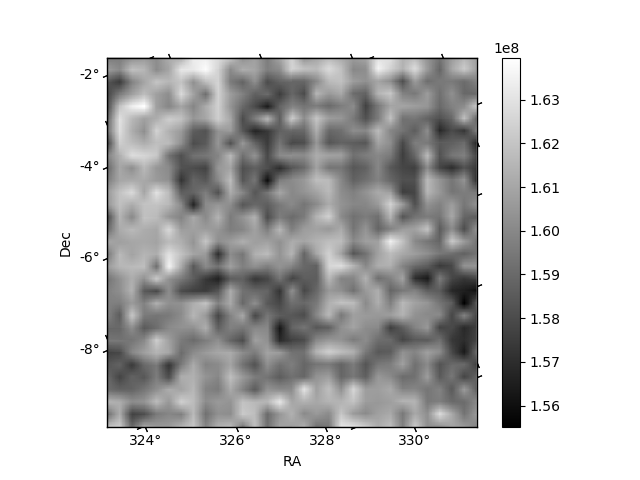
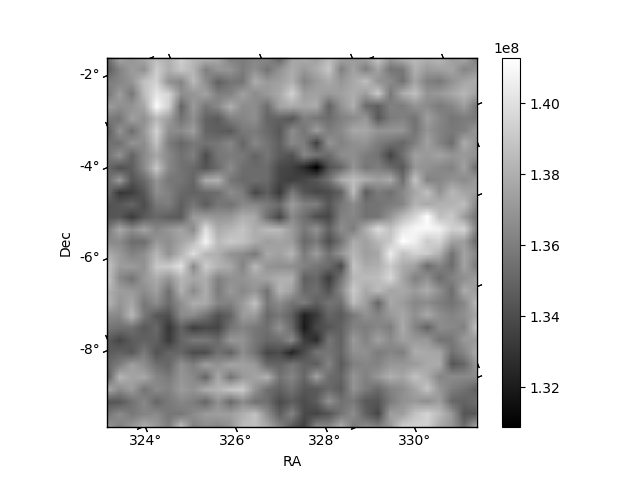
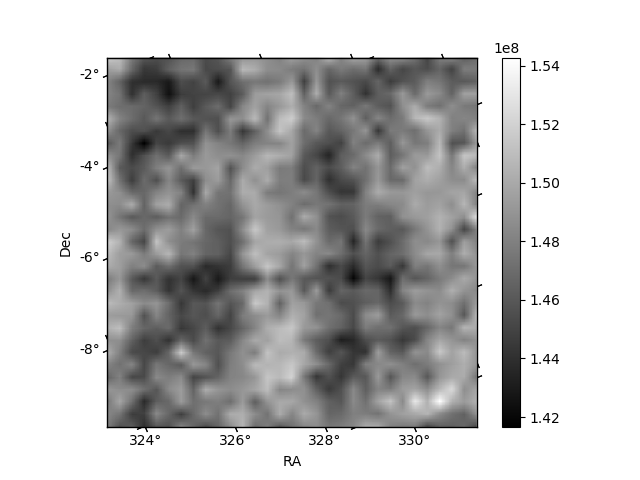
Histogram calculated using DETX and DETY for each event in the final _common_clean file
| Quadrant A | 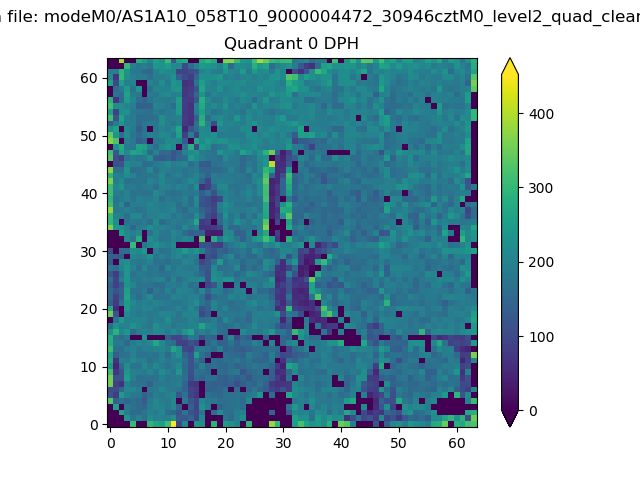 |
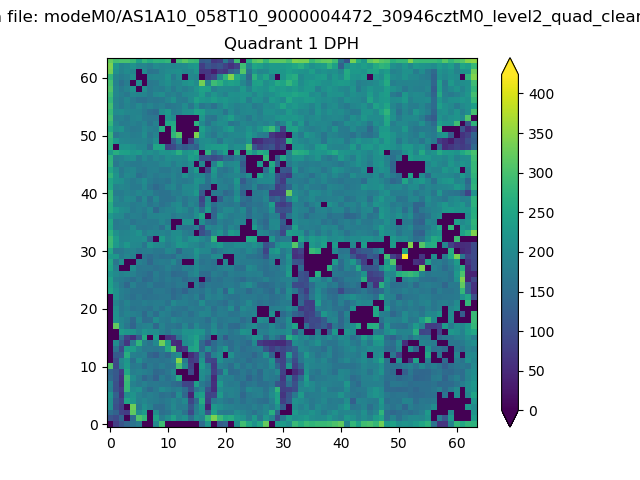 |
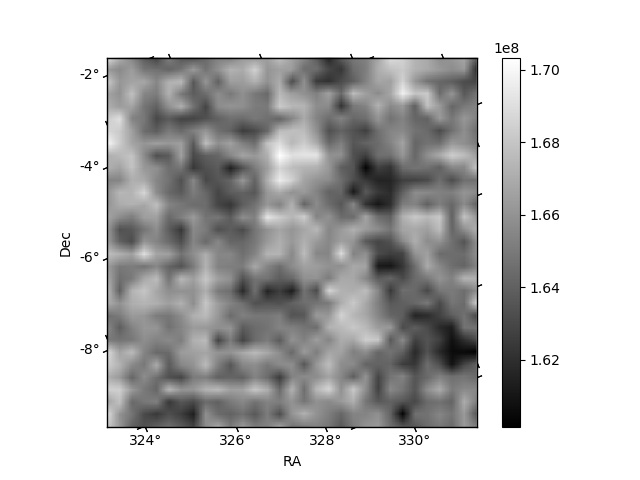
Quadrant B |
|---|---|---|---|
| Quadrant D | 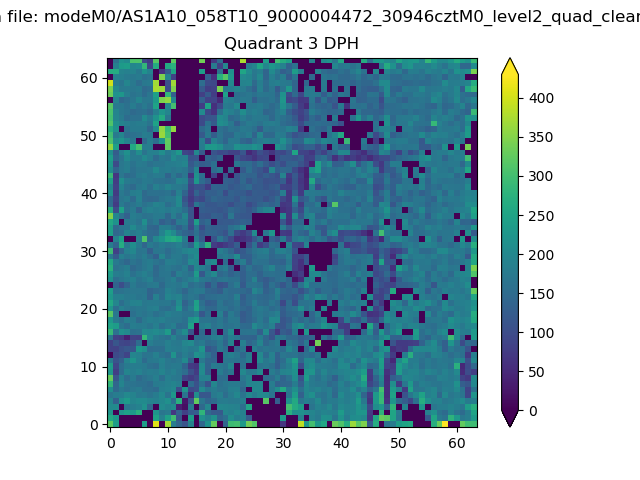 |
 |
Quadrant C |
| Plot type | Count rate plots | Images |
|---|---|---|
| Comparison with Poisson distribution Blue bars denote a histogram of data divided into 1 sec bins. Red curve is a Poisson curve with rate = median count rate of data. |
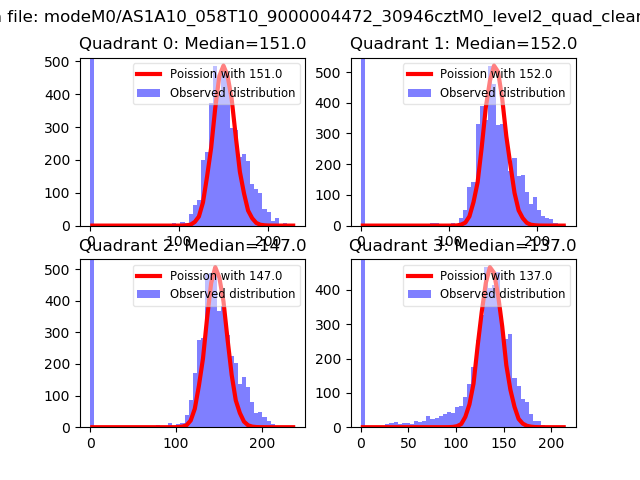 |
 |
| Quadrant-wise count rates Data is divided into 100 sec bins |
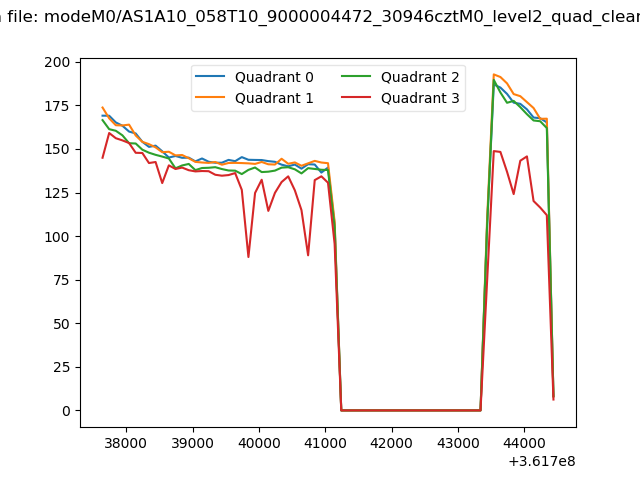 |
|
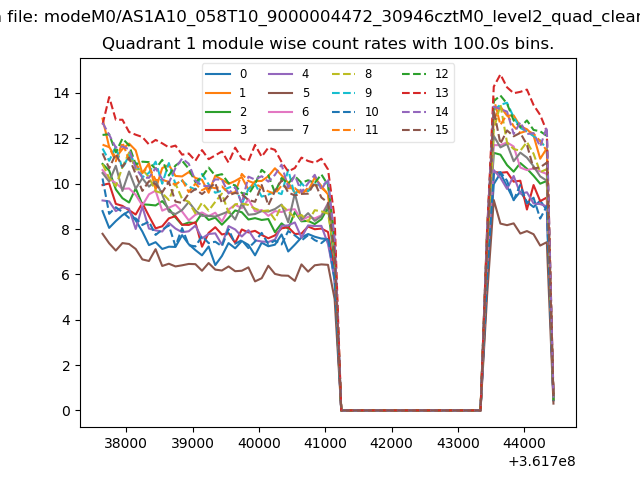
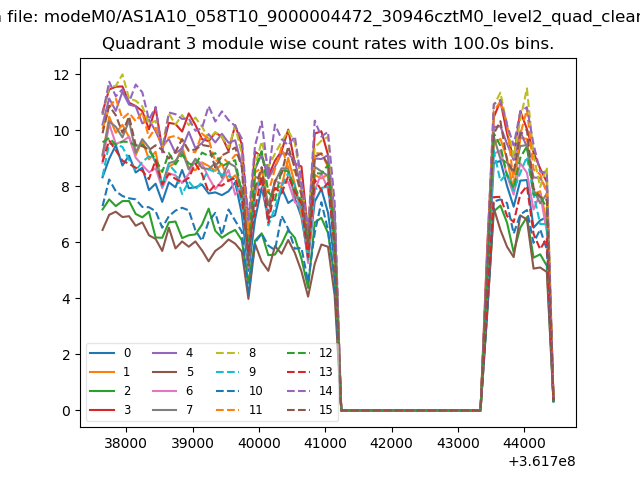
| Module-wise count rates for Quadrant A Data is divided into 100 sec bins |
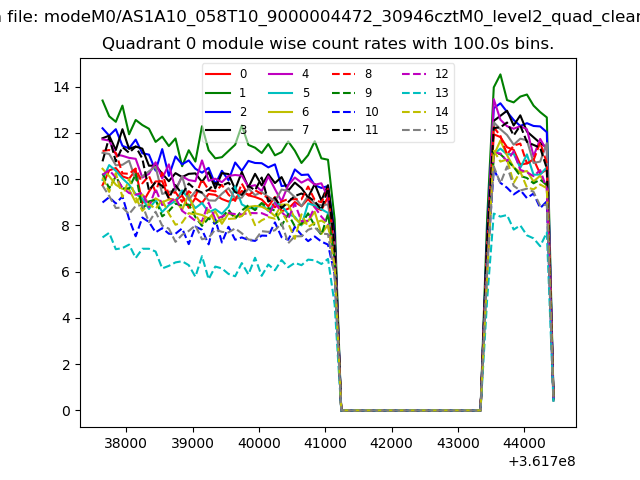 |
 |
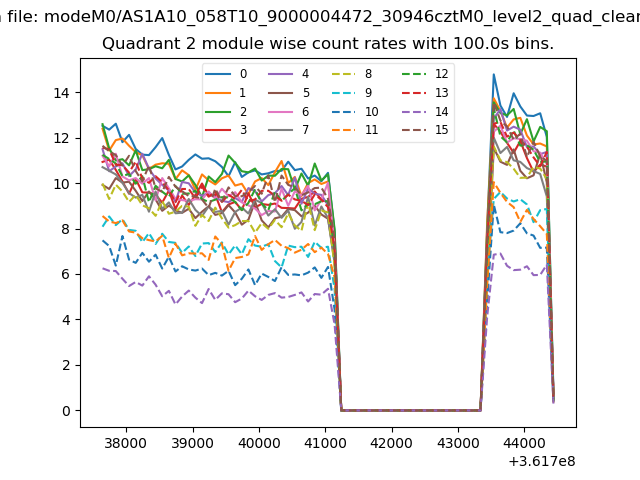
| Module-wise count rates for Quadrant B Data is divided into 100 sec bins |
 |
 |
| Module-wise count rates for Quadrant C Data is divided into 100 sec bins |
 |
 |
| Module-wise count rates for Quadrant D Data is divided into 100 sec bins |
 |
 |
| Parameter | Plot |
|---|---|
| CZT HV Monitor |  |
| D_VDD | 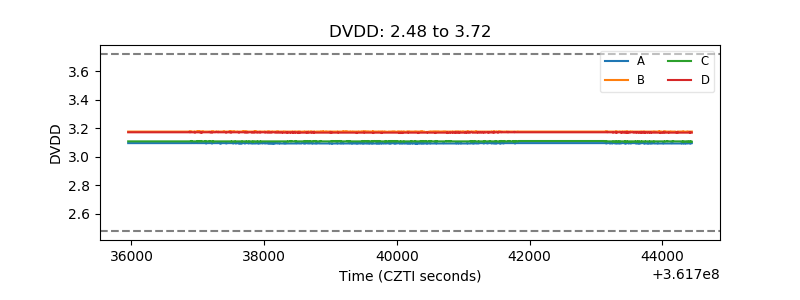 |
| Temperature 1 | 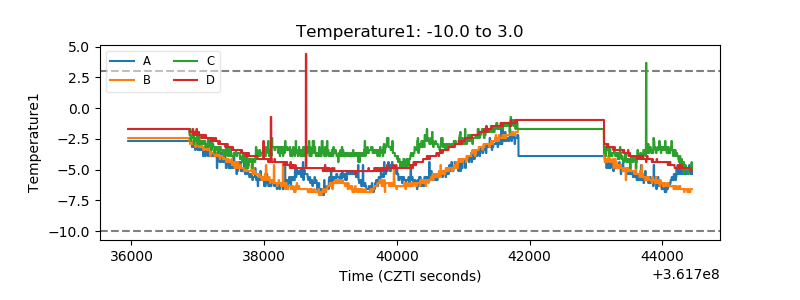 |
| Veto HV Monitor | 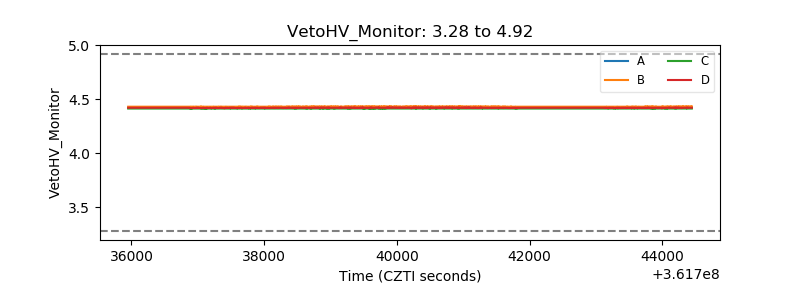 |
| Veto LLD | 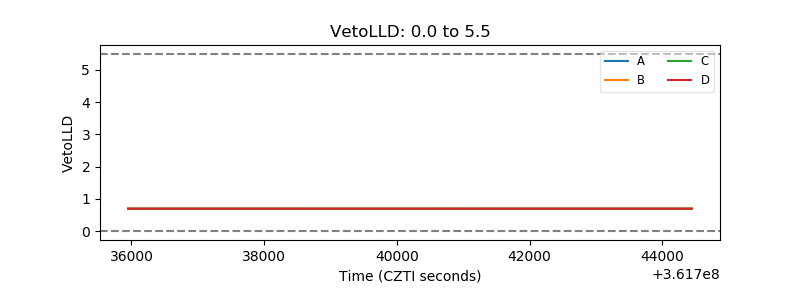 |
| Alpha Counter | 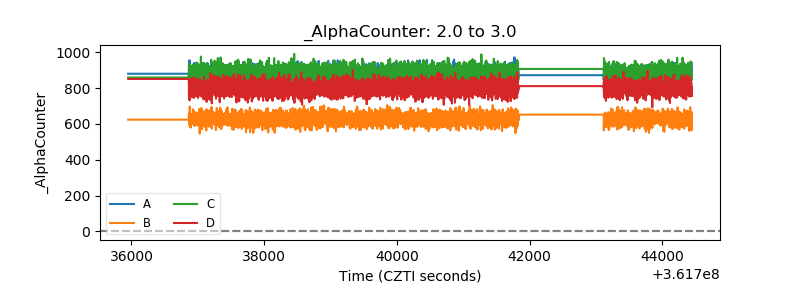 |
| _CPM_Rate | 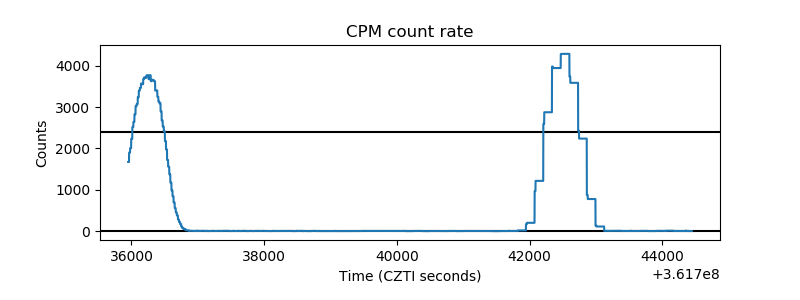 |
| CZT Counter | 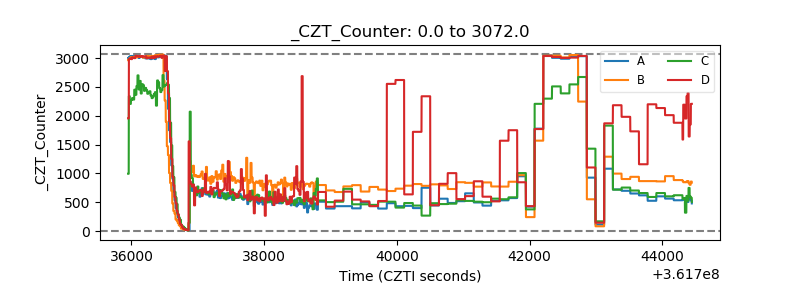 |
| +2.5 Volts monitor |  |
| +5 Volts monitor |  |
| _ROLL_ROT | 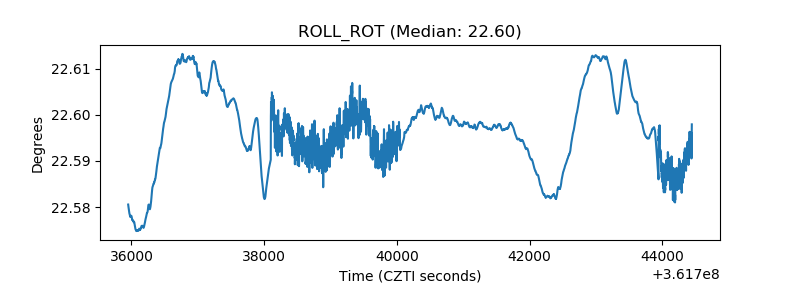 |
| _Roll_DEC | 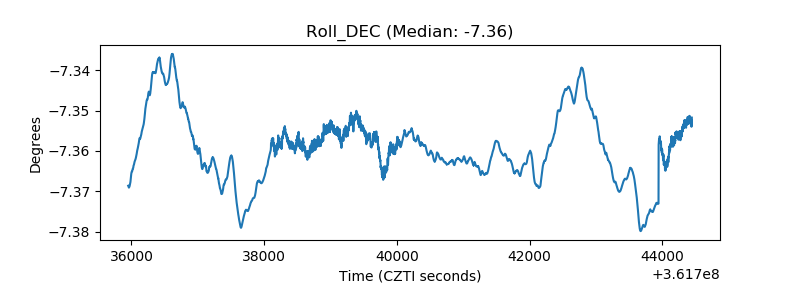 |
| _Roll_RA | 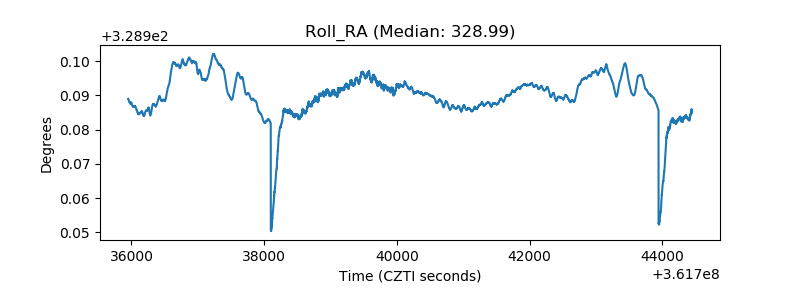 |
| Veto Counter |  |