| Param | Original file | Final file |
|---|---|---|
| Filename | modeM0/AS1A10_058T10_9000004472_30947cztM0_level2.evt | modeM0/AS1A10_058T10_9000004472_30947cztM0_level2_quad_clean.evt |
| Size (bytes) | 651,988,800 | 115,853,760 |
| Size | 621.8 MB | 110.5 MB |
| Events in quadrant A | 3,381,603 | 789,914 |
| Events in quadrant B | 5,309,326 | 803,060 |
| Events in quadrant C | 3,694,163 | 778,976 |
| Events in quadrant D | 6,941,339 | 703,734 |
| Mode M0 | |||
|---|---|---|---|
| Quadrant | BADHDUFLAG | Total packets | Discarded packets |
| A | 0 | 13958 | 2 |
| B | 0 | 19730 | 2 |
| C | 0 | 14945 | 2 |
| D | 0 | 24692 | 2 |
| Mode M9 | |||
|---|---|---|---|
| Quadrant | BADHDUFLAG | Total packets | Discarded packets |
| A | 0 | 27 | 0 |
| B | 0 | 27 | 0 |
| C | 0 | 27 | 0 |
| D | 0 | 27 | 0 |
| Mode SS | |||
|---|---|---|---|
| Quadrant | BADHDUFLAG | Total packets | Discarded packets |
| A | 0 | 128 | 0 |
| B | 0 | 126 | 0 |
| C | 0 | 126 | 0 |
| D | 0 | 126 | 0 |
| Quadrant | Total seconds | Saturated seconds | Saturation percentage |
|---|---|---|---|
| A | 6205 | 61 | 0.983078% |
| B | 6206 | 139 | 2.239768% |
| C | 6205 | 240 | 3.867849% |
| D | 6205 | 1531 | 24.673650% |
Noise dominated data is calculated using 1-second bins in cleaned event files. If a bin has >2000 counts, and if more than 50% of those come from <1% of pixels, then it is considered to be noise-dominated and hence unusable.
| Quadrant | # 1 sec bins | Bins with >0 counts | Bins with >2000 counts | High rate bins dominated by noise | Noise dominated (total time) | Noise dominated (detector-on time) | Marked lightcurve |
|---|---|---|---|---|---|---|---|
| A | 8875 | 6206 | 1 | 1 | 0.01% | 0.02% | 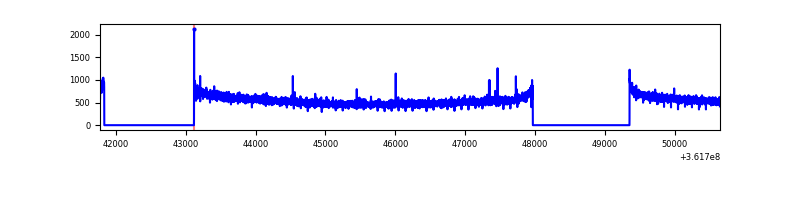 |
| B | 8876 | 6207 | 1 | 1 | 0.01% | 0.02% | 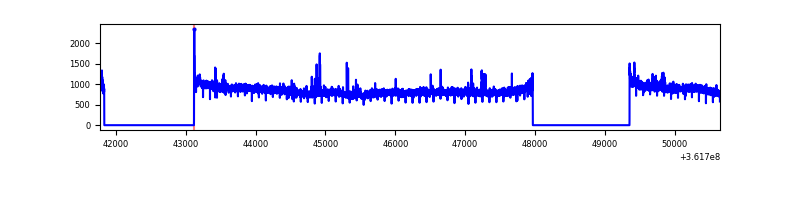 |
| C | 8875 | 6206 | 38 | 38 | 0.43% | 0.61% | 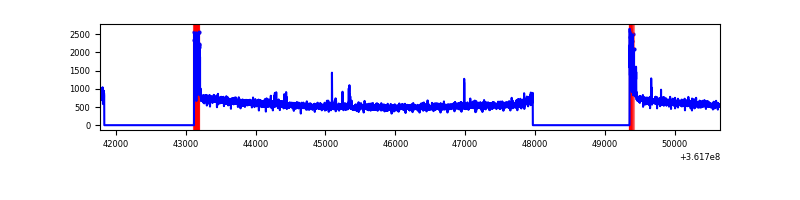 |
| D | 8875 | 6206 | 1217 | 1217 | 13.71% | 19.61% | 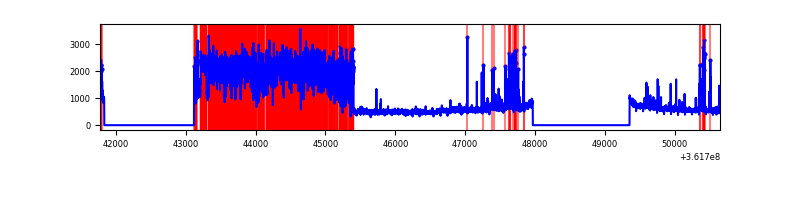 |
Top three noisy pixels from each quadrant. If the there are fewer than three noisy pixels in the level2.evt file, extra rows are filled as -1
| Pixel properties | Quadrant properties | ||||||
|---|---|---|---|---|---|---|---|
| Quadrant | DetID | PixID | Counts | Sigma | Mean | Median | Sigma |
| A | 13 | 254 | 11153 | 59.77 | 871 | 857 | 172.3 |
| A | 3 | 243 | 9973 | 52.92 | 871 | 857 | 172.3 |
| A | 3 | 137 | 7869 | 40.71 | 871 | 857 | 172.3 |
| B | 6 | 159 | 1779247 | 11004.02 | 870 | 851 | 161.6 |
| B | 0 | 183 | 44166 | 268.02 | 870 | 851 | 161.6 |
| B | 0 | 190 | 42162 | 255.62 | 870 | 851 | 161.6 |
| C | 0 | 10 | 161189 | 811.15 | 851 | 862 | 197.7 |
| C | 14 | 238 | 143209 | 720.18 | 851 | 862 | 197.7 |
| C | 3 | 233 | 34651 | 170.95 | 851 | 862 | 197.7 |
| D | 13 | 174 | 3184906 | 16873.93 | 803 | 785 | 188.7 |
| D | 8 | 195 | 286178 | 1512.41 | 803 | 785 | 188.7 |
| D | 2 | 250 | 240596 | 1270.85 | 803 | 785 | 188.7 |
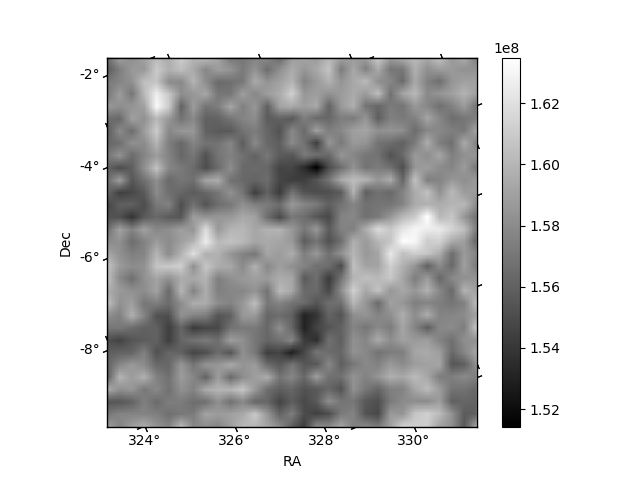
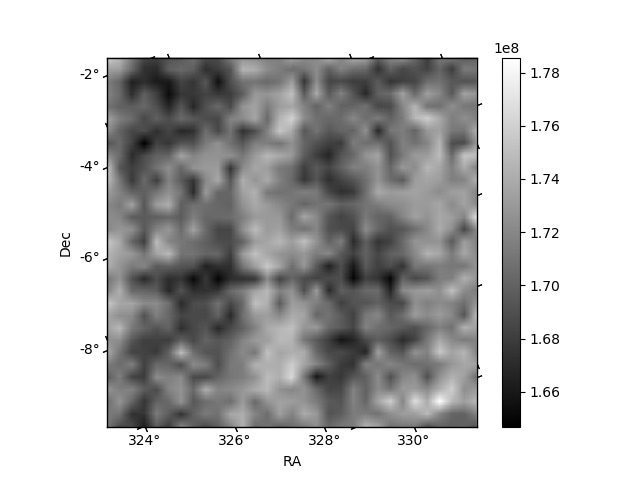
Histogram calculated using DETX and DETY for each event in the final _common_clean file
| Quadrant A | 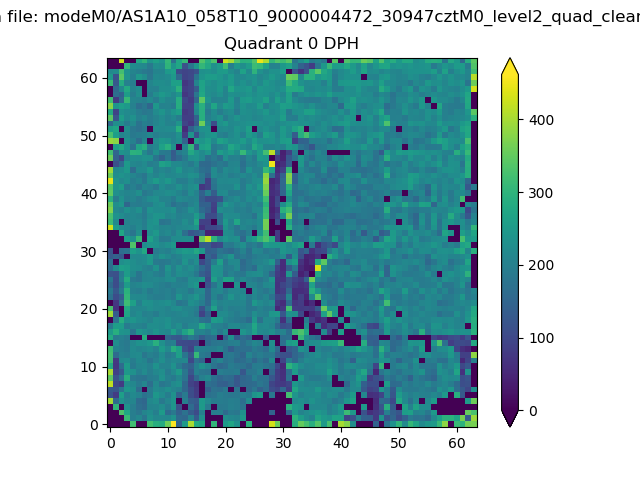 |
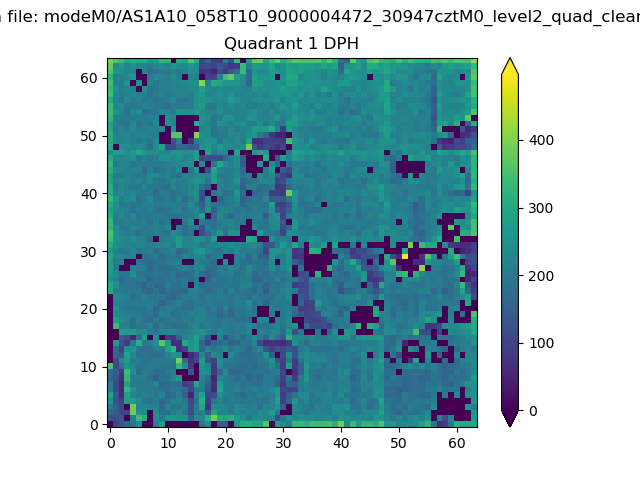 |
Quadrant B |
|---|---|---|---|
| Quadrant D |  |
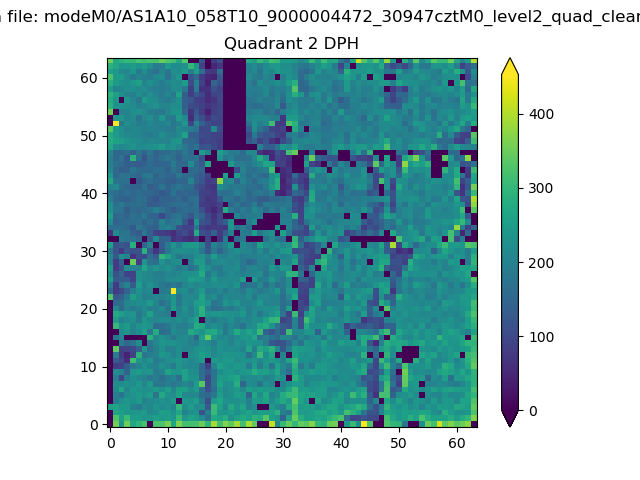 |
Quadrant C |
| Plot type | Count rate plots | Images |
|---|---|---|
| Comparison with Poisson distribution Blue bars denote a histogram of data divided into 1 sec bins. Red curve is a Poisson curve with rate = median count rate of data. |
 |
 |
| Quadrant-wise count rates Data is divided into 100 sec bins |
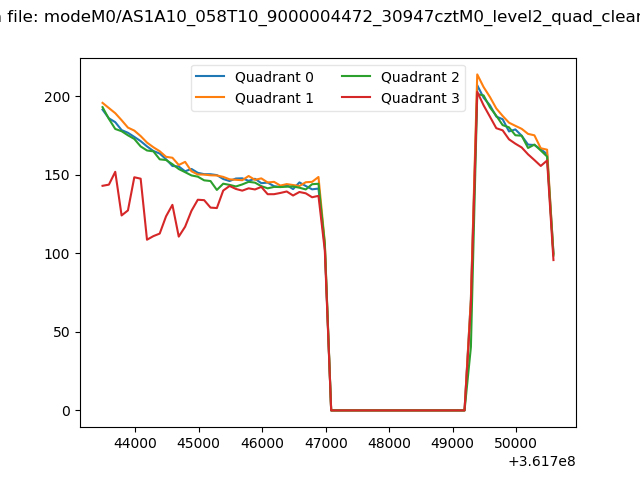 |
|
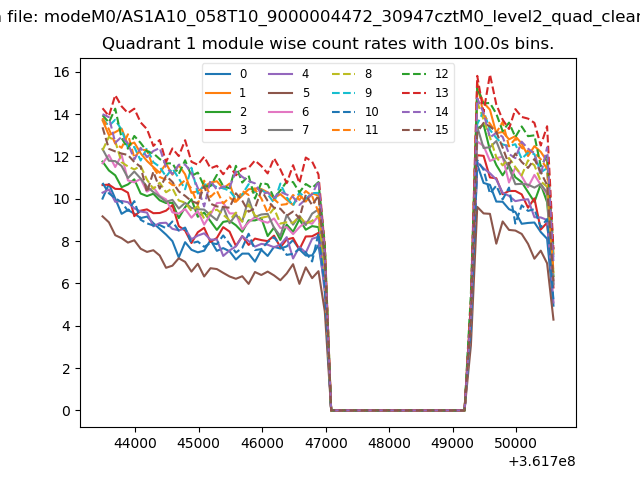
| Module-wise count rates for Quadrant A Data is divided into 100 sec bins |
 |
 |
| Module-wise count rates for Quadrant B Data is divided into 100 sec bins |
 |
 |
| Module-wise count rates for Quadrant C Data is divided into 100 sec bins |
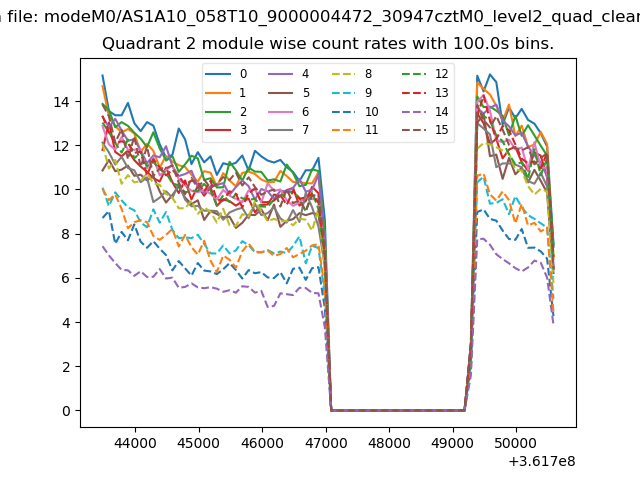 |
 |
| Module-wise count rates for Quadrant D Data is divided into 100 sec bins |
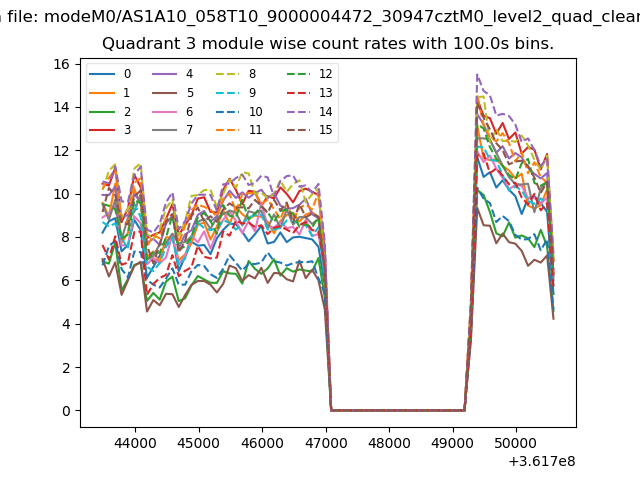 |
 |
| Parameter | Plot |
|---|---|
| CZT HV Monitor | 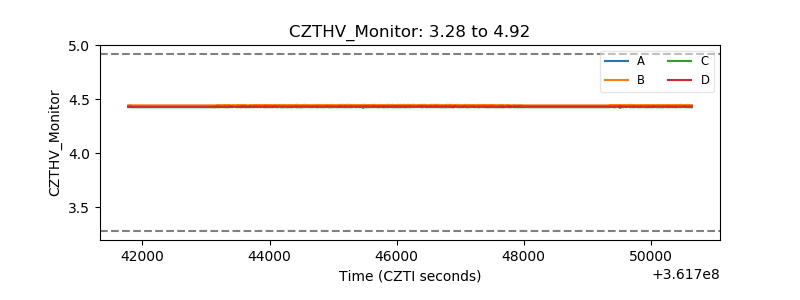 |
| D_VDD | 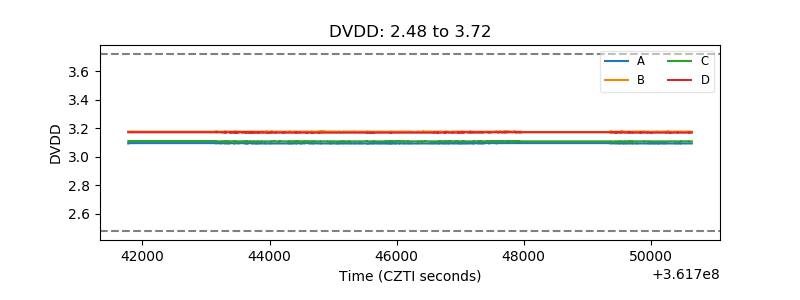 |
| Temperature 1 | 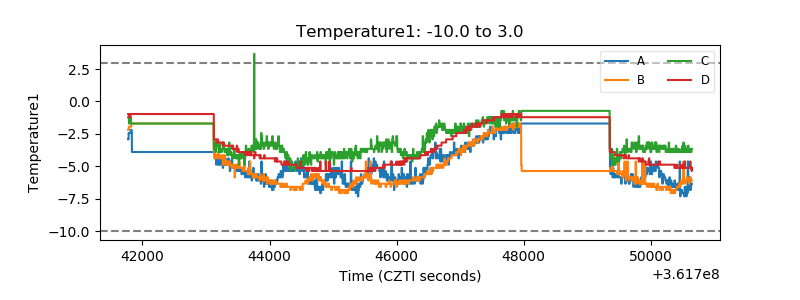 |
| Veto HV Monitor | 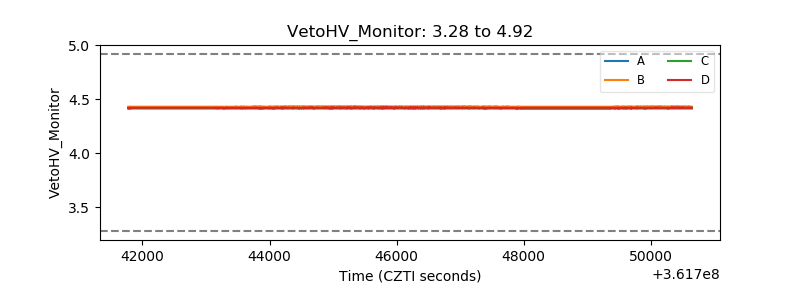 |
| Veto LLD | 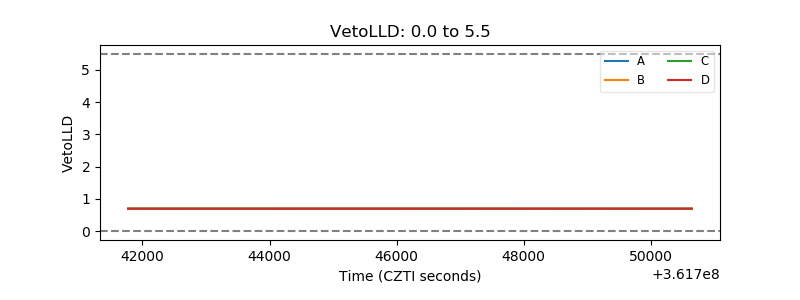 |
| Alpha Counter | 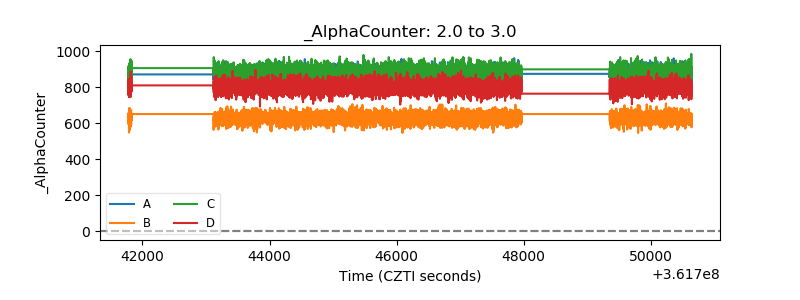 |
| _CPM_Rate | 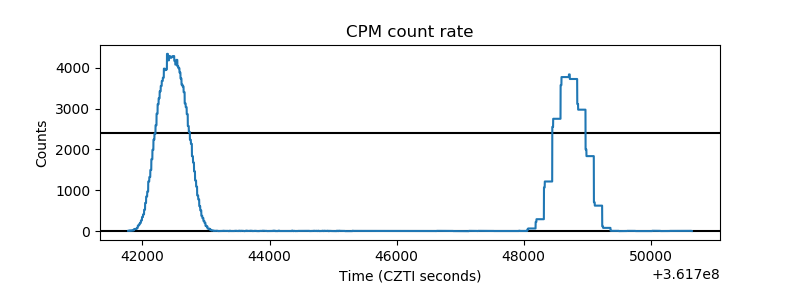 |
| CZT Counter | 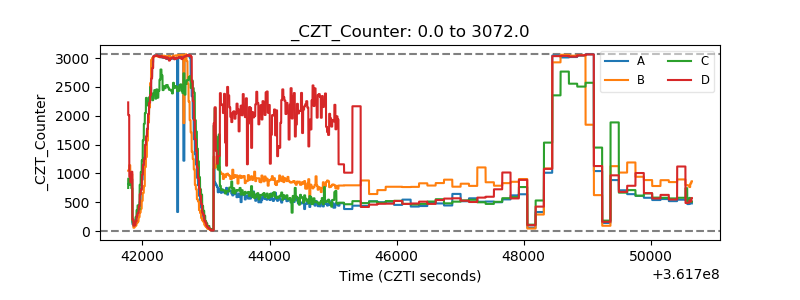 |
| +2.5 Volts monitor |  |
| +5 Volts monitor | 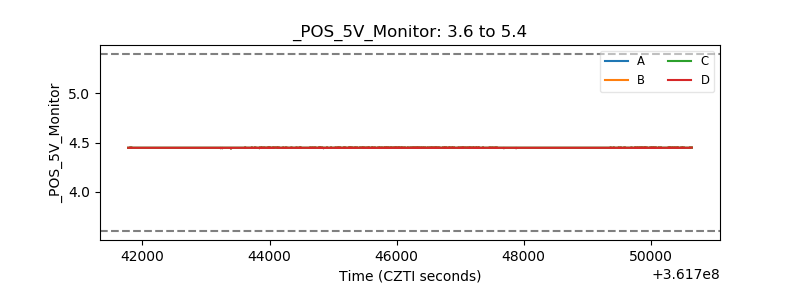 |
| _ROLL_ROT | 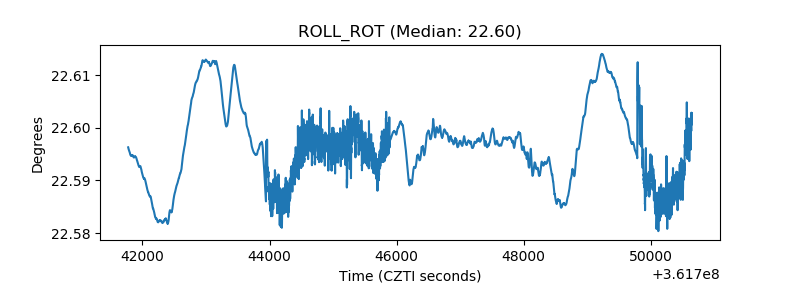 |
| _Roll_DEC | 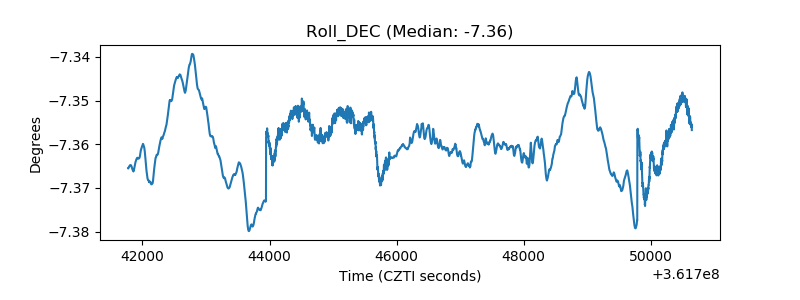 |
| _Roll_RA | 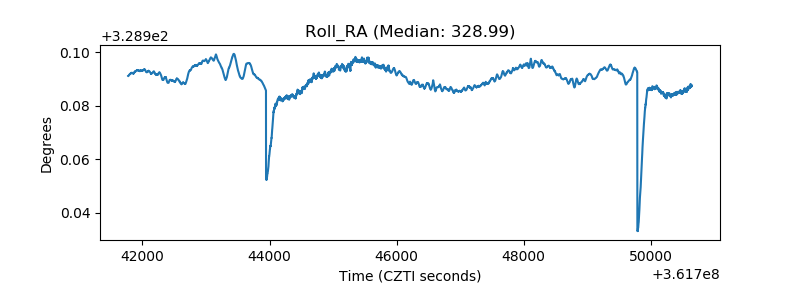 |
| Veto Counter | 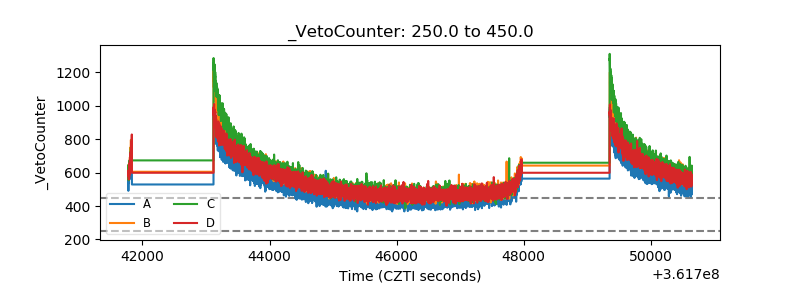 |