| Param | Original file | Final file |
|---|---|---|
| Filename | modeM0/AS1A10_058T10_9000004472_30948cztM0_level2.evt | modeM0/AS1A10_058T10_9000004472_30948cztM0_level2_quad_clean.evt |
| Size (bytes) | 542,234,880 | 117,567,360 |
| Size | 517.1 MB | 112.1 MB |
| Events in quadrant A | 3,294,676 | 789,180 |
| Events in quadrant B | 5,238,123 | 802,938 |
| Events in quadrant C | 3,590,035 | 776,971 |
| Events in quadrant D | 3,879,180 | 759,130 |
| Mode M0 | |||
|---|---|---|---|
| Quadrant | BADHDUFLAG | Total packets | Discarded packets |
| A | 0 | 13532 | 2 |
| B | 0 | 19559 | 2 |
| C | 0 | 14568 | 2 |
| D | 0 | 15493 | 2 |
| Mode M9 | |||
|---|---|---|---|
| Quadrant | BADHDUFLAG | Total packets | Discarded packets |
| A | 0 | 14 | 0 |
| B | 0 | 15 | 0 |
| C | 0 | 15 | 0 |
| D | 0 | 15 | 0 |
| Mode SS | |||
|---|---|---|---|
| Quadrant | BADHDUFLAG | Total packets | Discarded packets |
| A | 0 | 124 | 0 |
| B | 0 | 124 | 0 |
| C | 0 | 124 | 0 |
| D | 0 | 124 | 0 |
| Quadrant | Total seconds | Saturated seconds | Saturation percentage |
|---|---|---|---|
| A | 6206 | 31 | 0.499517% |
| B | 6206 | 137 | 2.207541% |
| C | 6206 | 178 | 2.868192% |
| D | 6206 | 82 | 1.321302% |
Noise dominated data is calculated using 1-second bins in cleaned event files. If a bin has >2000 counts, and if more than 50% of those come from <1% of pixels, then it is considered to be noise-dominated and hence unusable.
| Quadrant | # 1 sec bins | Bins with >0 counts | Bins with >2000 counts | High rate bins dominated by noise | Noise dominated (total time) | Noise dominated (detector-on time) | Marked lightcurve |
|---|---|---|---|---|---|---|---|
| A | 7561 | 6207 | 0 | 0 | 0.00% | 0.00% | 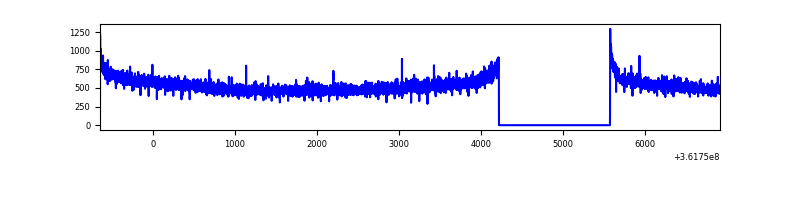 |
| B | 7561 | 6206 | 2 | 2 | 0.03% | 0.03% | 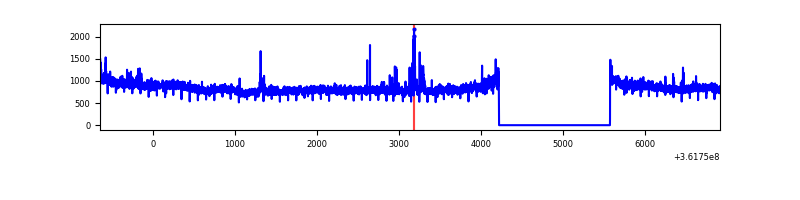 |
| C | 7561 | 6207 | 20 | 20 | 0.26% | 0.32% | 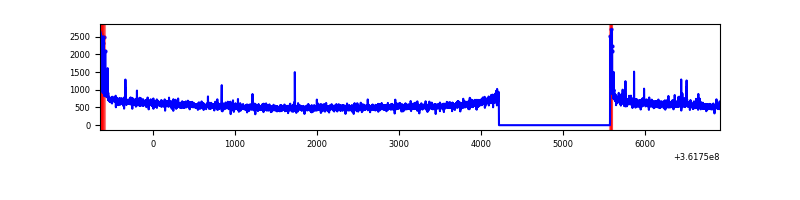 |
| D | 7561 | 6207 | 59 | 59 | 0.78% | 0.95% | 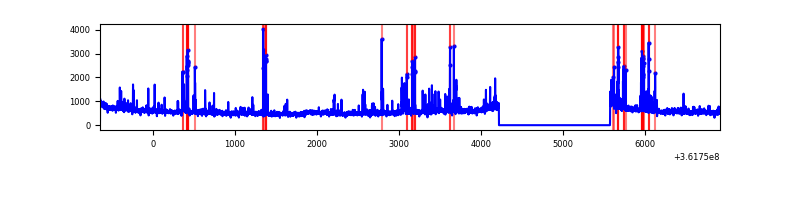 |
Top three noisy pixels from each quadrant. If the there are fewer than three noisy pixels in the level2.evt file, extra rows are filled as -1
| Pixel properties | Quadrant properties | ||||||
|---|---|---|---|---|---|---|---|
| Quadrant | DetID | PixID | Counts | Sigma | Mean | Median | Sigma |
| A | 11 | 47 | 14114 | 78.92 | 849 | 836 | 168.3 |
| A | 13 | 254 | 10519 | 57.55 | 849 | 836 | 168.3 |
| A | 3 | 137 | 7763 | 41.17 | 849 | 836 | 168.3 |
| B | 6 | 159 | 1768681 | 11130.24 | 850 | 830 | 158.8 |
| B | 0 | 183 | 43500 | 268.65 | 850 | 830 | 158.8 |
| B | 15 | 33 | 40203 | 247.89 | 850 | 830 | 158.8 |
| C | 14 | 238 | 145461 | 746.22 | 833 | 843 | 193.8 |
| C | 0 | 10 | 91440 | 467.47 | 833 | 843 | 193.8 |
| C | 3 | 233 | 58917 | 299.66 | 833 | 843 | 193.8 |
| D | 15 | 47 | 308992 | 1564.71 | 837 | 819 | 197.0 |
| D | 8 | 195 | 261658 | 1324.38 | 837 | 819 | 197.0 |
| D | 2 | 250 | 96112 | 483.84 | 837 | 819 | 197.0 |
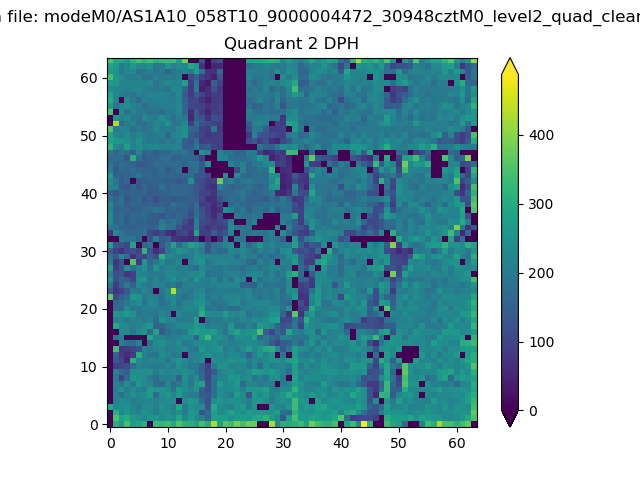
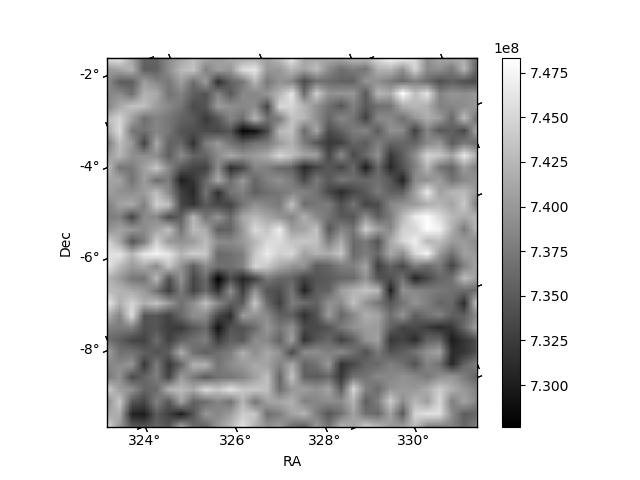
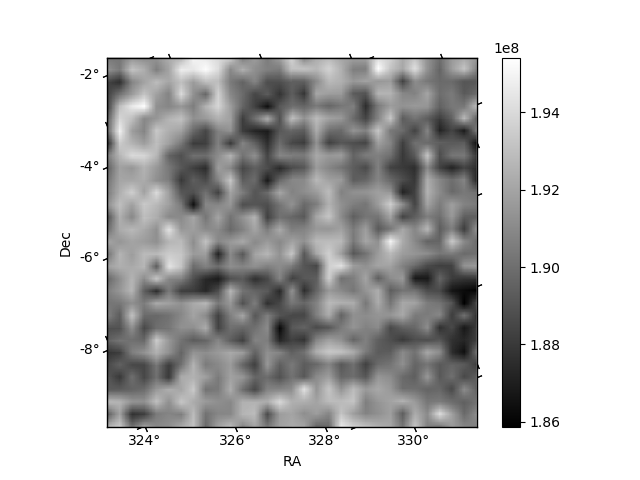
Histogram calculated using DETX and DETY for each event in the final _common_clean file
| Quadrant A | 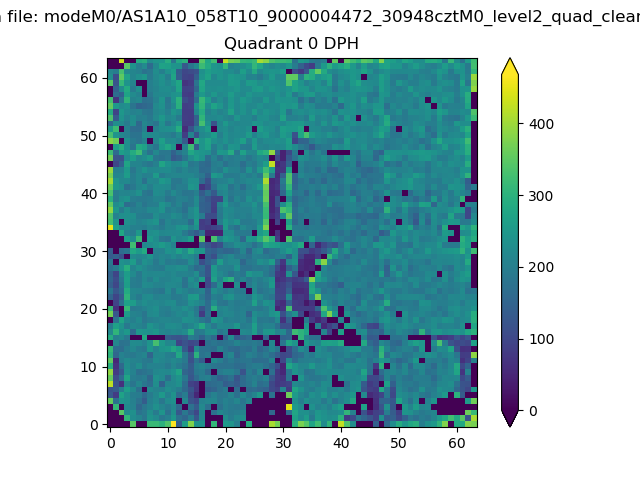 |
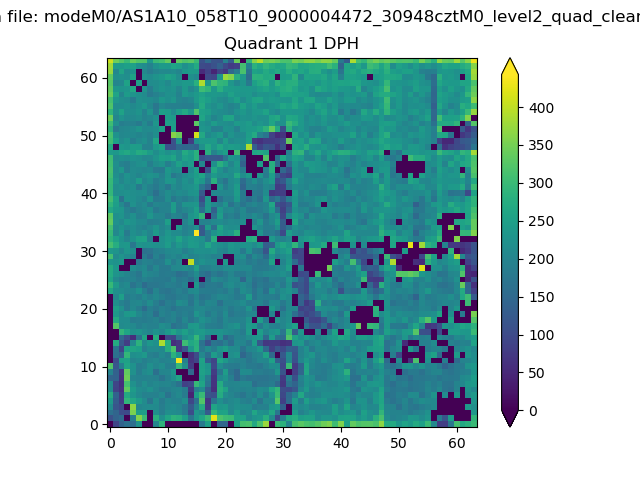 |
Quadrant B |
|---|---|---|---|
| Quadrant D | 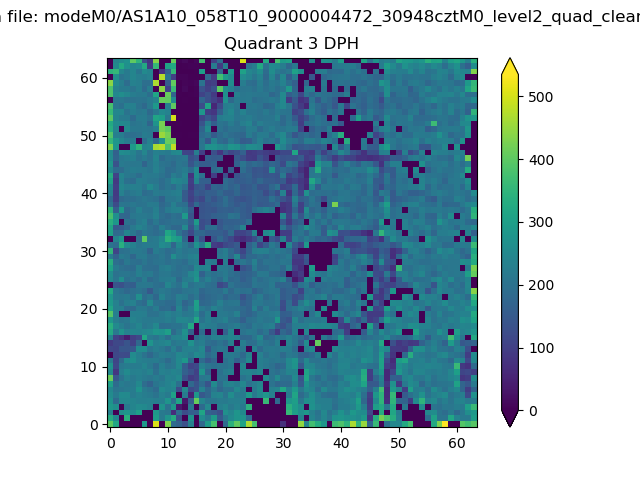 |
 |
Quadrant C |
| Plot type | Count rate plots | Images |
|---|---|---|
| Comparison with Poisson distribution Blue bars denote a histogram of data divided into 1 sec bins. Red curve is a Poisson curve with rate = median count rate of data. |
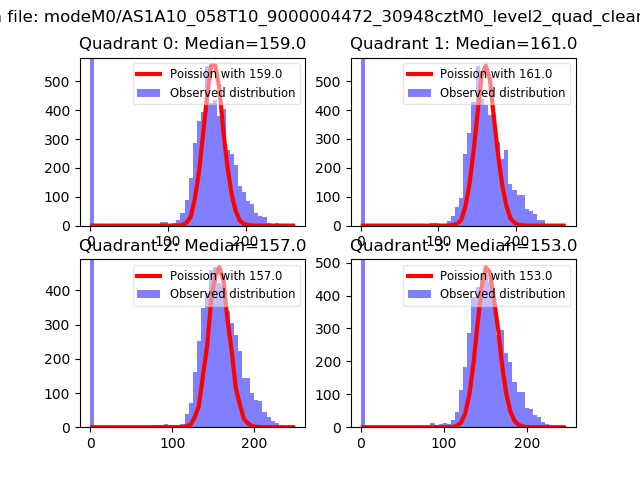 |
 |
| Quadrant-wise count rates Data is divided into 100 sec bins |
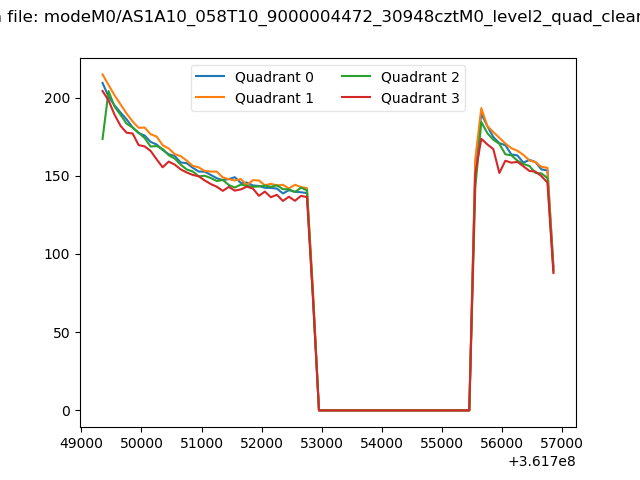 |
|
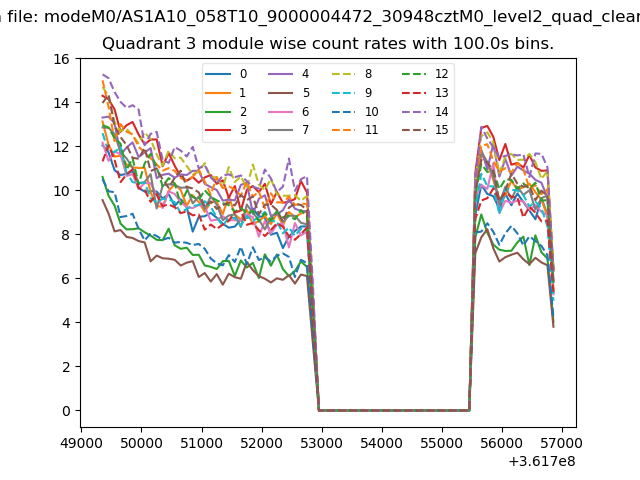
| Module-wise count rates for Quadrant A Data is divided into 100 sec bins |
 |
 |
| Module-wise count rates for Quadrant B Data is divided into 100 sec bins |
 |
 |
| Module-wise count rates for Quadrant C Data is divided into 100 sec bins |
 |
 |
| Module-wise count rates for Quadrant D Data is divided into 100 sec bins |
 |
 |
| Parameter | Plot |
|---|---|
| CZT HV Monitor | 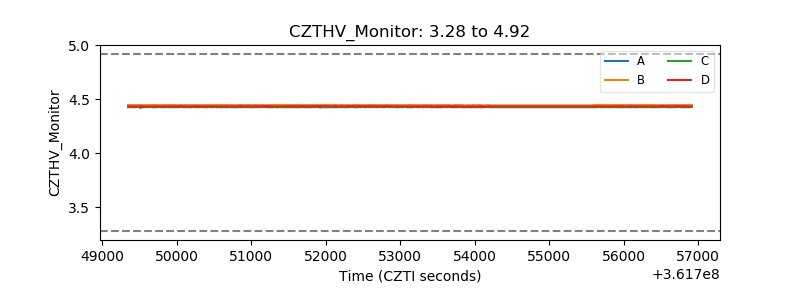 |
| D_VDD | 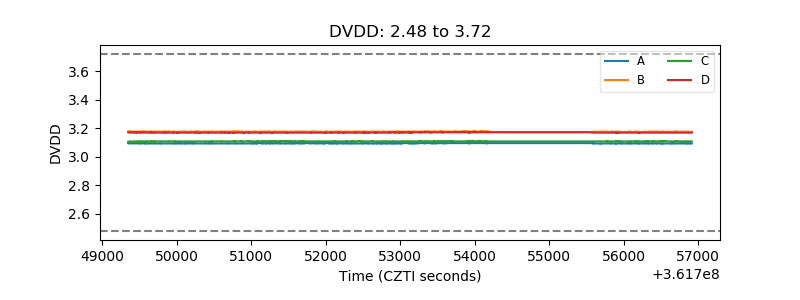 |
| Temperature 1 | 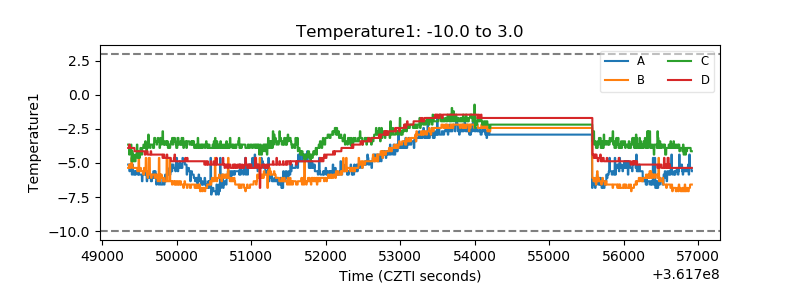 |
| Veto HV Monitor | 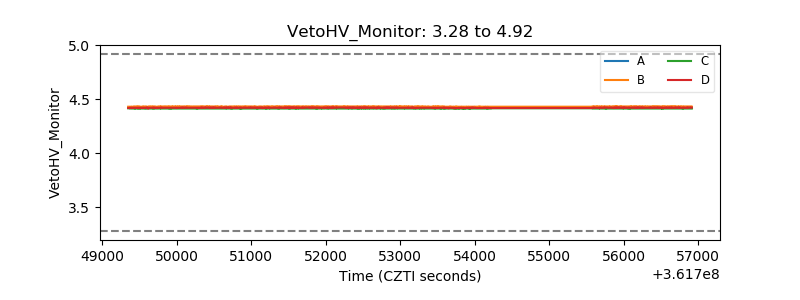 |
| Veto LLD |  |
| Alpha Counter | 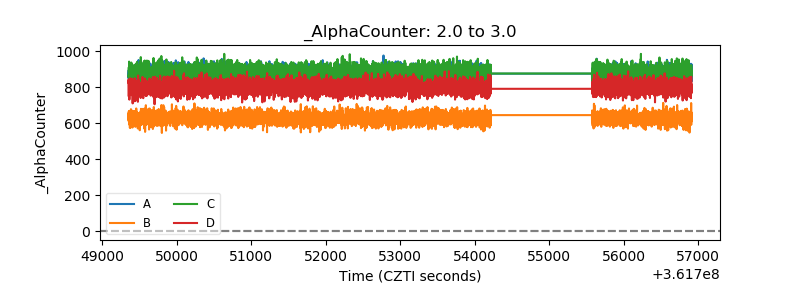 |
| _CPM_Rate | 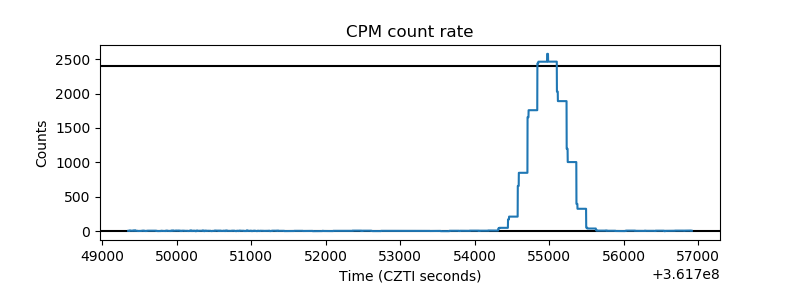 |
| CZT Counter | 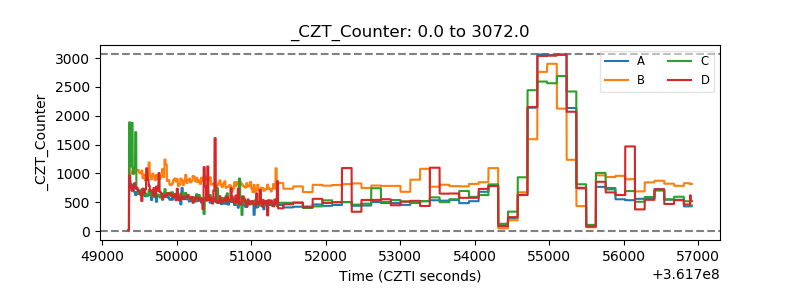 |
| +2.5 Volts monitor |  |
| +5 Volts monitor |  |
| _ROLL_ROT | 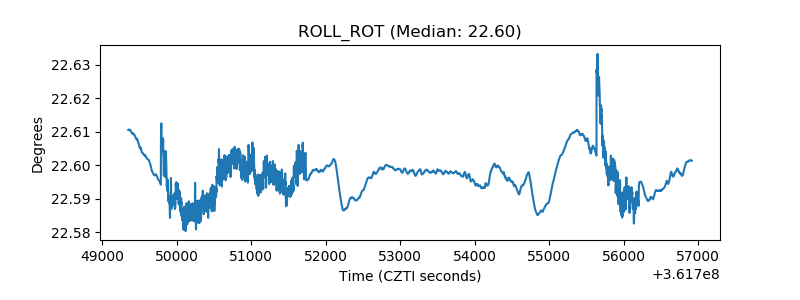 |
| _Roll_DEC | 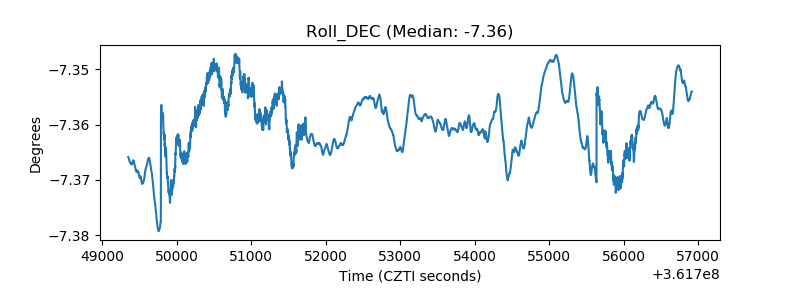 |
| _Roll_RA | 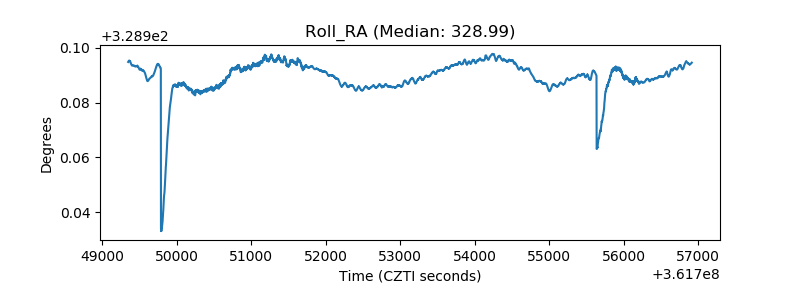 |
| Veto Counter | 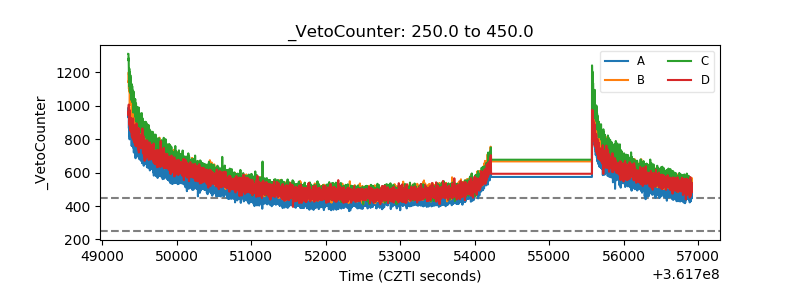 |