| Param | Original file | Final file |
|---|---|---|
| Filename | modeM0/AS1A10_058T10_9000004472_30949cztM0_level2.evt | modeM0/AS1A10_058T10_9000004472_30949cztM0_level2_quad_clean.evt |
| Size (bytes) | 541,944,000 | 103,181,760 |
| Size | 516.8 MB | 98.4 MB |
| Events in quadrant A | 3,242,699 | 682,015 |
| Events in quadrant B | 5,115,980 | 687,164 |
| Events in quadrant C | 3,637,560 | 663,826 |
| Events in quadrant D | 3,989,506 | 651,881 |
| Mode M0 | |||
|---|---|---|---|
| Quadrant | BADHDUFLAG | Total packets | Discarded packets |
| A | 0 | 13476 | 2 |
| B | 0 | 19490 | 2 |
| C | 0 | 14656 | 2 |
| D | 0 | 15847 | 2 |
| Mode M9 | |||
|---|---|---|---|
| Quadrant | BADHDUFLAG | Total packets | Discarded packets |
| A | 0 | 16 | 0 |
| B | 0 | 17 | 0 |
| C | 0 | 17 | 0 |
| D | 0 | 17 | 0 |
| Mode SS | |||
|---|---|---|---|
| Quadrant | BADHDUFLAG | Total packets | Discarded packets |
| A | 0 | 128 | 0 |
| B | 0 | 128 | 0 |
| C | 0 | 128 | 0 |
| D | 0 | 128 | 0 |
| Quadrant | Total seconds | Saturated seconds | Saturation percentage |
|---|---|---|---|
| A | 6306 | 47 | 0.745322% |
| B | 6306 | 171 | 2.711703% |
| C | 6306 | 212 | 3.361878% |
| D | 6306 | 115 | 1.823660% |
Noise dominated data is calculated using 1-second bins in cleaned event files. If a bin has >2000 counts, and if more than 50% of those come from <1% of pixels, then it is considered to be noise-dominated and hence unusable.
| Quadrant | # 1 sec bins | Bins with >0 counts | Bins with >2000 counts | High rate bins dominated by noise | Noise dominated (total time) | Noise dominated (detector-on time) | Marked lightcurve |
|---|---|---|---|---|---|---|---|
| A | 7526 | 6307 | 0 | 0 | 0.00% | 0.00% | 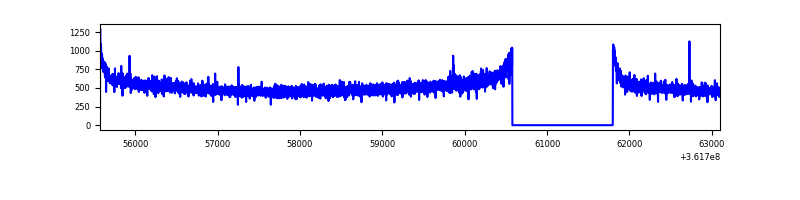 |
| B | 7526 | 6307 | 1 | 1 | 0.01% | 0.02% | 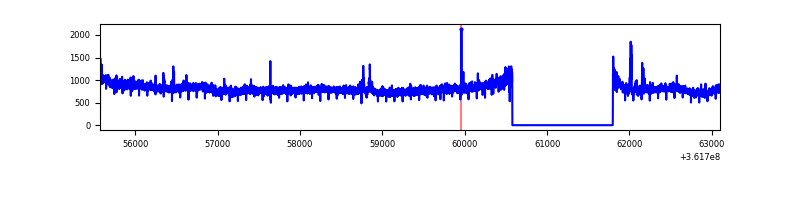 |
| C | 7526 | 6307 | 10 | 10 | 0.13% | 0.16% | 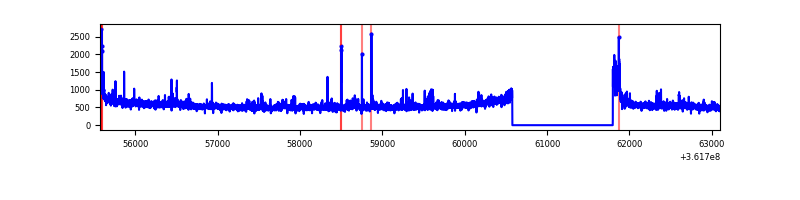 |
| D | 7526 | 6307 | 71 | 71 | 0.94% | 1.13% | 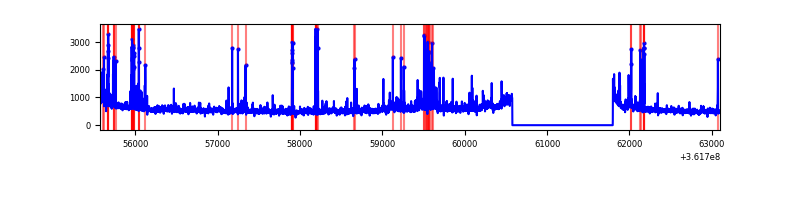 |
Top three noisy pixels from each quadrant. If the there are fewer than three noisy pixels in the level2.evt file, extra rows are filled as -1
| Pixel properties | Quadrant properties | ||||||
|---|---|---|---|---|---|---|---|
| Quadrant | DetID | PixID | Counts | Sigma | Mean | Median | Sigma |
| A | 13 | 254 | 11178 | 61.99 | 838 | 825 | 167.0 |
| A | 3 | 243 | 7941 | 42.61 | 838 | 825 | 167.0 |
| A | 3 | 137 | 7879 | 42.24 | 838 | 825 | 167.0 |
| B | 6 | 159 | 1749385 | 11072.37 | 835 | 817 | 157.9 |
| B | 0 | 190 | 46761 | 290.93 | 835 | 817 | 157.9 |
| B | 0 | 183 | 24170 | 147.88 | 835 | 817 | 157.9 |
| C | 3 | 233 | 148310 | 773.53 | 815 | 824 | 190.7 |
| C | 14 | 238 | 145007 | 756.21 | 815 | 824 | 190.7 |
| C | 0 | 10 | 118645 | 617.95 | 815 | 824 | 190.7 |
| D | 8 | 195 | 349134 | 1794.93 | 820 | 802 | 194.1 |
| D | 15 | 47 | 277093 | 1423.71 | 820 | 802 | 194.1 |
| D | 2 | 250 | 117742 | 602.58 | 820 | 802 | 194.1 |
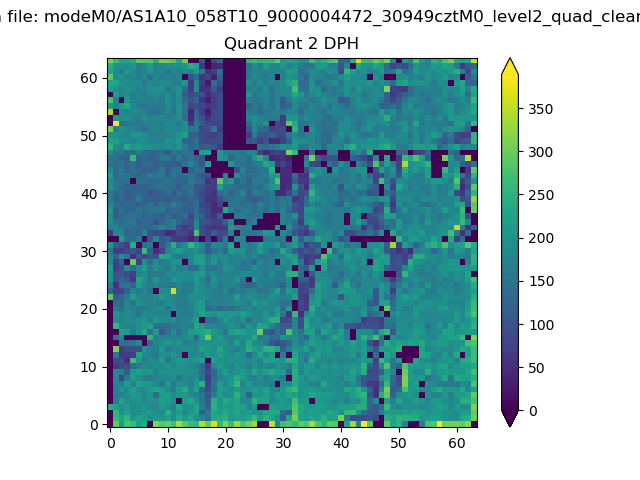
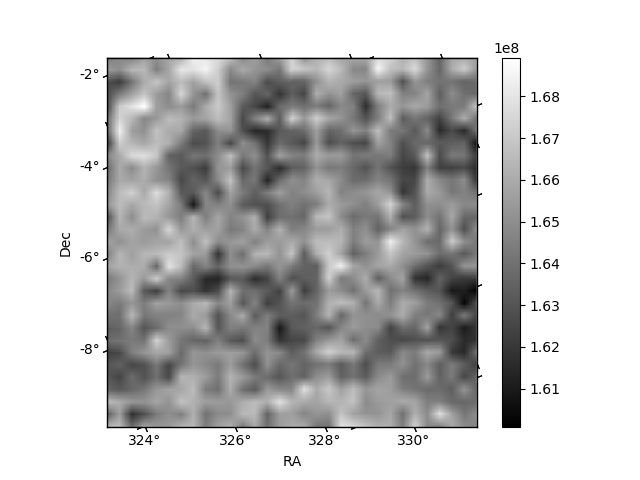
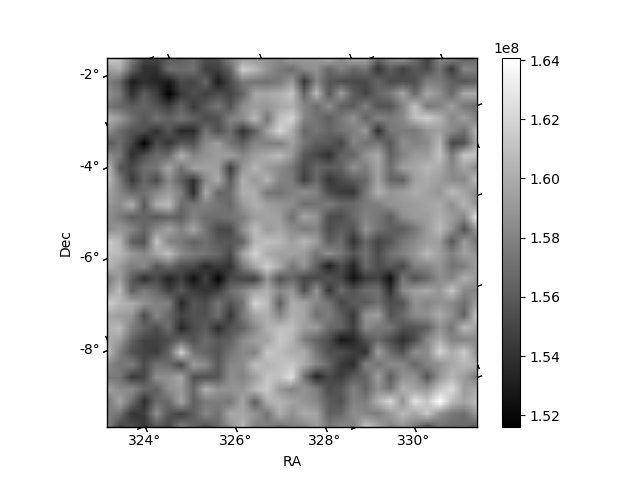
Histogram calculated using DETX and DETY for each event in the final _common_clean file
| Quadrant A |  |
 |
Quadrant B |
|---|---|---|---|
| Quadrant D | 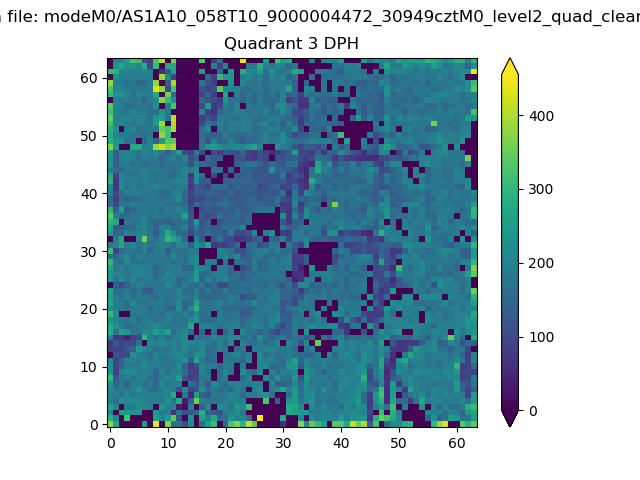 |
 |
Quadrant C |
| Plot type | Count rate plots | Images |
|---|---|---|
| Comparison with Poisson distribution Blue bars denote a histogram of data divided into 1 sec bins. Red curve is a Poisson curve with rate = median count rate of data. |
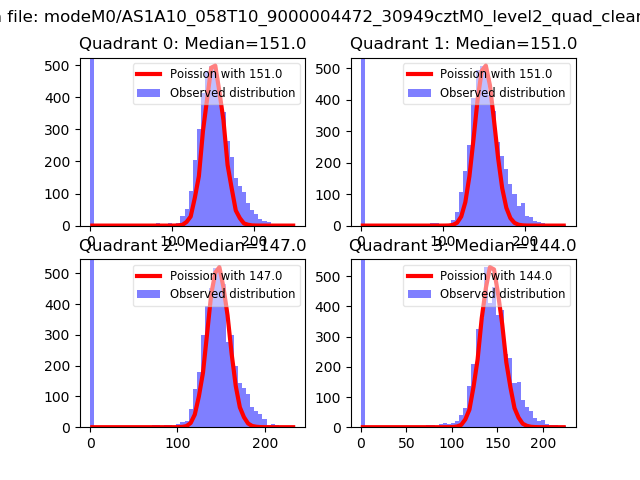 |
 |
| Quadrant-wise count rates Data is divided into 100 sec bins |
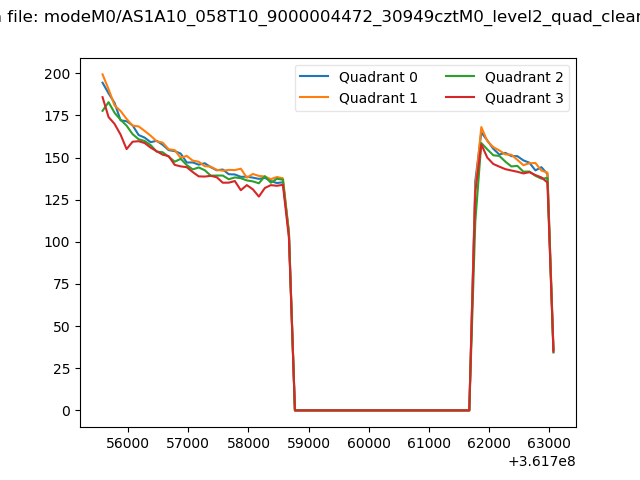 |
|
| Module-wise count rates for Quadrant A Data is divided into 100 sec bins |
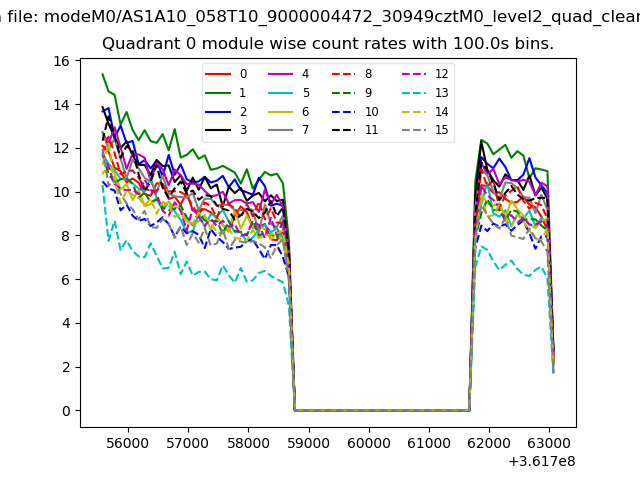 |
 |
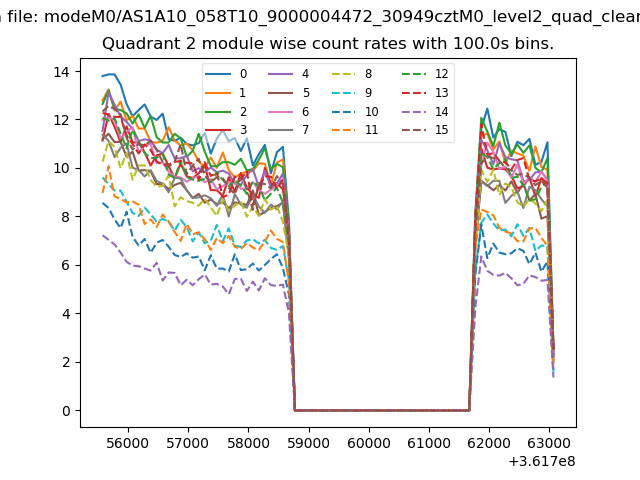
| Module-wise count rates for Quadrant B Data is divided into 100 sec bins |
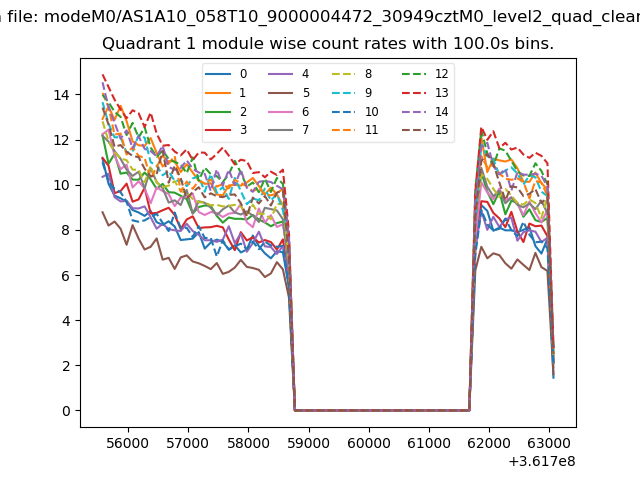 |
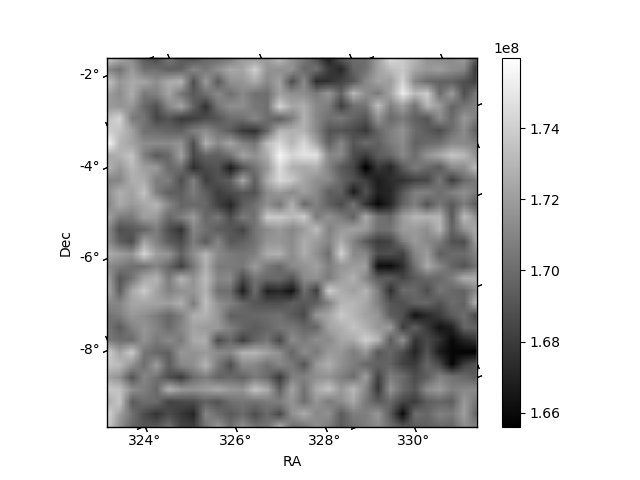 |
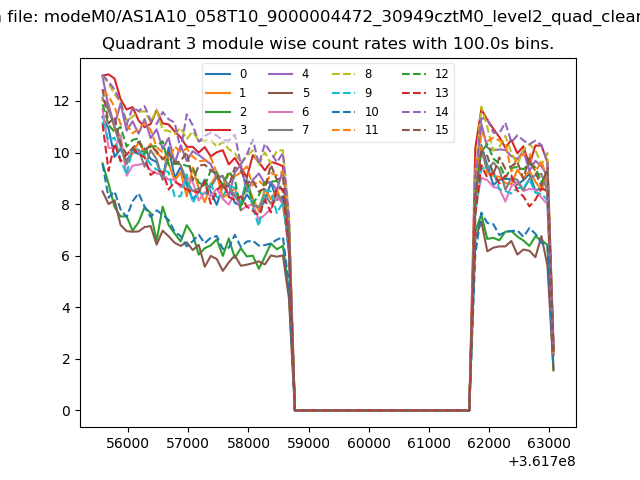
| Module-wise count rates for Quadrant C Data is divided into 100 sec bins |
 |
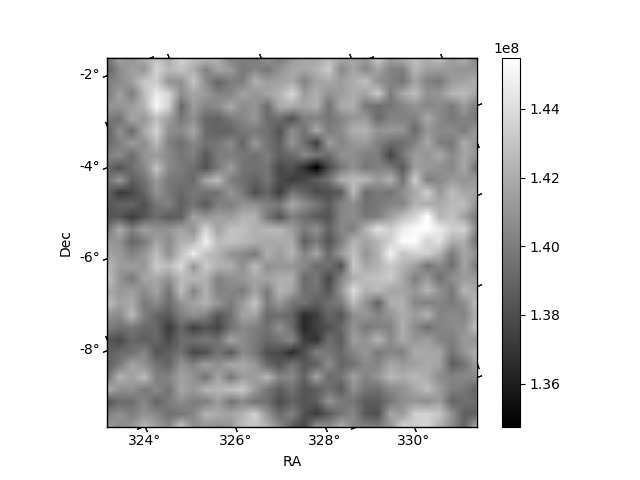 |
| Module-wise count rates for Quadrant D Data is divided into 100 sec bins |
 |
 |
| Parameter | Plot |
|---|---|
| CZT HV Monitor |  |
| D_VDD | 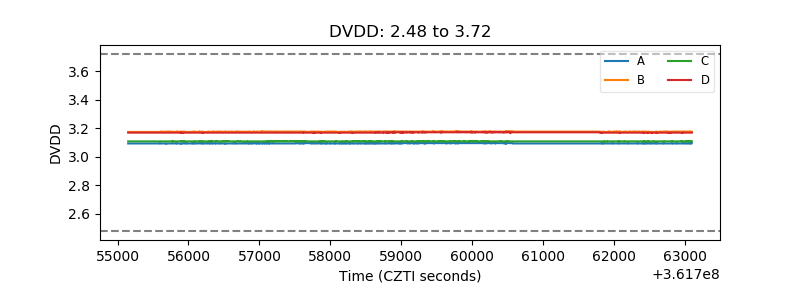 |
| Temperature 1 | 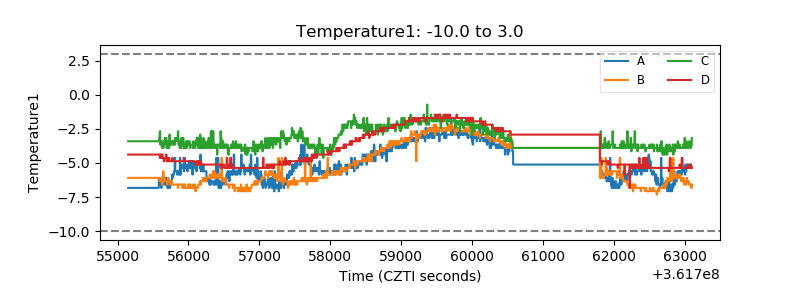 |
| Veto HV Monitor | 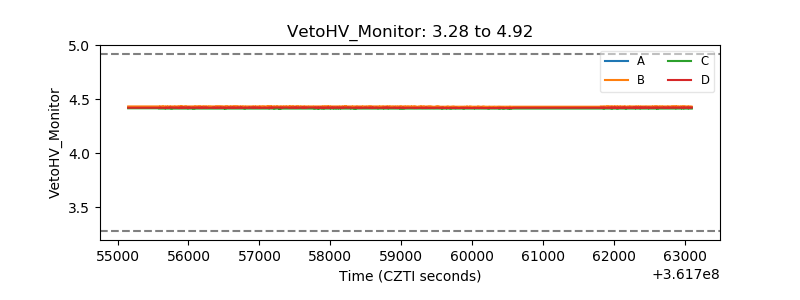 |
| Veto LLD | 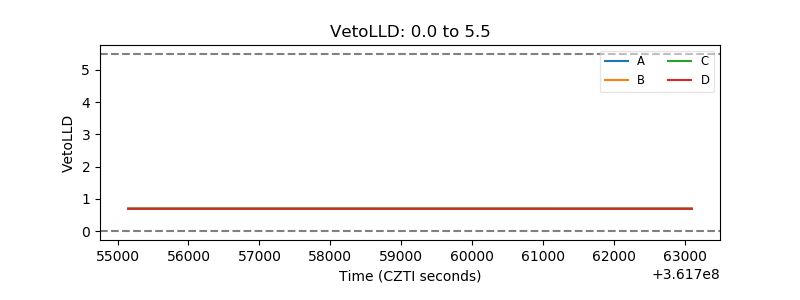 |
| Alpha Counter | 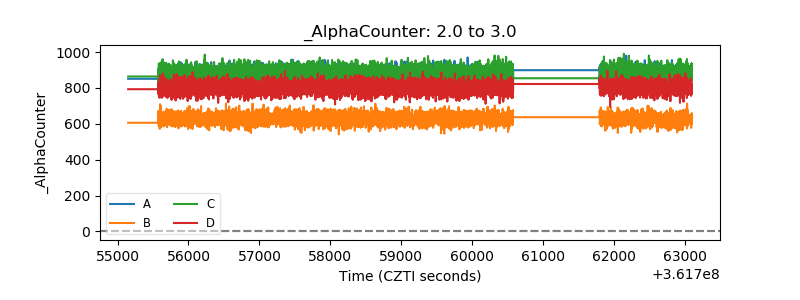 |
| _CPM_Rate | 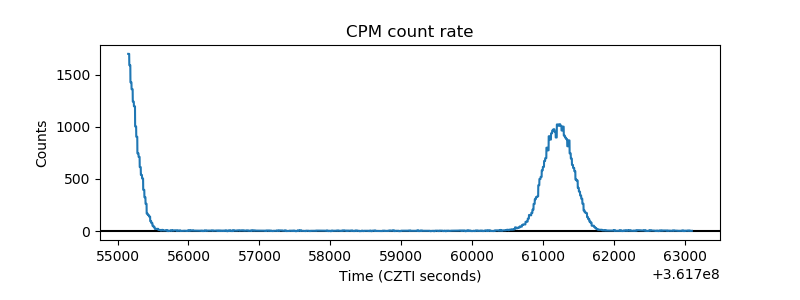 |
| CZT Counter | 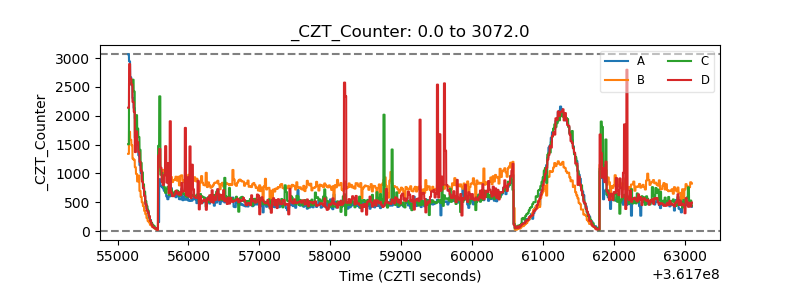 |
| +2.5 Volts monitor |  |
| +5 Volts monitor | 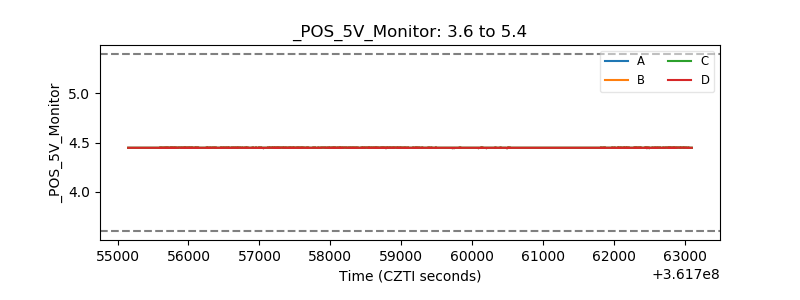 |
| _ROLL_ROT | 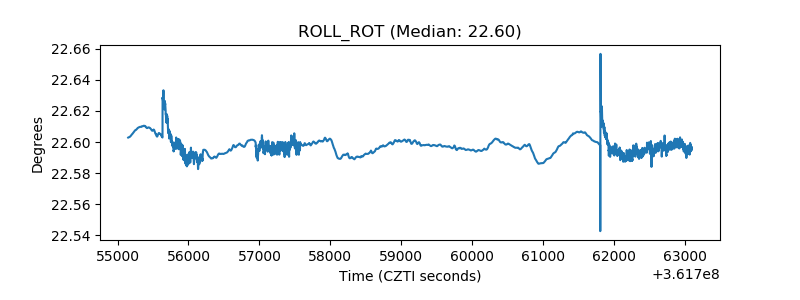 |
| _Roll_DEC | 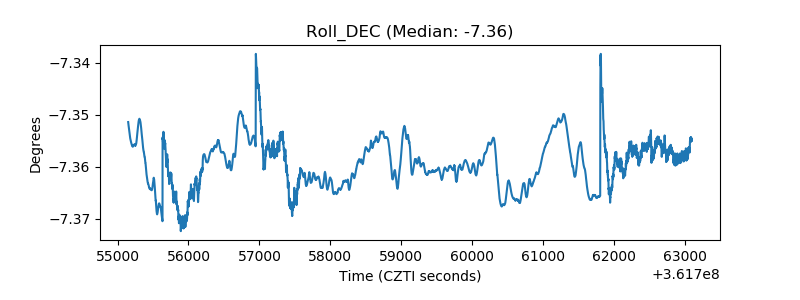 |
| _Roll_RA | 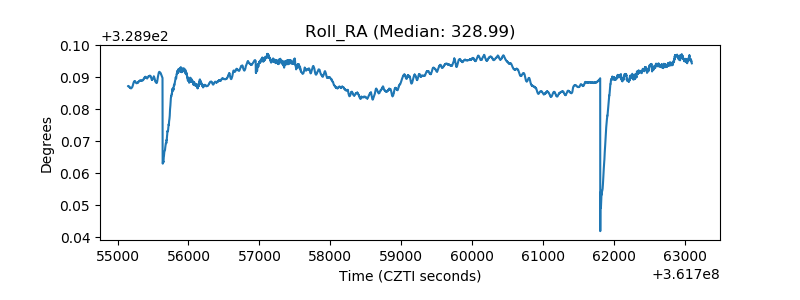 |
| Veto Counter | 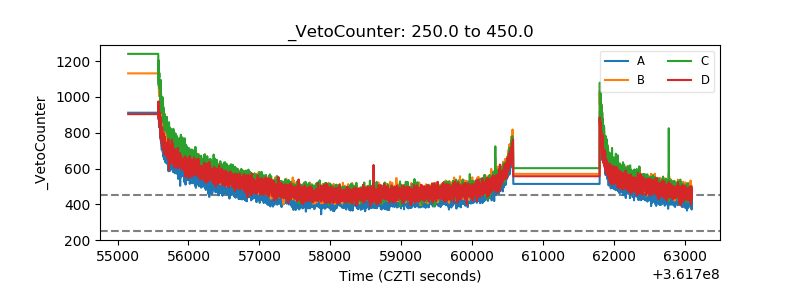 |