| Param | Original file | Final file |
|---|---|---|
| Filename | modeM0/AS1A10_058T10_9000004472_30951cztM0_level2.evt | modeM0/AS1A10_058T10_9000004472_30951cztM0_level2_quad_clean.evt |
| Size (bytes) | 592,104,960 | 105,940,800 |
| Size | 564.7 MB | 101.0 MB |
| Events in quadrant A | 3,554,047 | 685,035 |
| Events in quadrant B | 5,686,750 | 684,622 |
| Events in quadrant C | 3,991,179 | 664,409 |
| Events in quadrant D | 4,194,424 | 655,107 |
| Mode M0 | |||
|---|---|---|---|
| Quadrant | BADHDUFLAG | Total packets | Discarded packets |
| A | 0 | 15297 | 3 |
| B | 0 | 22554 | 2 |
| C | 0 | 16473 | 2 |
| D | 0 | 16993 | 2 |
| Mode M9 | |||
|---|---|---|---|
| Quadrant | BADHDUFLAG | Total packets | Discarded packets |
| A | 0 | 3 | 0 |
| B | 0 | 3 | 0 |
| C | 0 | 3 | 0 |
| D | 0 | 3 | 0 |
| Mode SS | |||
|---|---|---|---|
| Quadrant | BADHDUFLAG | Total packets | Discarded packets |
| A | 0 | 154 | 0 |
| B | 0 | 154 | 0 |
| C | 0 | 154 | 0 |
| D | 0 | 154 | 0 |
| Quadrant | Total seconds | Saturated seconds | Saturation percentage |
|---|---|---|---|
| A | 7447 | 114 | 1.530818% |
| B | 7448 | 173 | 2.322771% |
| C | 7448 | 364 | 4.887218% |
| D | 7448 | 148 | 1.987111% |
Noise dominated data is calculated using 1-second bins in cleaned event files. If a bin has >2000 counts, and if more than 50% of those come from <1% of pixels, then it is considered to be noise-dominated and hence unusable.
| Quadrant | # 1 sec bins | Bins with >0 counts | Bins with >2000 counts | High rate bins dominated by noise | Noise dominated (total time) | Noise dominated (detector-on time) | Marked lightcurve |
|---|---|---|---|---|---|---|---|
| A | 7872 | 7447 | 0 | 0 | 0.00% | 0.00% | 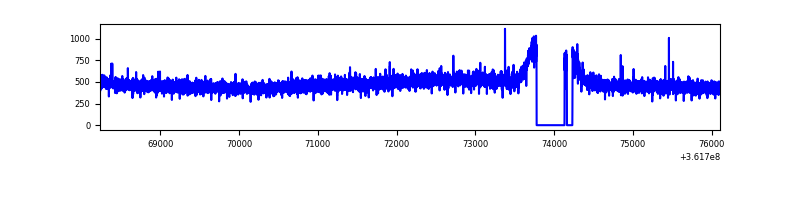 |
| B | 7873 | 7448 | 1 | 1 | 0.01% | 0.01% | 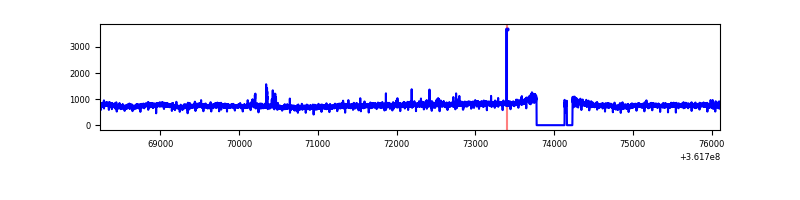 |
| C | 7873 | 7448 | 2 | 2 | 0.03% | 0.03% | 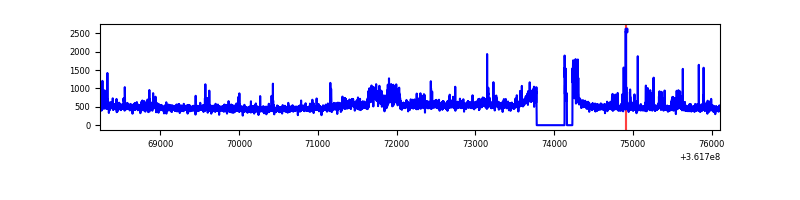 |
| D | 7873 | 7449 | 34 | 34 | 0.43% | 0.46% | 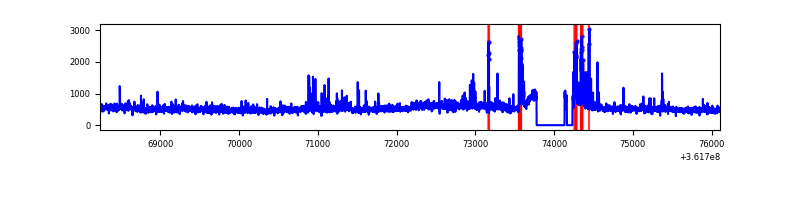 |
Top three noisy pixels from each quadrant. If the there are fewer than three noisy pixels in the level2.evt file, extra rows are filled as -1
| Pixel properties | Quadrant properties | ||||||
|---|---|---|---|---|---|---|---|
| Quadrant | DetID | PixID | Counts | Sigma | Mean | Median | Sigma |
| A | 13 | 254 | 13366 | 67.53 | 920 | 900 | 184.6 |
| A | 3 | 137 | 9266 | 45.32 | 920 | 900 | 184.6 |
| A | 0 | 226 | 7736 | 37.03 | 920 | 900 | 184.6 |
| B | 6 | 159 | 2045456 | 11613.87 | 907 | 884 | 176.0 |
| B | 0 | 190 | 37606 | 208.59 | 907 | 884 | 176.0 |
| B | 12 | 111 | 21764 | 118.61 | 907 | 884 | 176.0 |
| C | 14 | 238 | 212309 | 1027.49 | 875 | 879 | 205.8 |
| C | 0 | 10 | 192600 | 931.71 | 875 | 879 | 205.8 |
| C | 14 | 254 | 111376 | 536.98 | 875 | 879 | 205.8 |
| D | 8 | 195 | 450377 | 1955.19 | 889 | 871 | 229.9 |
| D | 15 | 47 | 186147 | 805.88 | 889 | 871 | 229.9 |
| D | 13 | 174 | 100903 | 435.1 | 889 | 871 | 229.9 |
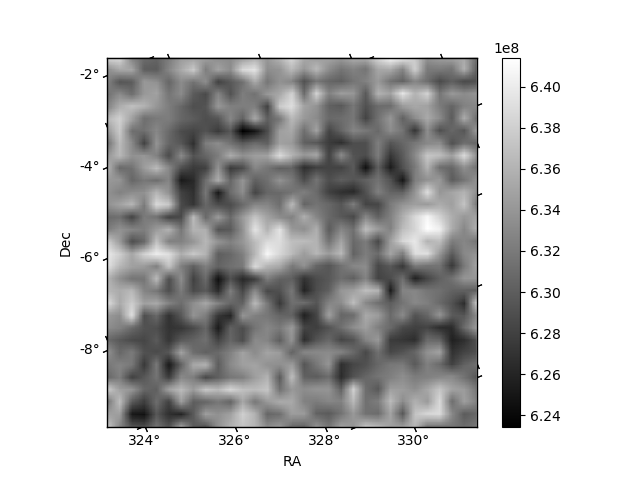
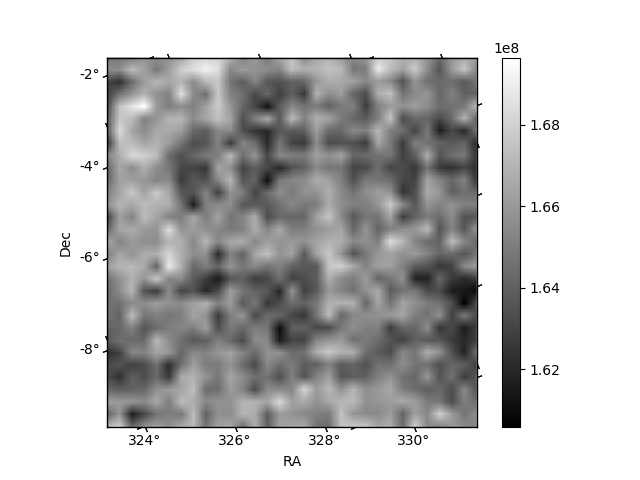
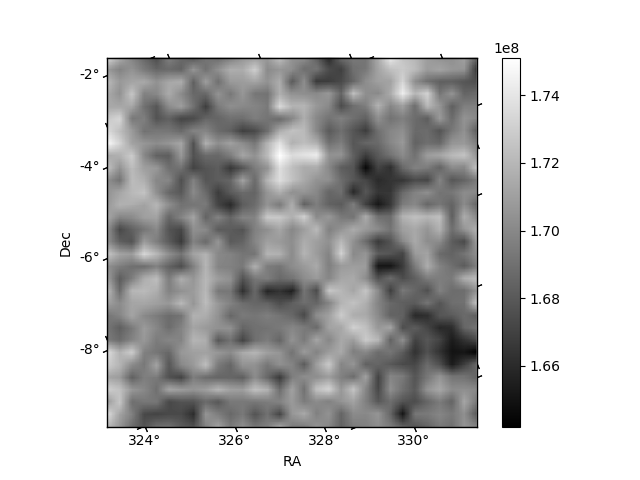
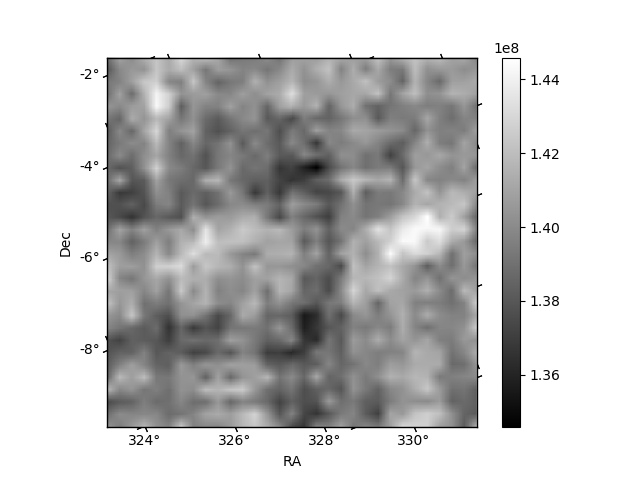
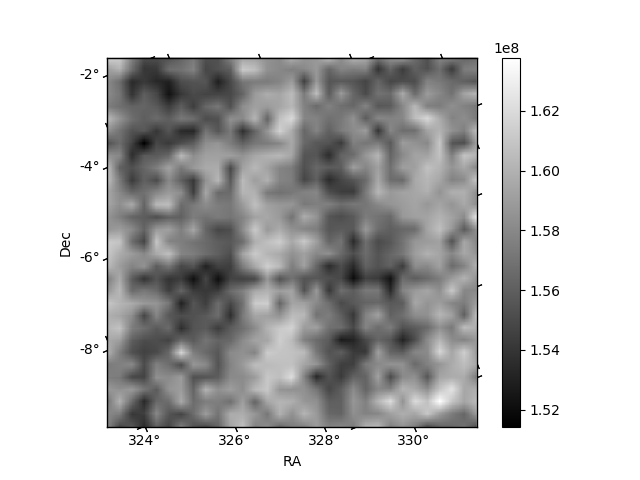
Histogram calculated using DETX and DETY for each event in the final _common_clean file
| Quadrant A | 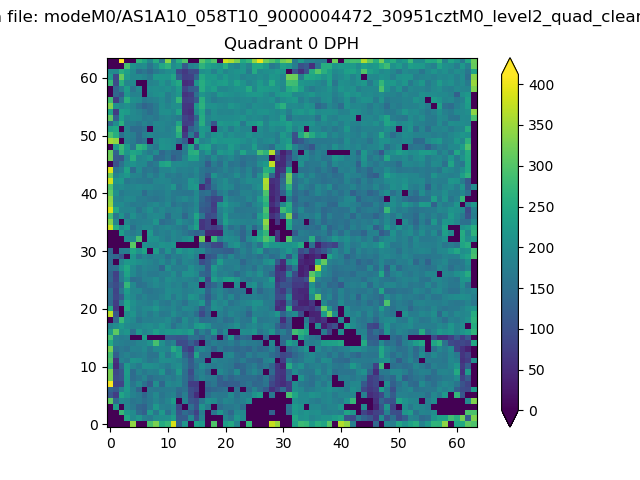 |
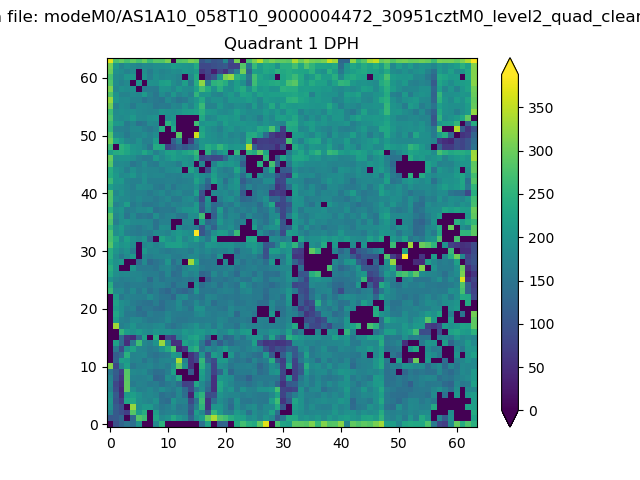 |
Quadrant B |
|---|---|---|---|
| Quadrant D | 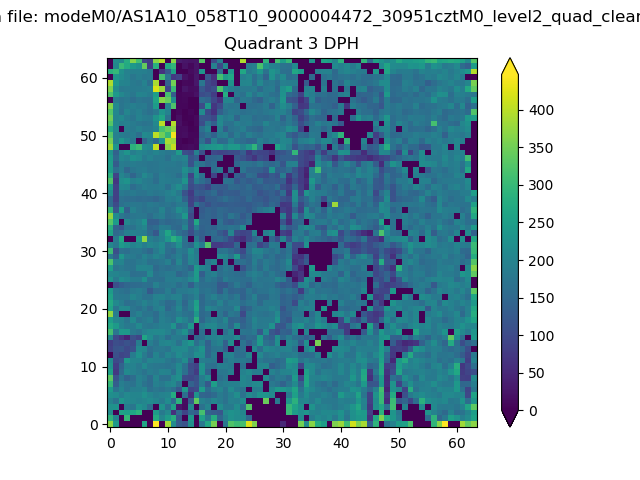 |
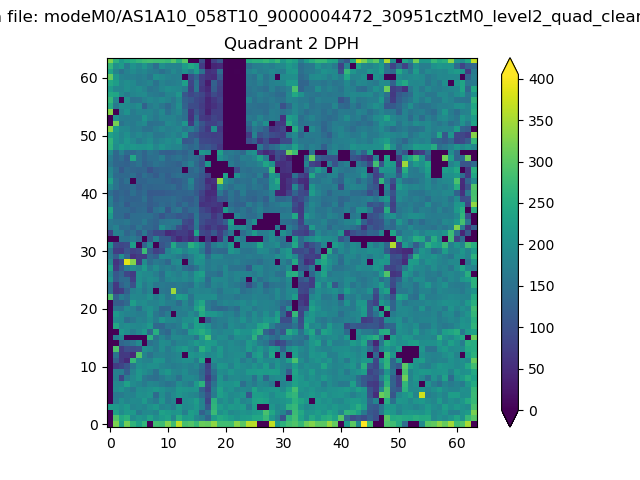 |
Quadrant C |
| Plot type | Count rate plots | Images |
|---|---|---|
| Comparison with Poisson distribution Blue bars denote a histogram of data divided into 1 sec bins. Red curve is a Poisson curve with rate = median count rate of data. |
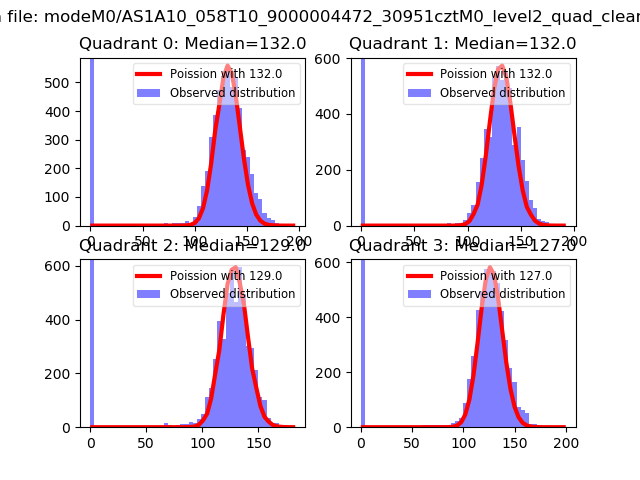 |
 |
| Quadrant-wise count rates Data is divided into 100 sec bins |
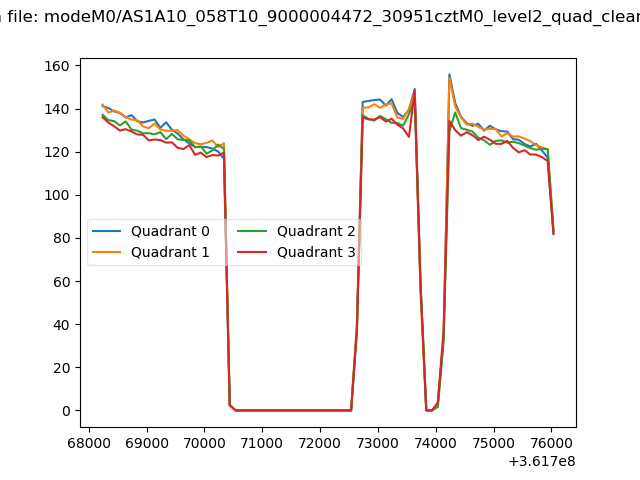 |
|
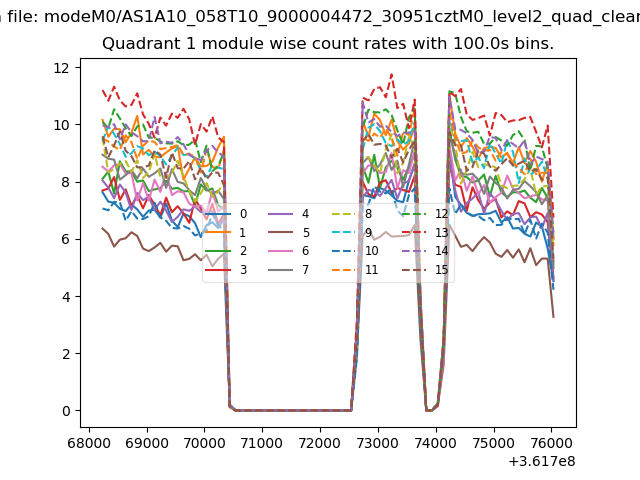
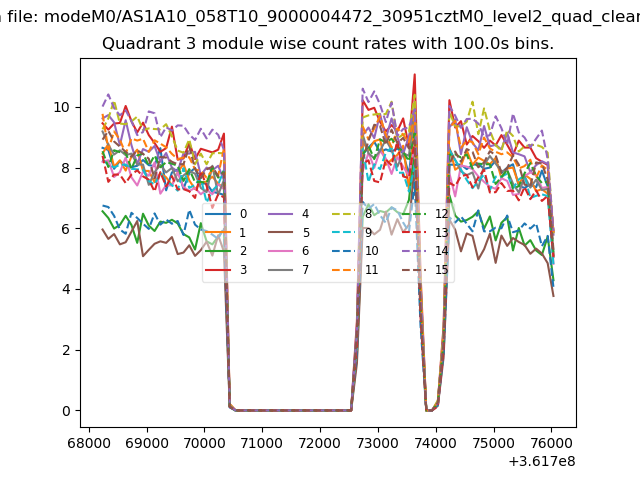
| Module-wise count rates for Quadrant A Data is divided into 100 sec bins |
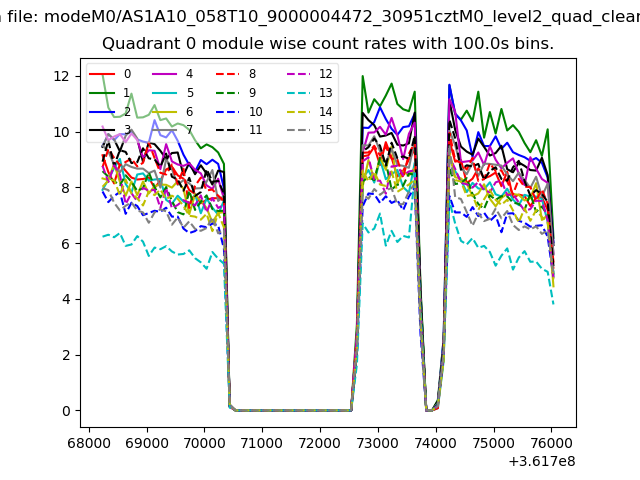 |
 |
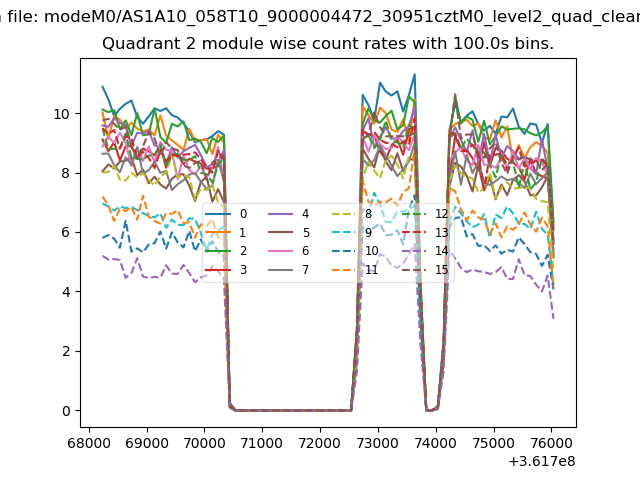
| Module-wise count rates for Quadrant B Data is divided into 100 sec bins |
 |
 |
| Module-wise count rates for Quadrant C Data is divided into 100 sec bins |
 |
 |
| Module-wise count rates for Quadrant D Data is divided into 100 sec bins |
 |
 |
| Parameter | Plot |
|---|---|
| CZT HV Monitor | 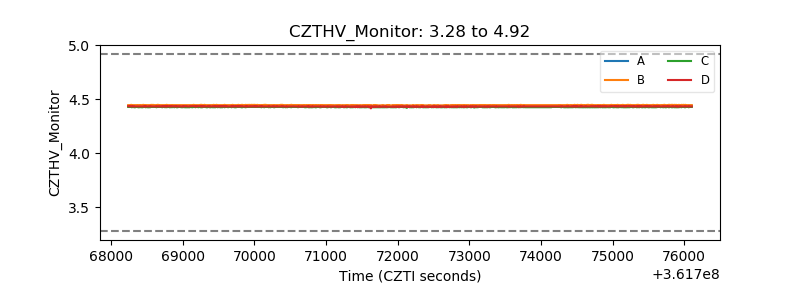 |
| D_VDD | 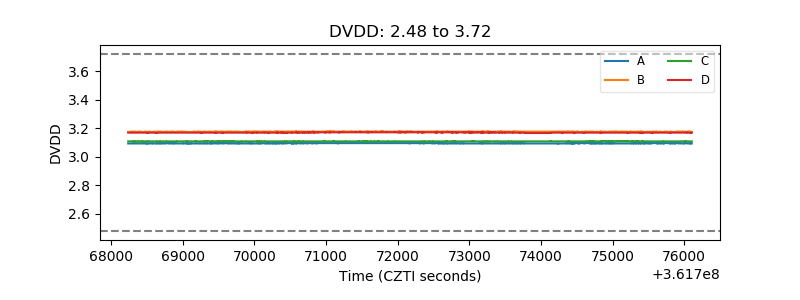 |
| Temperature 1 | 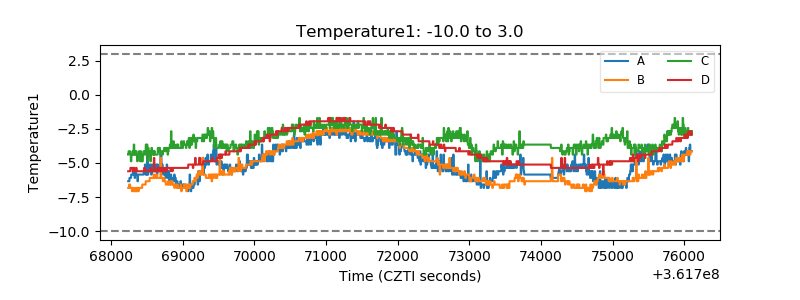 |
| Veto HV Monitor | 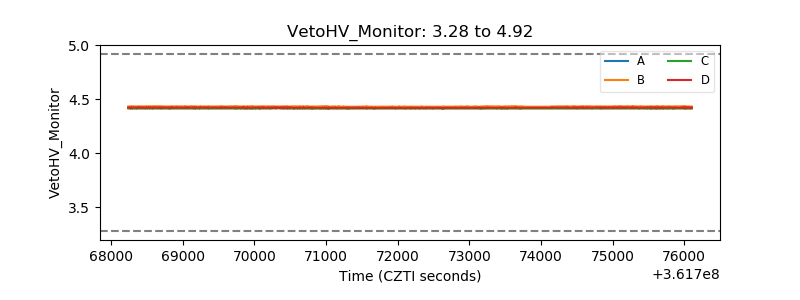 |
| Veto LLD | 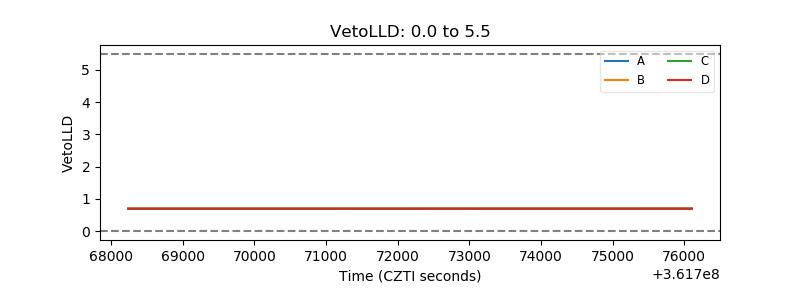 |
| Alpha Counter | 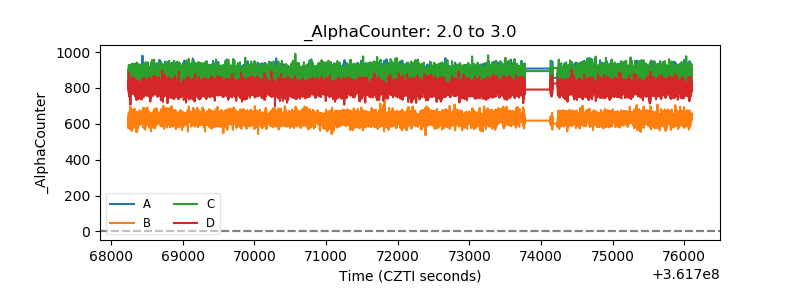 |
| _CPM_Rate | 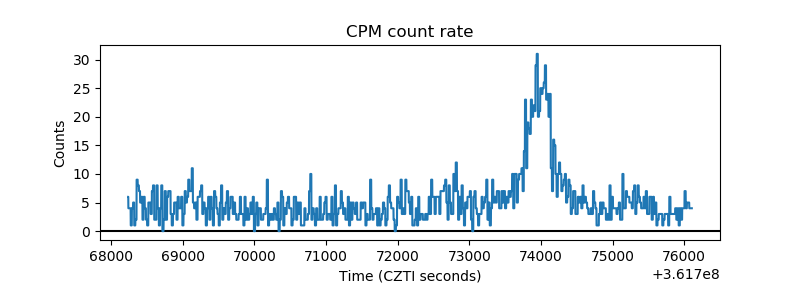 |
| CZT Counter | 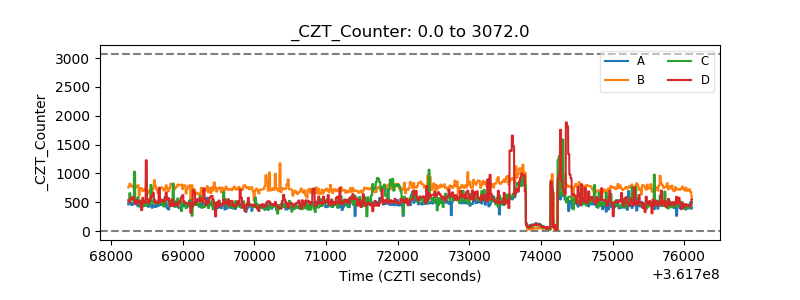 |
| +2.5 Volts monitor |  |
| +5 Volts monitor |  |
| _ROLL_ROT | 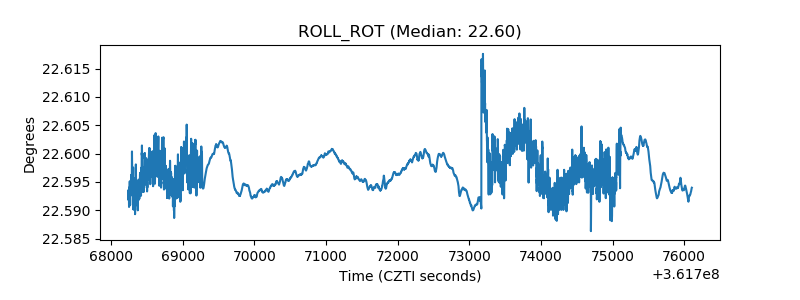 |
| _Roll_DEC | 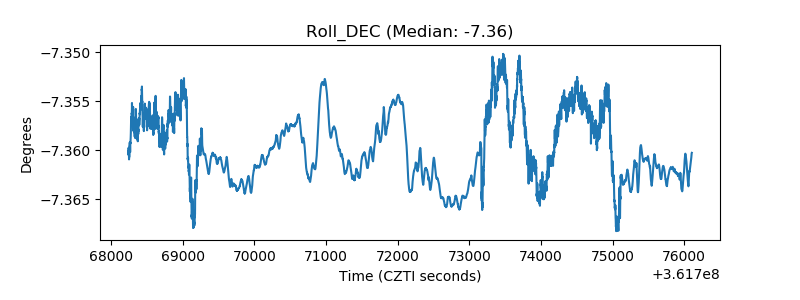 |
| _Roll_RA | 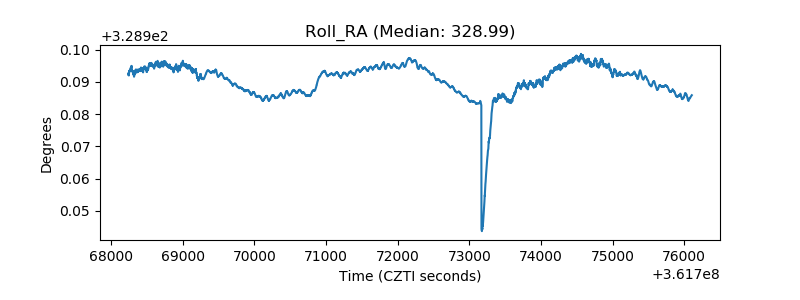 |
| Veto Counter | 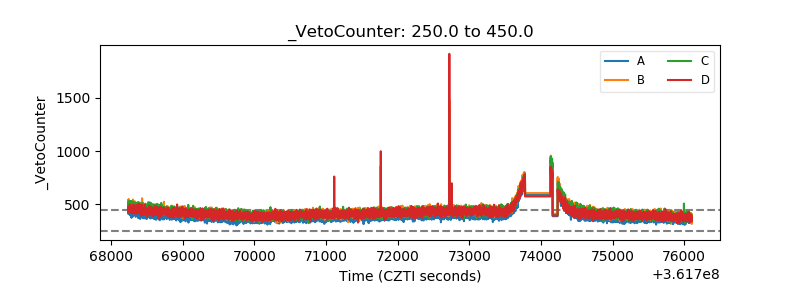 |