| Param | Original file | Final file |
|---|---|---|
| Filename | modeM0/AS1A10_058T10_9000004472_30952cztM0_level2.evt | modeM0/AS1A10_058T10_9000004472_30952cztM0_level2_quad_clean.evt |
| Size (bytes) | 665,542,080 | 113,584,320 |
| Size | 634.7 MB | 108.3 MB |
| Events in quadrant A | 3,868,388 | 735,429 |
| Events in quadrant B | 6,232,596 | 736,275 |
| Events in quadrant C | 4,701,999 | 710,090 |
| Events in quadrant D | 4,807,731 | 698,080 |
| Mode M0 | |||
|---|---|---|---|
| Quadrant | BADHDUFLAG | Total packets | Discarded packets |
| A | 0 | 16669 | 0 |
| B | 0 | 24554 | 0 |
| C | 0 | 19212 | 0 |
| D | 0 | 19231 | 0 |
| Mode SS | |||
|---|---|---|---|
| Quadrant | BADHDUFLAG | Total packets | Discarded packets |
| A | 0 | 160 | 0 |
| B | 0 | 160 | 0 |
| C | 0 | 160 | 0 |
| D | 0 | 160 | 0 |
| Quadrant | Total seconds | Saturated seconds | Saturation percentage |
|---|---|---|---|
| A | 8057 | 228 | 2.829837% |
| B | 8058 | 329 | 4.082899% |
| C | 8058 | 339 | 4.206999% |
| D | 8058 | 284 | 3.524448% |
Noise dominated data is calculated using 1-second bins in cleaned event files. If a bin has >2000 counts, and if more than 50% of those come from <1% of pixels, then it is considered to be noise-dominated and hence unusable.
| Quadrant | # 1 sec bins | Bins with >0 counts | Bins with >2000 counts | High rate bins dominated by noise | Noise dominated (total time) | Noise dominated (detector-on time) | Marked lightcurve |
|---|---|---|---|---|---|---|---|
| A | 8057 | 8057 | 0 | 0 | 0.00% | 0.00% | 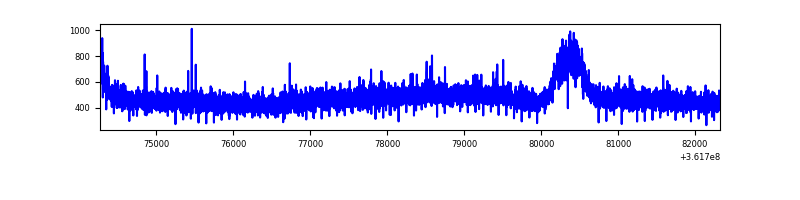 |
| B | 8058 | 8058 | 2 | 2 | 0.02% | 0.02% | 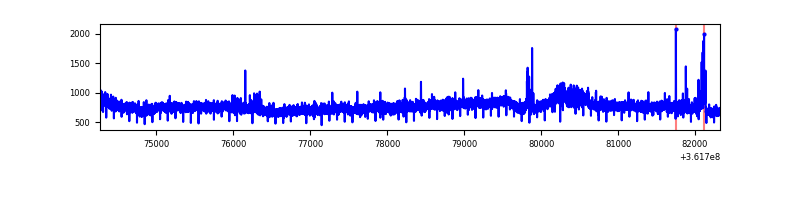 |
| C | 8058 | 8058 | 17 | 17 | 0.21% | 0.21% | 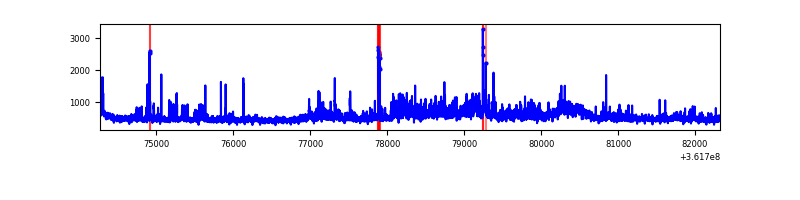 |
| D | 8058 | 8058 | 129 | 129 | 1.60% | 1.60% | 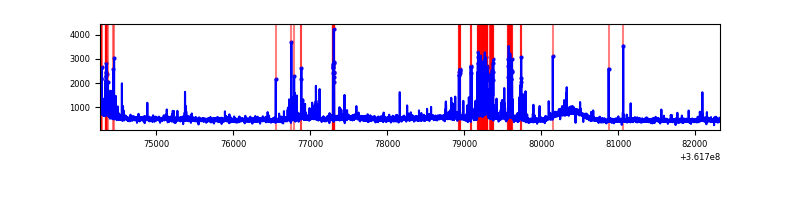 |
Top three noisy pixels from each quadrant. If the there are fewer than three noisy pixels in the level2.evt file, extra rows are filled as -1
| Pixel properties | Quadrant properties | ||||||
|---|---|---|---|---|---|---|---|
| Quadrant | DetID | PixID | Counts | Sigma | Mean | Median | Sigma |
| A | 13 | 254 | 14141 | 65.18 | 999 | 975 | 202.0 |
| A | 3 | 137 | 10307 | 46.2 | 999 | 975 | 202.0 |
| A | 0 | 226 | 8358 | 36.55 | 999 | 975 | 202.0 |
| B | 6 | 159 | 2275295 | 11909.58 | 980 | 954 | 191.0 |
| B | 0 | 190 | 53988 | 277.71 | 980 | 954 | 191.0 |
| B | 12 | 111 | 23977 | 120.56 | 980 | 954 | 191.0 |
| C | 3 | 233 | 564348 | 2505.81 | 955 | 960 | 224.8 |
| C | 0 | 10 | 241197 | 1068.52 | 955 | 960 | 224.8 |
| C | 14 | 238 | 155337 | 686.63 | 955 | 960 | 224.8 |
| D | 15 | 47 | 517097 | 2111.66 | 960 | 937 | 244.4 |
| D | 8 | 195 | 414630 | 1692.45 | 960 | 937 | 244.4 |
| D | 2 | 250 | 126244 | 512.64 | 960 | 937 | 244.4 |
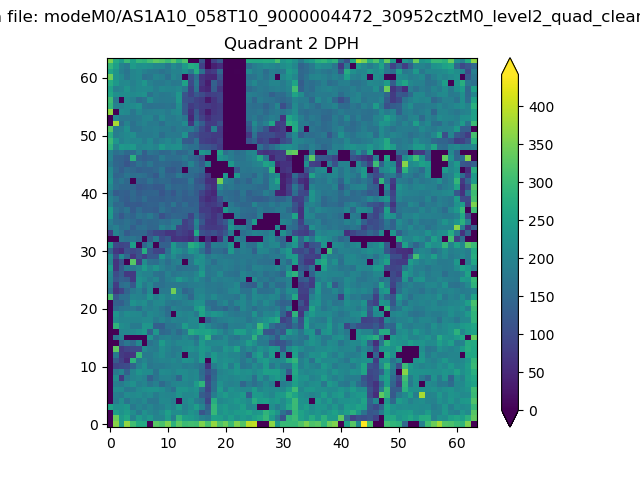
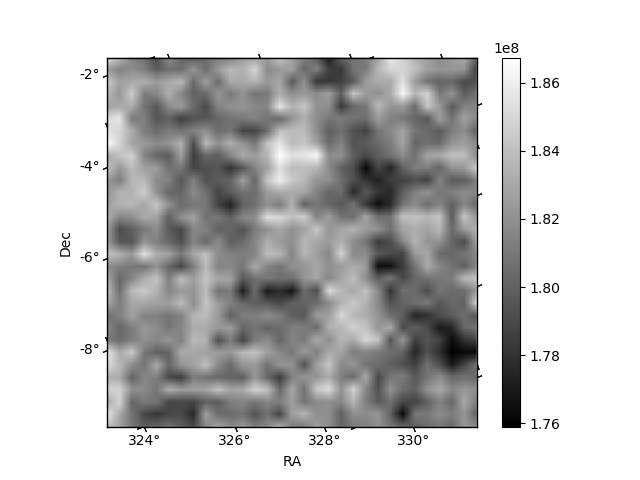
Histogram calculated using DETX and DETY for each event in the final _common_clean file
| Quadrant A | 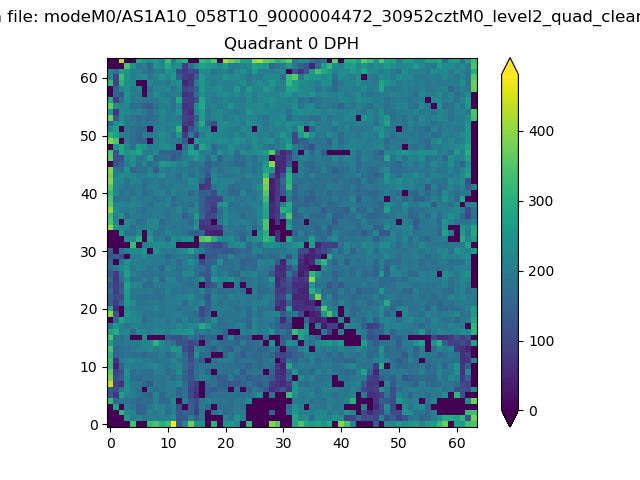 |
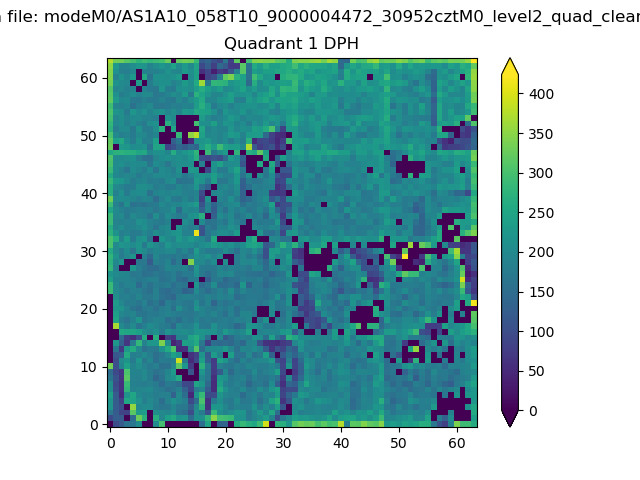 |
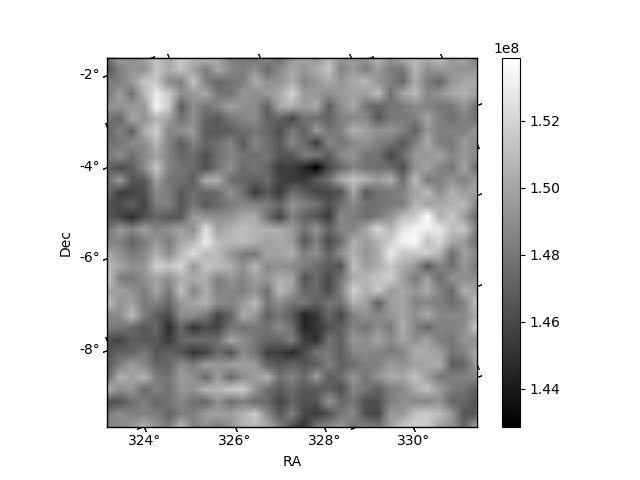
Quadrant B |
|---|---|---|---|
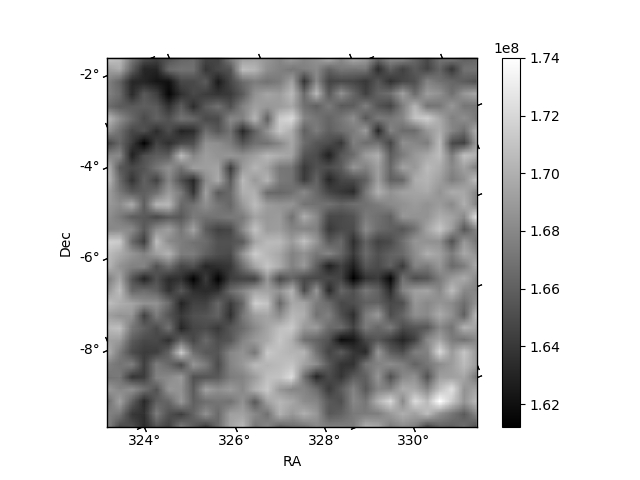
| Quadrant D | 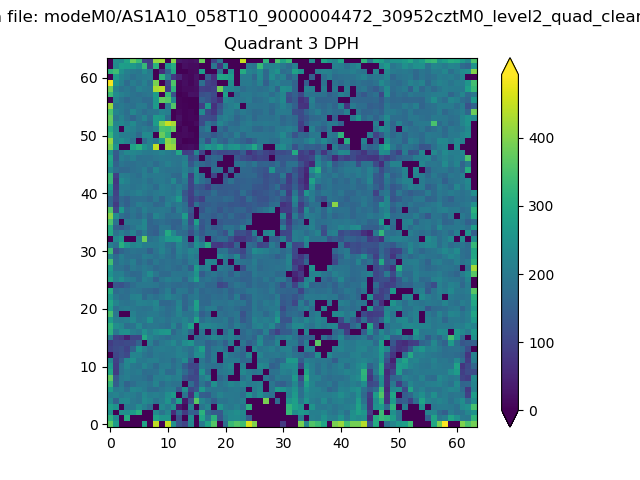 |
 |
Quadrant C |
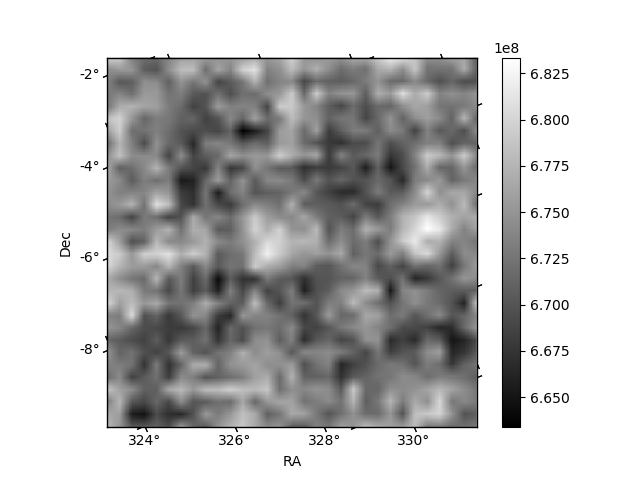
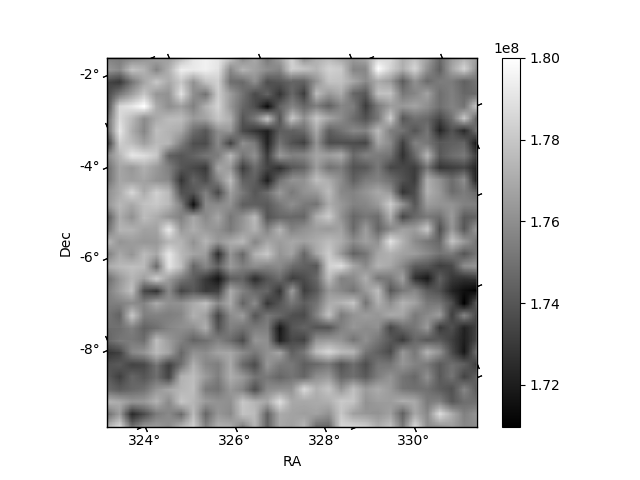
| Plot type | Count rate plots | Images |
|---|---|---|
| Comparison with Poisson distribution Blue bars denote a histogram of data divided into 1 sec bins. Red curve is a Poisson curve with rate = median count rate of data. |
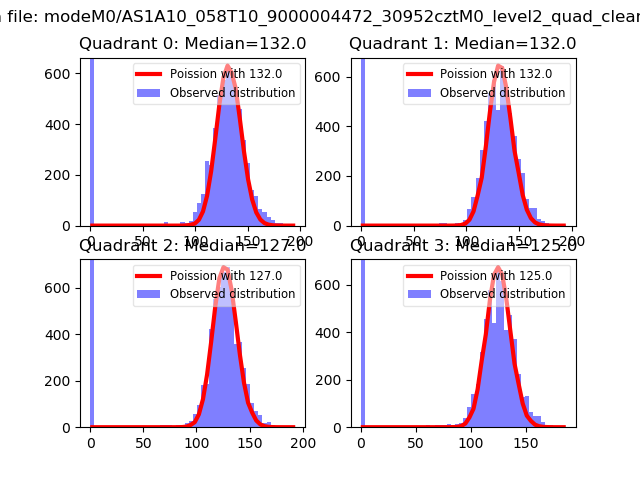 |
 |
| Quadrant-wise count rates Data is divided into 100 sec bins |
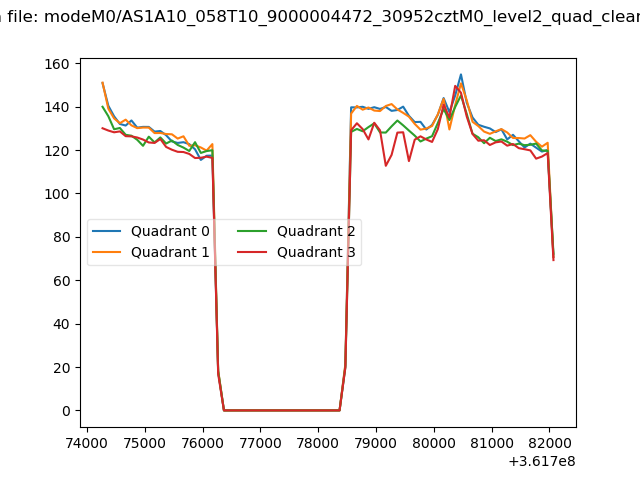 |
|
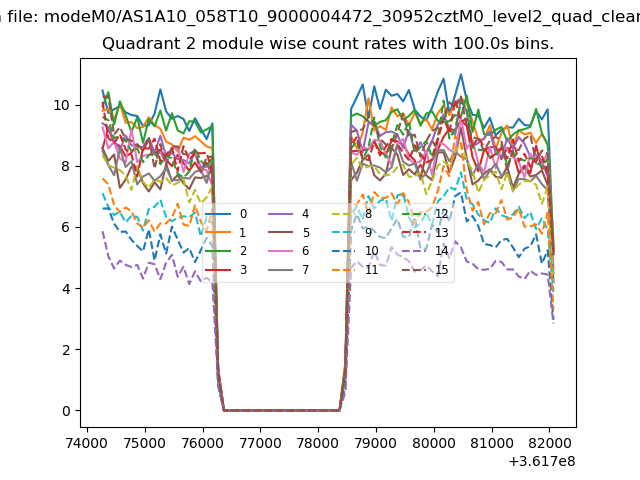
| Module-wise count rates for Quadrant A Data is divided into 100 sec bins |
 |
 |
| Module-wise count rates for Quadrant B Data is divided into 100 sec bins |
 |
 |
| Module-wise count rates for Quadrant C Data is divided into 100 sec bins |
 |
 |
| Module-wise count rates for Quadrant D Data is divided into 100 sec bins |
 |
 |
| Parameter | Plot |
|---|---|
| CZT HV Monitor | 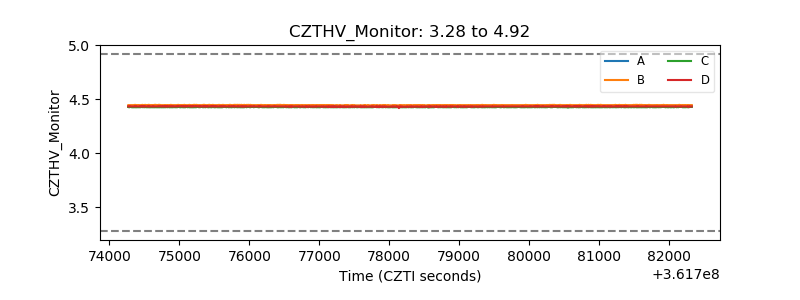 |
| D_VDD | 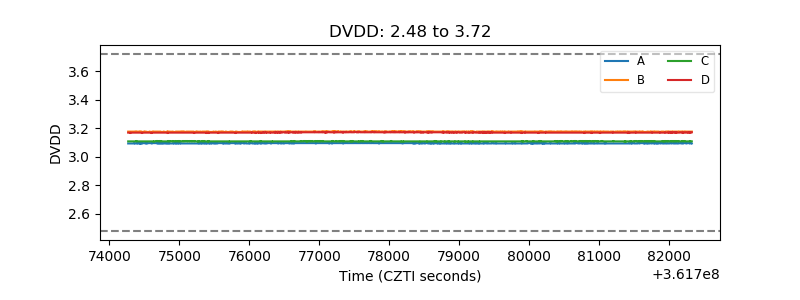 |
| Temperature 1 | 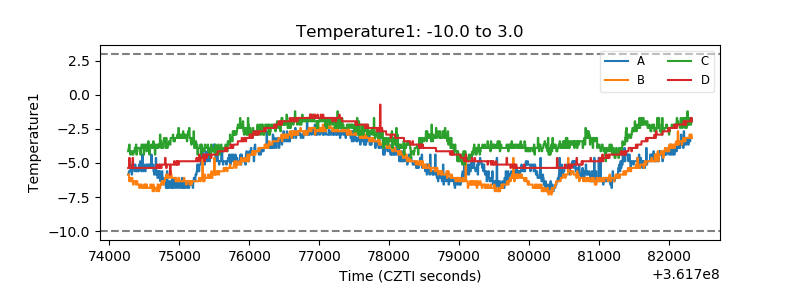 |
| Veto HV Monitor | 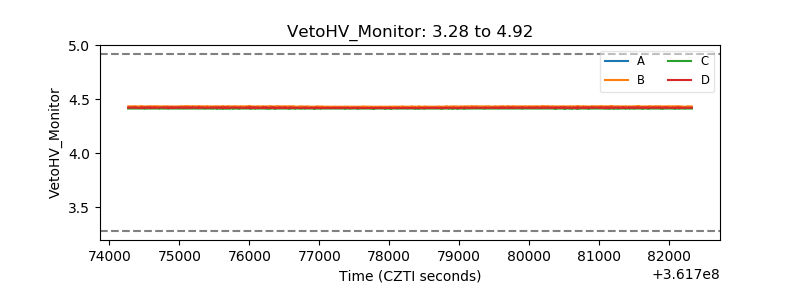 |
| Veto LLD | 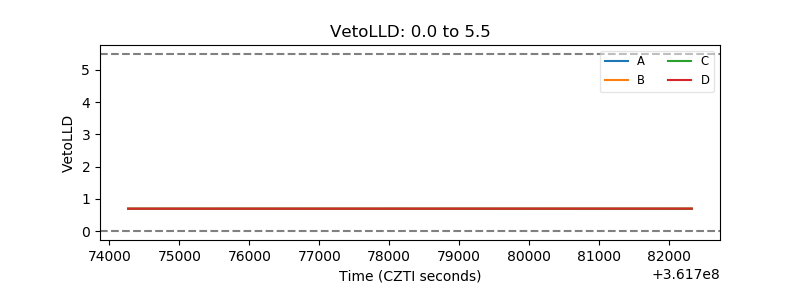 |
| Alpha Counter | 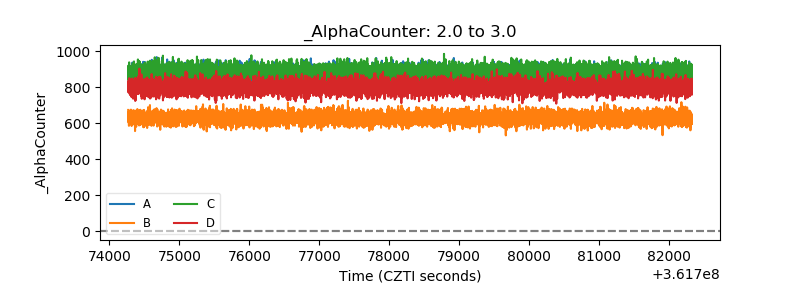 |
| _CPM_Rate | 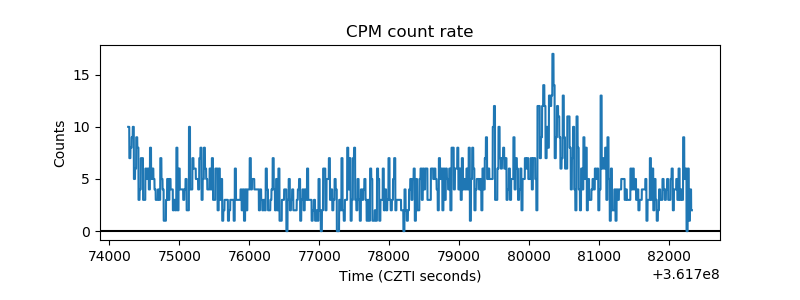 |
| CZT Counter | 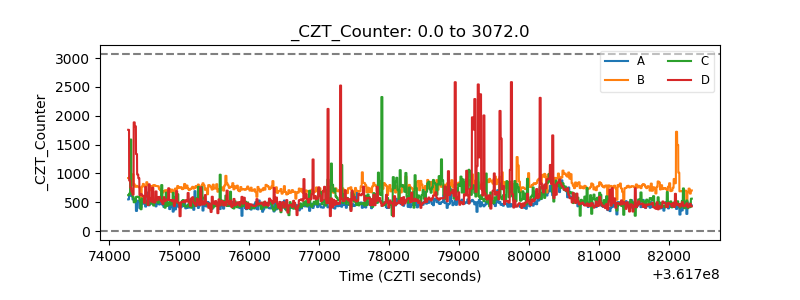 |
| +2.5 Volts monitor | 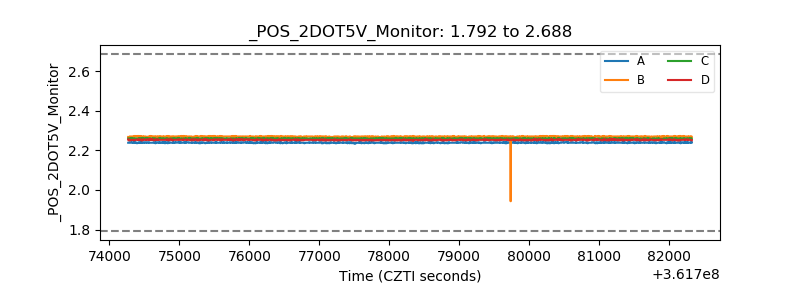 |
| +5 Volts monitor |  |
| _ROLL_ROT |  |
| _Roll_DEC |  |
| _Roll_RA | 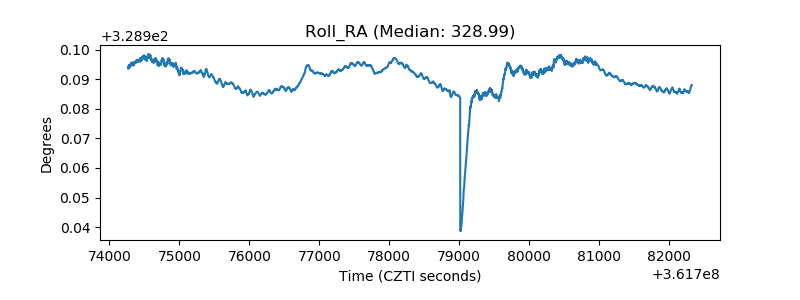 |
| Veto Counter | 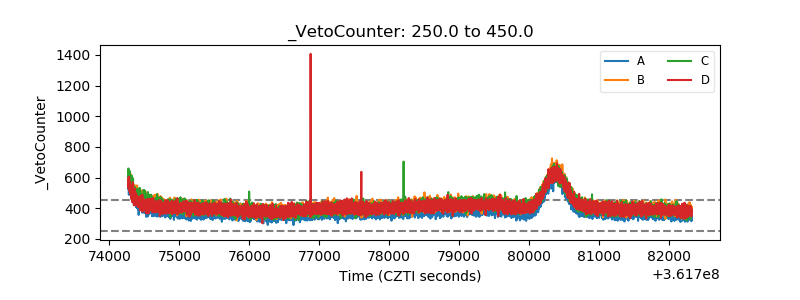 |