| Param | Original file | Final file |
|---|---|---|
| Filename | modeM0/AS1A10_058T10_9000004472_30953cztM0_level2.evt | modeM0/AS1A10_058T10_9000004472_30953cztM0_level2_quad_clean.evt |
| Size (bytes) | 377,236,800 | 50,906,880 |
| Size | 359.8 MB | 48.5 MB |
| Events in quadrant A | 2,139,142 | 310,278 |
| Events in quadrant B | 3,506,814 | 310,386 |
| Events in quadrant C | 2,462,762 | 298,804 |
| Events in quadrant D | 3,000,169 | 295,434 |
| Mode M0 | |||
|---|---|---|---|
| Quadrant | BADHDUFLAG | Total packets | Discarded packets |
| A | 0 | 9307 | 0 |
| B | 0 | 14000 | 0 |
| C | 0 | 10037 | 0 |
| D | 0 | 11866 | 0 |
| Mode SS | |||
|---|---|---|---|
| Quadrant | BADHDUFLAG | Total packets | Discarded packets |
| A | 0 | 92 | 0 |
| B | 0 | 92 | 0 |
| C | 0 | 92 | 0 |
| D | 0 | 92 | 0 |
| Quadrant | Total seconds | Saturated seconds | Saturation percentage |
|---|---|---|---|
| A | 4644 | 7 | 0.150732% |
| B | 4645 | 15 | 0.322928% |
| C | 4645 | 41 | 0.882670% |
| D | 4645 | 173 | 3.724435% |
Noise dominated data is calculated using 1-second bins in cleaned event files. If a bin has >2000 counts, and if more than 50% of those come from <1% of pixels, then it is considered to be noise-dominated and hence unusable.
| Quadrant | # 1 sec bins | Bins with >0 counts | Bins with >2000 counts | High rate bins dominated by noise | Noise dominated (total time) | Noise dominated (detector-on time) | Marked lightcurve |
|---|---|---|---|---|---|---|---|
| A | 4644 | 4644 | 0 | 0 | 0.00% | 0.00% | 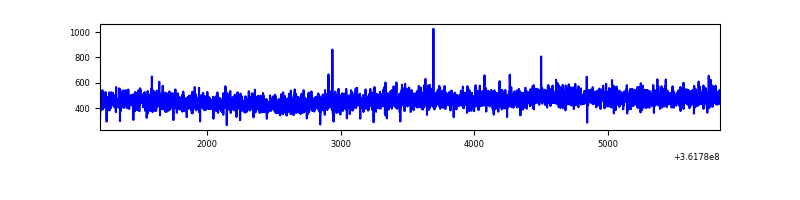 |
| B | 4645 | 4645 | 2 | 2 | 0.04% | 0.04% | 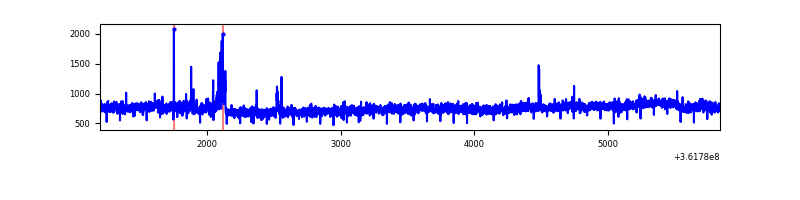 |
| C | 4645 | 4645 | 0 | 0 | 0.00% | 0.00% | 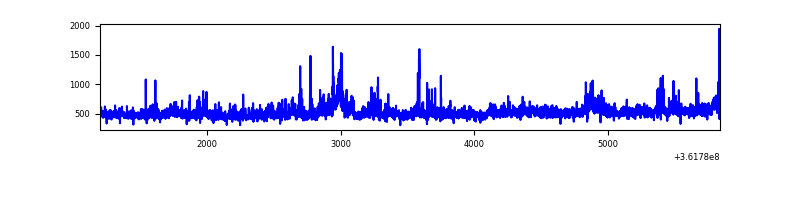 |
| D | 4645 | 4645 | 160 | 160 | 3.44% | 3.44% | 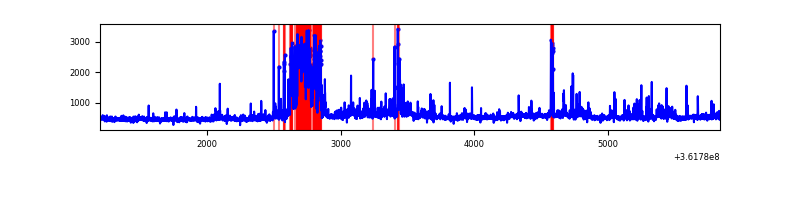 |
Top three noisy pixels from each quadrant. If the there are fewer than three noisy pixels in the level2.evt file, extra rows are filled as -1
| Pixel properties | Quadrant properties | ||||||
|---|---|---|---|---|---|---|---|
| Quadrant | DetID | PixID | Counts | Sigma | Mean | Median | Sigma |
| A | 13 | 254 | 8072 | 67.4 | 552 | 540 | 111.8 |
| A | 3 | 137 | 5727 | 46.42 | 552 | 540 | 111.8 |
| A | 11 | 47 | 4830 | 38.39 | 552 | 540 | 111.8 |
| B | 6 | 159 | 1289196 | 11961.99 | 545 | 529 | 107.7 |
| B | 0 | 190 | 54334 | 499.44 | 545 | 529 | 107.7 |
| B | 12 | 111 | 13176 | 117.39 | 545 | 529 | 107.7 |
| C | 3 | 233 | 203275 | 1599.36 | 530 | 534 | 126.8 |
| C | 14 | 238 | 89809 | 704.26 | 530 | 534 | 126.8 |
| C | 0 | 10 | 85129 | 667.34 | 530 | 534 | 126.8 |
| D | 2 | 250 | 454396 | 3568.45 | 528 | 514 | 127.2 |
| D | 8 | 195 | 305983 | 2401.62 | 528 | 514 | 127.2 |
| D | 15 | 47 | 154547 | 1211.02 | 528 | 514 | 127.2 |
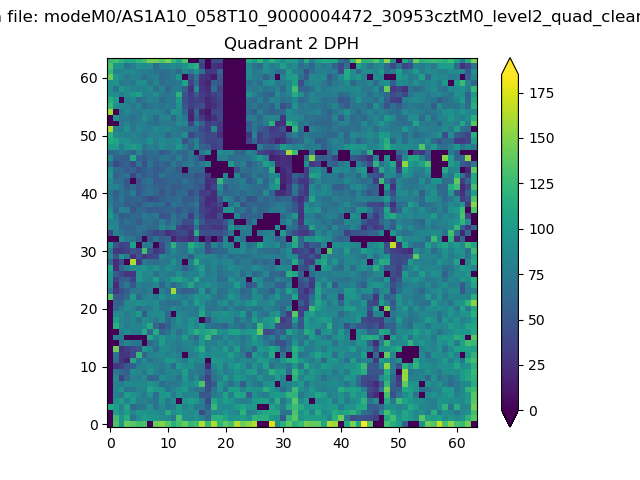
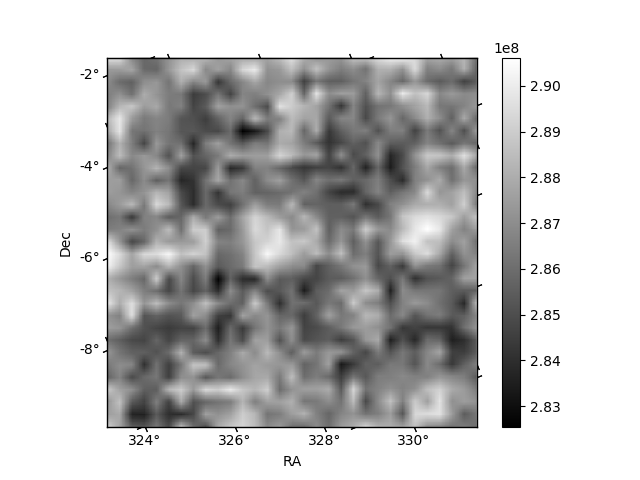
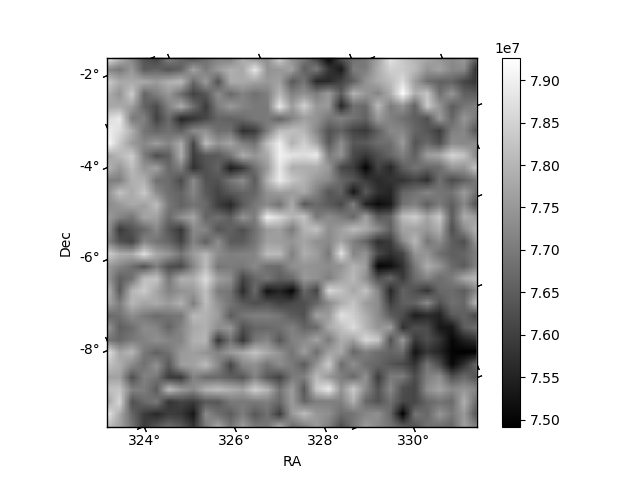
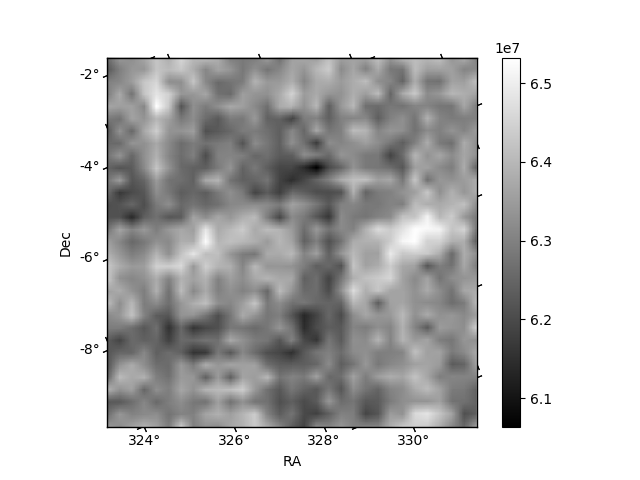
Histogram calculated using DETX and DETY for each event in the final _common_clean file
| Quadrant A | 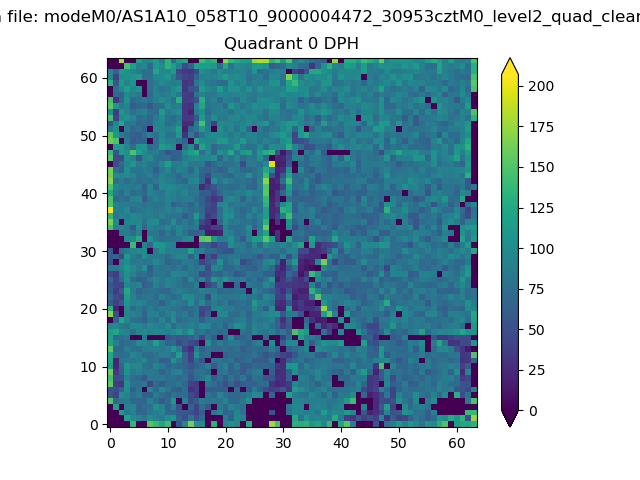 |
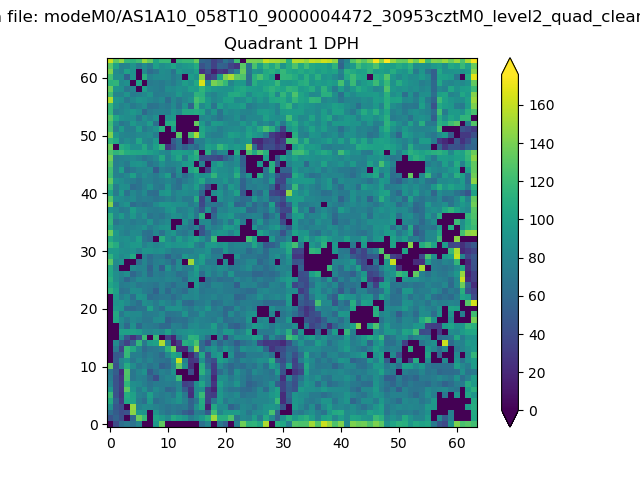 |
Quadrant B |
|---|---|---|---|
| Quadrant D | 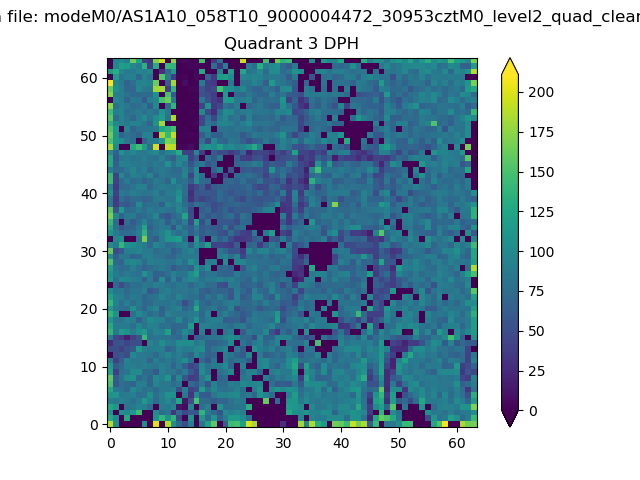 |
 |
Quadrant C |
| Plot type | Count rate plots | Images |
|---|---|---|
| Comparison with Poisson distribution Blue bars denote a histogram of data divided into 1 sec bins. Red curve is a Poisson curve with rate = median count rate of data. |
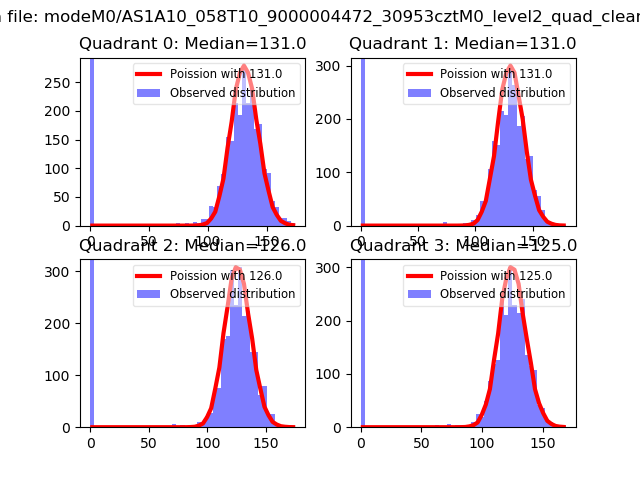 |
 |
| Quadrant-wise count rates Data is divided into 100 sec bins |
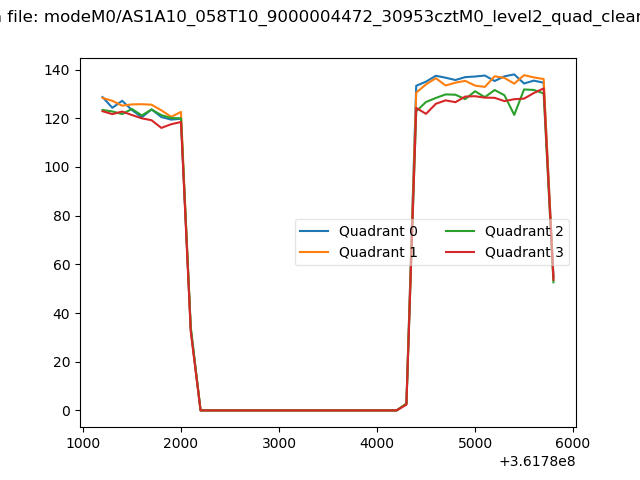 |
|
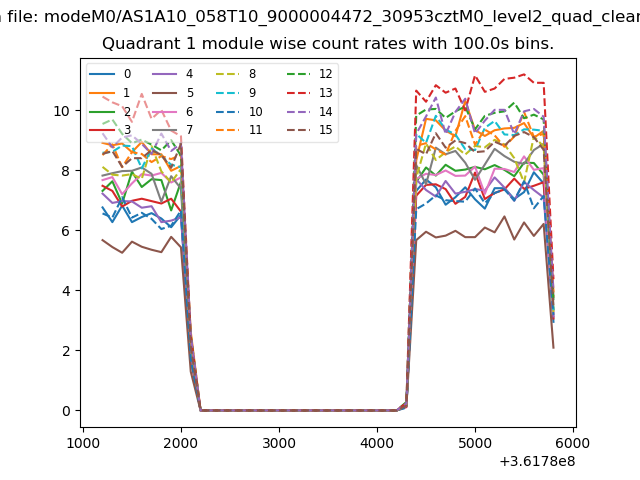
| Module-wise count rates for Quadrant A Data is divided into 100 sec bins |
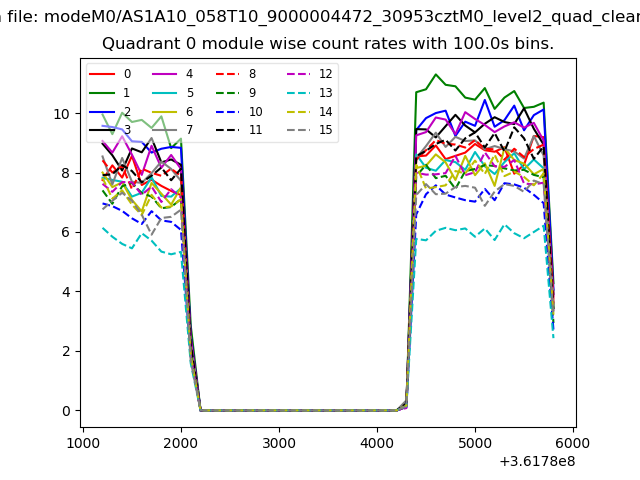 |
 |
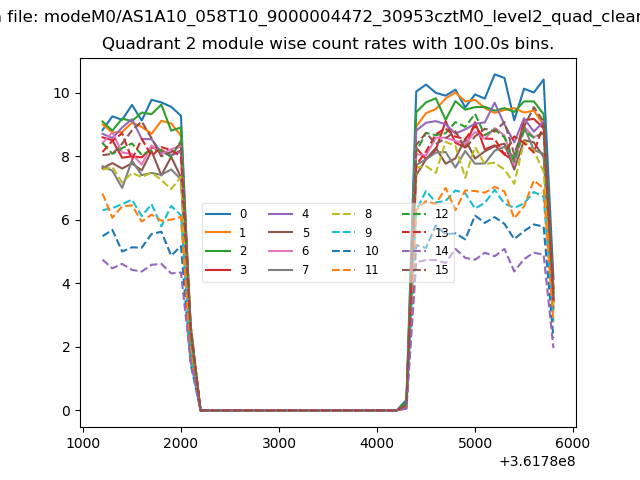
| Module-wise count rates for Quadrant B Data is divided into 100 sec bins |
 |
 |
| Module-wise count rates for Quadrant C Data is divided into 100 sec bins |
 |
 |
| Module-wise count rates for Quadrant D Data is divided into 100 sec bins |
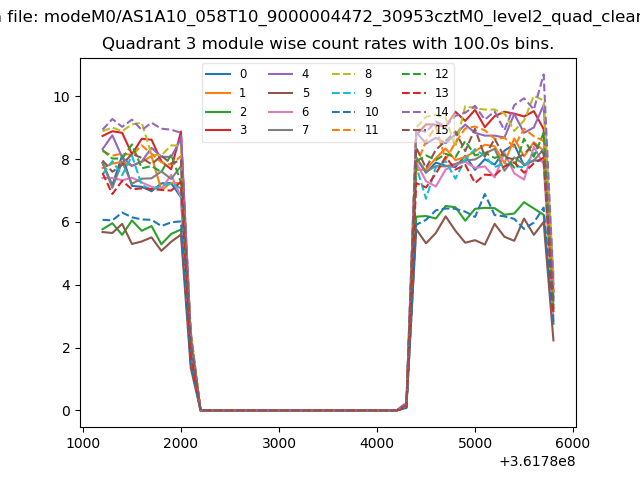 |
 |
| Parameter | Plot |
|---|---|
| CZT HV Monitor | 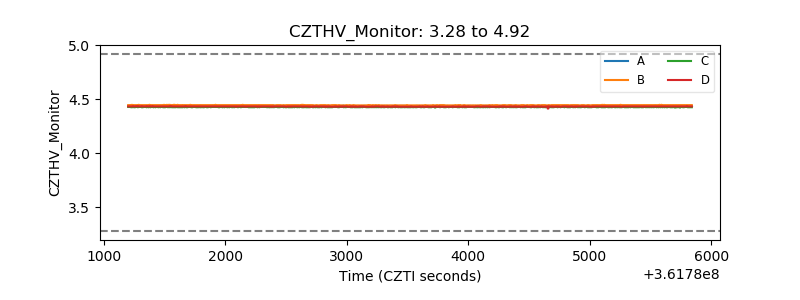 |
| D_VDD | 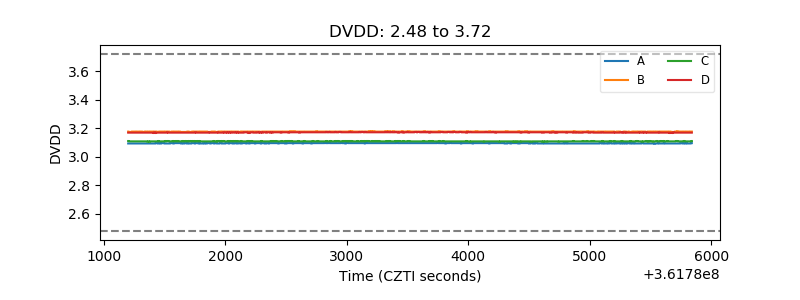 |
| Temperature 1 | 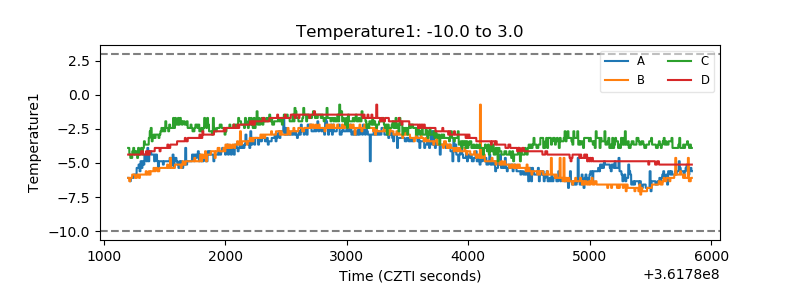 |
| Veto HV Monitor | 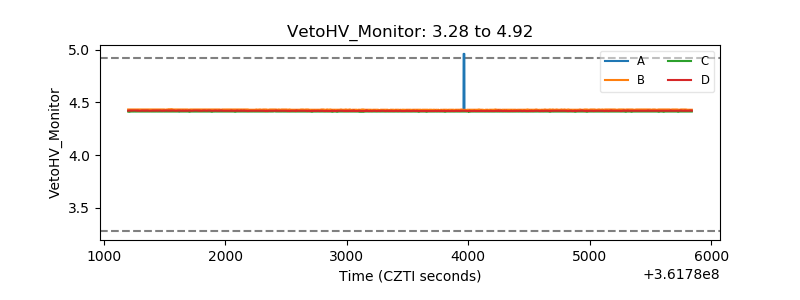 |
| Veto LLD | 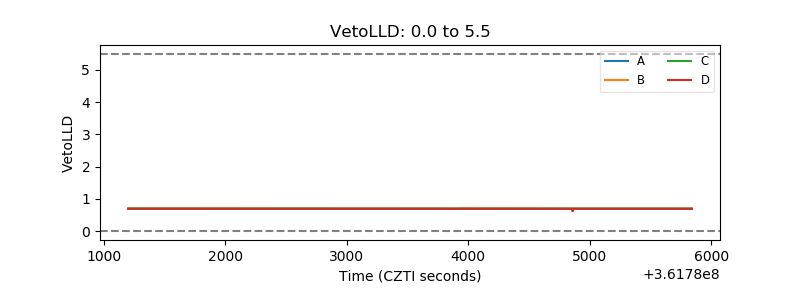 |
| Alpha Counter | 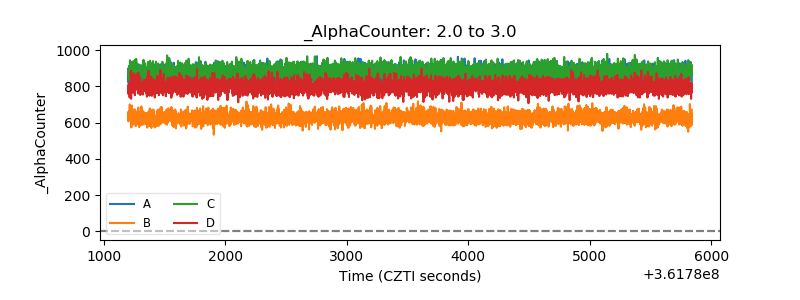 |
| _CPM_Rate | 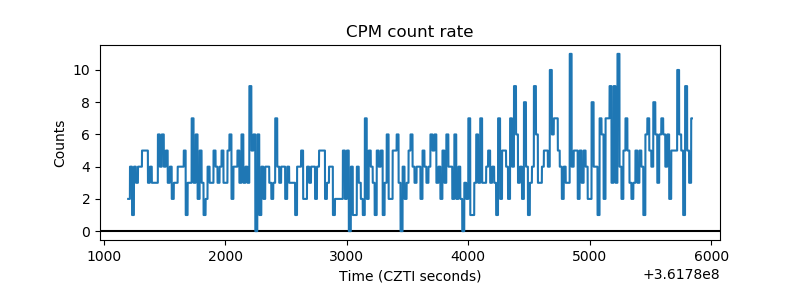 |
| CZT Counter | 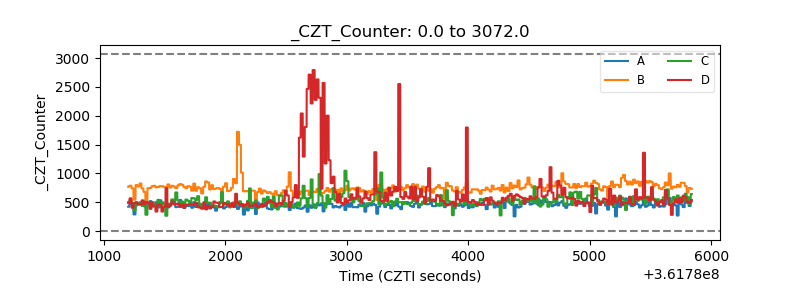 |
| +2.5 Volts monitor |  |
| +5 Volts monitor |  |
| _ROLL_ROT | 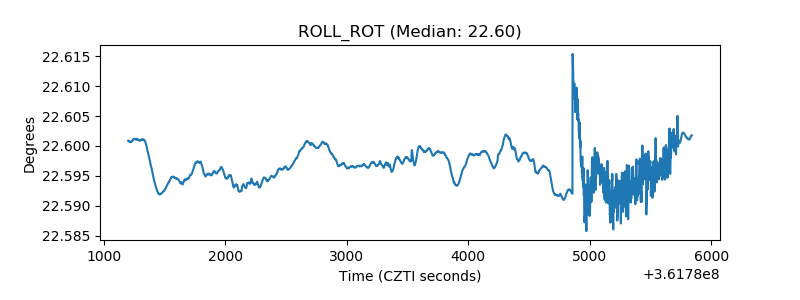 |
| _Roll_DEC | 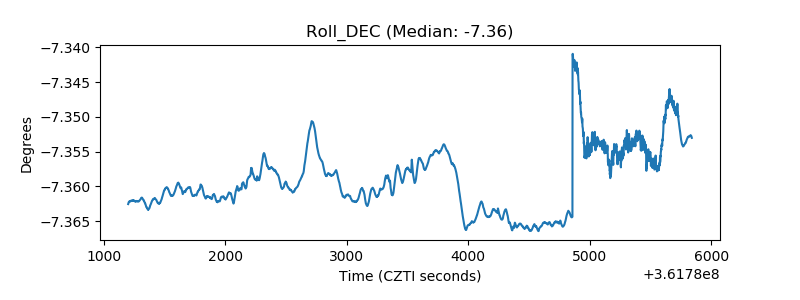 |
| _Roll_RA | 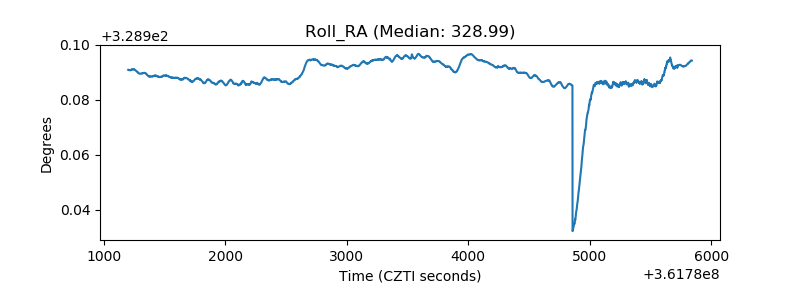 |
| Veto Counter | 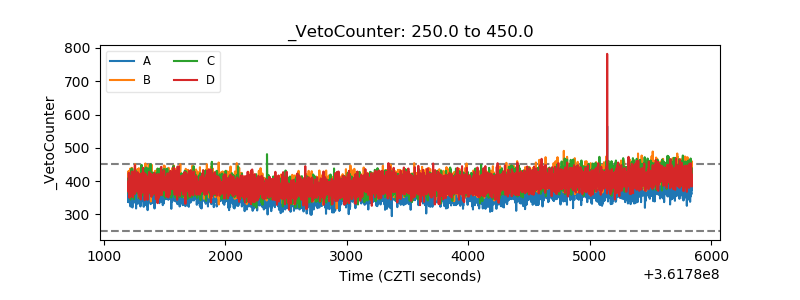 |