| Param | Original file | Final file |
|---|---|---|
| Filename | modeM0/AS1A10_058T10_9000004472_30957cztM0_level2.evt | modeM0/AS1A10_058T10_9000004472_30957cztM0_level2_quad_clean.evt |
| Size (bytes) | 1,825,358,400 | 280,779,840 |
| Size | 1.7 GB | 267.8 MB |
| Events in quadrant A | 10,769,251 | 1,779,742 |
| Events in quadrant B | 17,226,834 | 1,776,834 |
| Events in quadrant C | 12,366,312 | 1,716,255 |
| Events in quadrant D | 13,414,878 | 1,694,767 |
| Mode M0 | |||
|---|---|---|---|
| Quadrant | BADHDUFLAG | Total packets | Discarded packets |
| A | 0 | 46052 | 3 |
| B | 0 | 67986 | 3 |
| C | 0 | 50593 | 3 |
| D | 0 | 53873 | 3 |
| Mode M9 | |||
|---|---|---|---|
| Quadrant | BADHDUFLAG | Total packets | Discarded packets |
| A | 0 | 12 | 0 |
| B | 0 | 12 | 0 |
| C | 0 | 12 | 0 |
| D | 0 | 12 | 0 |
| Mode SS | |||
|---|---|---|---|
| Quadrant | BADHDUFLAG | Total packets | Discarded packets |
| A | 0 | 452 | 0 |
| B | 0 | 452 | 0 |
| C | 0 | 452 | 0 |
| D | 0 | 452 | 0 |
| Quadrant | Total seconds | Saturated seconds | Saturation percentage |
|---|---|---|---|
| A | 22310 | 398 | 1.783953% |
| B | 22310 | 642 | 2.877633% |
| C | 22310 | 864 | 3.872703% |
| D | 22310 | 631 | 2.828328% |
Noise dominated data is calculated using 1-second bins in cleaned event files. If a bin has >2000 counts, and if more than 50% of those come from <1% of pixels, then it is considered to be noise-dominated and hence unusable.
| Quadrant | # 1 sec bins | Bins with >0 counts | Bins with >2000 counts | High rate bins dominated by noise | Noise dominated (total time) | Noise dominated (detector-on time) | Marked lightcurve |
|---|---|---|---|---|---|---|---|
| A | 23645 | 22312 | 0 | 0 | 0.00% | 0.00% | 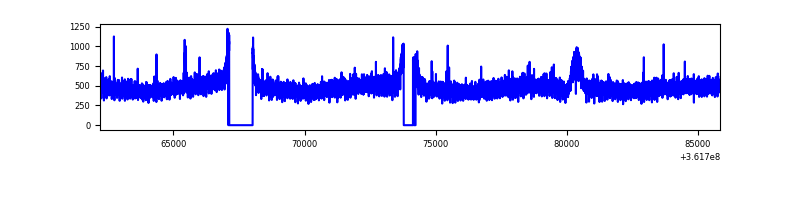 |
| B | 23645 | 22310 | 4 | 4 | 0.02% | 0.02% | 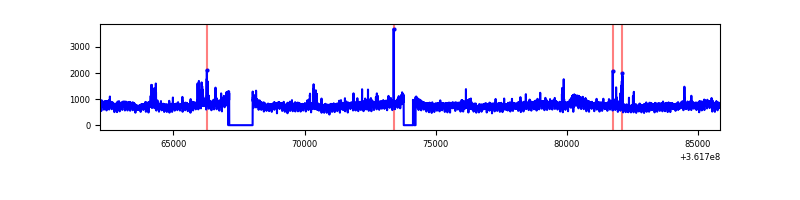 |
| C | 23645 | 22311 | 28 | 28 | 0.12% | 0.13% | 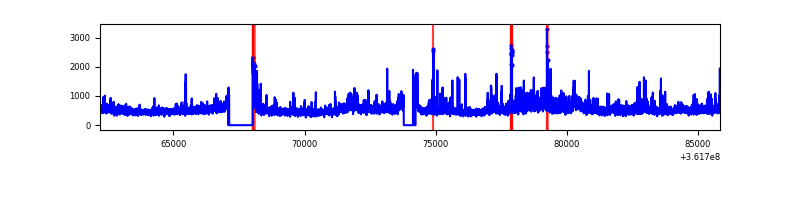 |
| D | 23645 | 22313 | 328 | 328 | 1.39% | 1.47% | 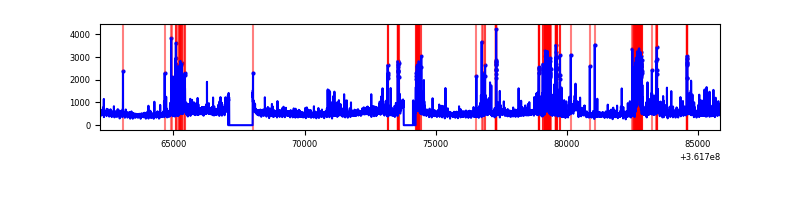 |
Top three noisy pixels from each quadrant. If the there are fewer than three noisy pixels in the level2.evt file, extra rows are filled as -1
| Pixel properties | Quadrant properties | ||||||
|---|---|---|---|---|---|---|---|
| Quadrant | DetID | PixID | Counts | Sigma | Mean | Median | Sigma |
| A | 13 | 254 | 39417 | 65.77 | 2784 | 2721 | 558.0 |
| A | 3 | 137 | 28335 | 45.91 | 2784 | 2721 | 558.0 |
| A | 3 | 243 | 26178 | 42.04 | 2784 | 2721 | 558.0 |
| B | 6 | 159 | 6117609 | 11586.83 | 2741 | 2669 | 527.7 |
| B | 0 | 190 | 162049 | 302.0 | 2741 | 2669 | 527.7 |
| B | 0 | 183 | 79398 | 145.39 | 2741 | 2669 | 527.7 |
| C | 3 | 233 | 815837 | 1311.79 | 2653 | 2675 | 619.9 |
| C | 0 | 10 | 530222 | 851.04 | 2653 | 2675 | 619.9 |
| C | 14 | 238 | 505250 | 810.75 | 2653 | 2675 | 619.9 |
| D | 8 | 195 | 1302501 | 1955.67 | 2688 | 2623 | 664.7 |
| D | 2 | 250 | 794525 | 1191.42 | 2688 | 2623 | 664.7 |
| D | 15 | 47 | 747756 | 1121.06 | 2688 | 2623 | 664.7 |
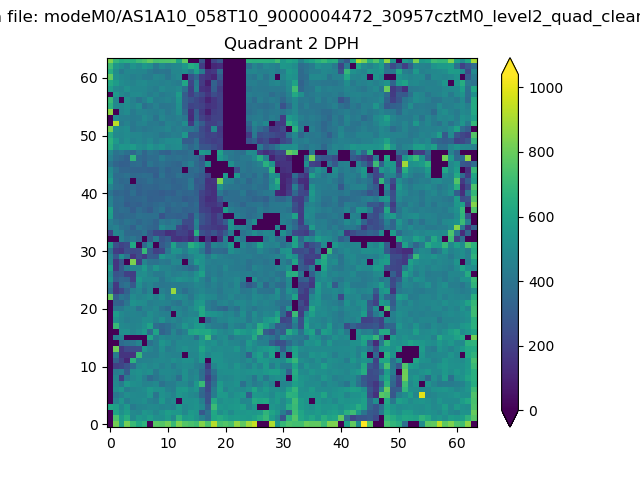
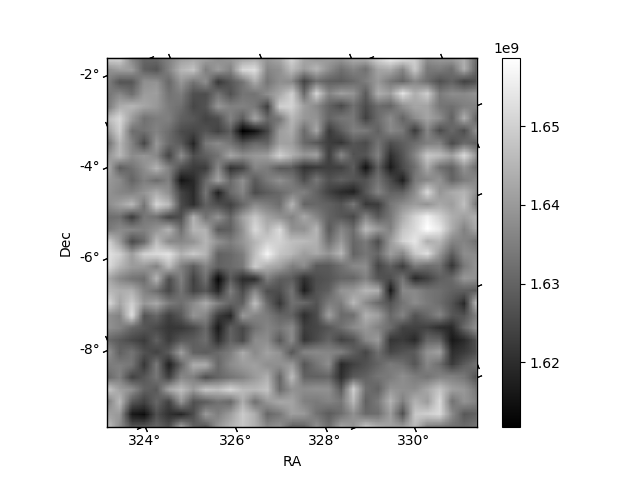
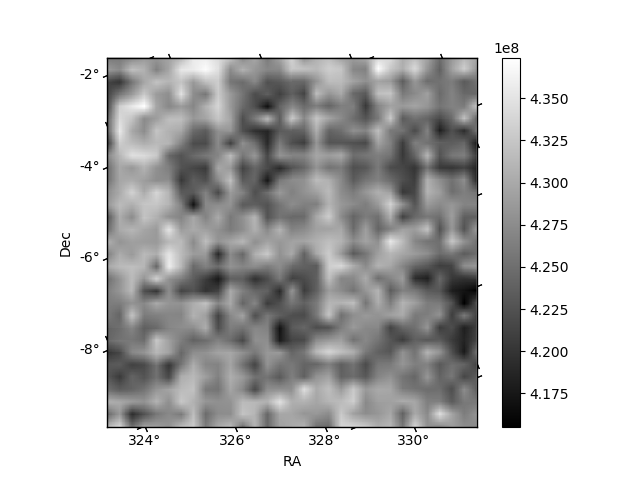
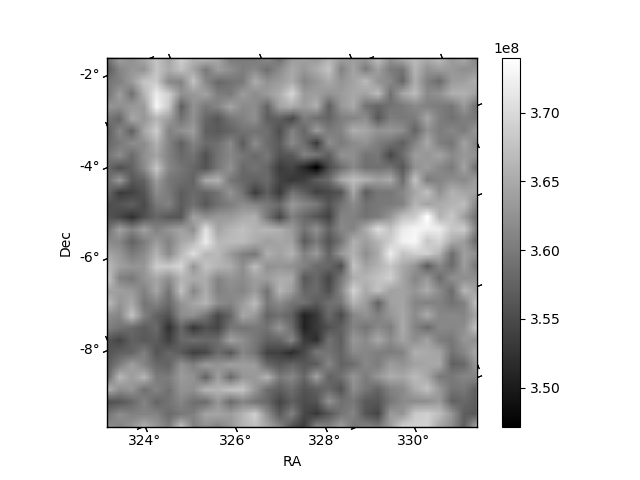
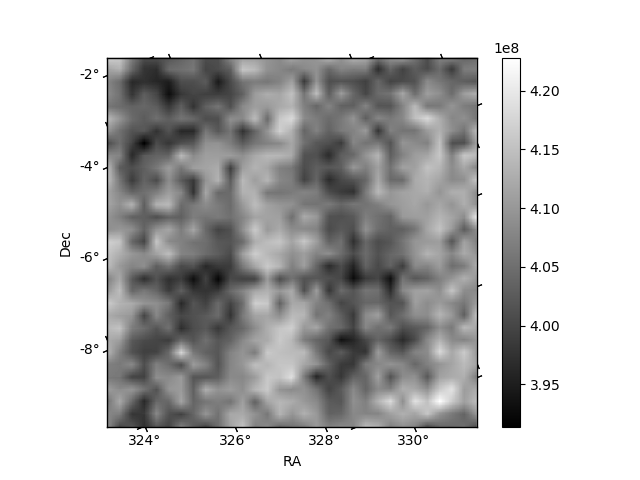
Histogram calculated using DETX and DETY for each event in the final _common_clean file
| Quadrant A | 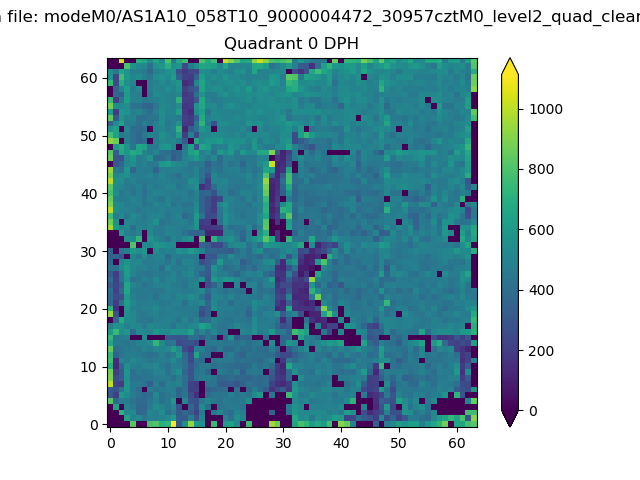 |
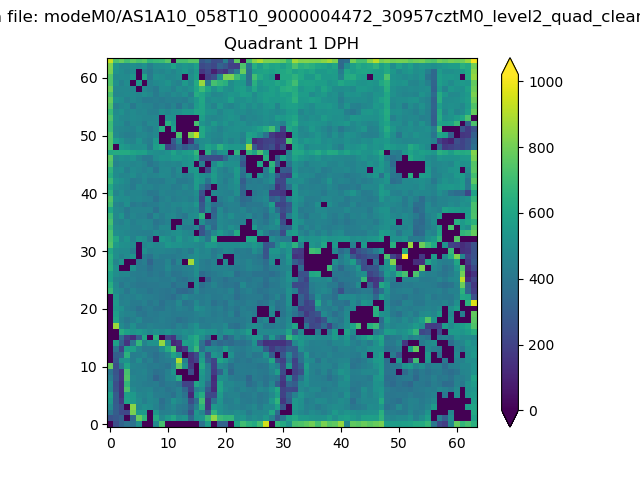 |
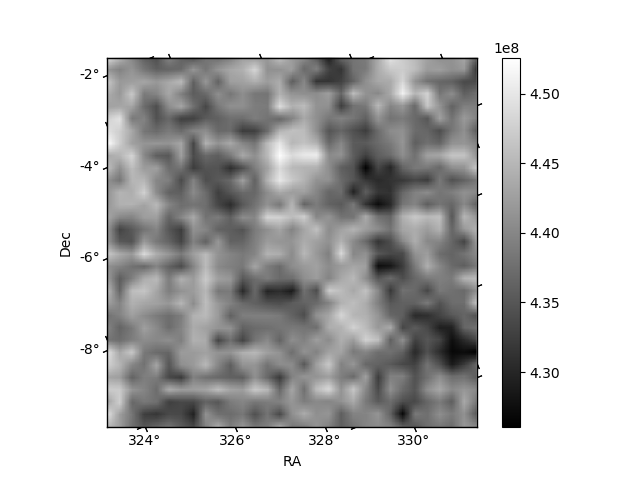
Quadrant B |
|---|---|---|---|
| Quadrant D | 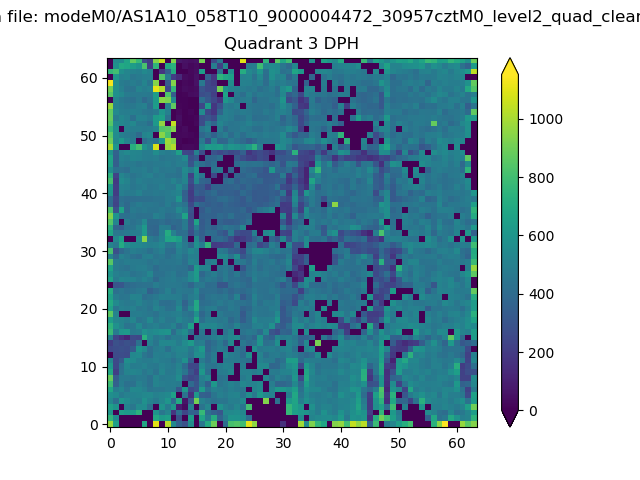 |
 |
Quadrant C |
| Plot type | Count rate plots | Images |
|---|---|---|
| Comparison with Poisson distribution Blue bars denote a histogram of data divided into 1 sec bins. Red curve is a Poisson curve with rate = median count rate of data. |
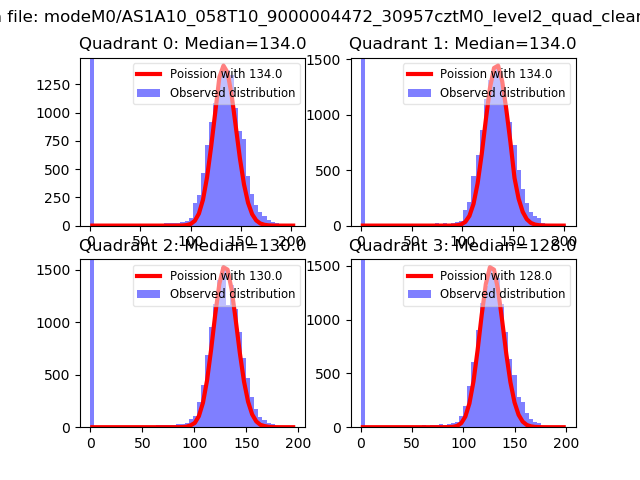 |
 |
| Quadrant-wise count rates Data is divided into 100 sec bins |
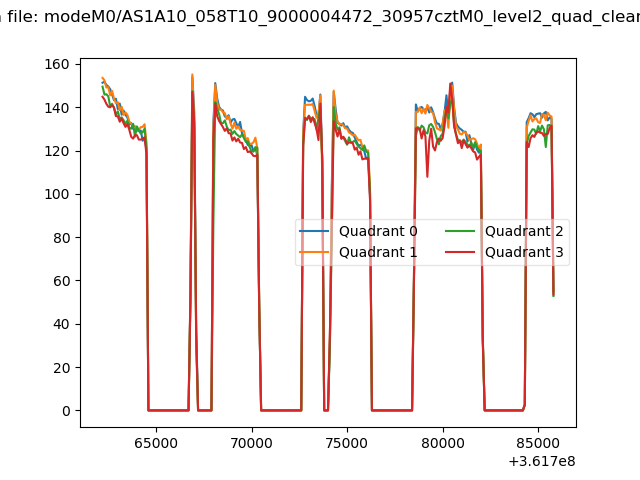 |
|
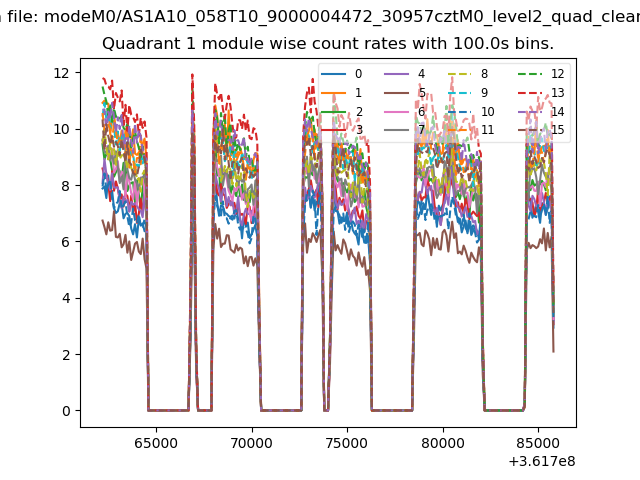
| Module-wise count rates for Quadrant A Data is divided into 100 sec bins |
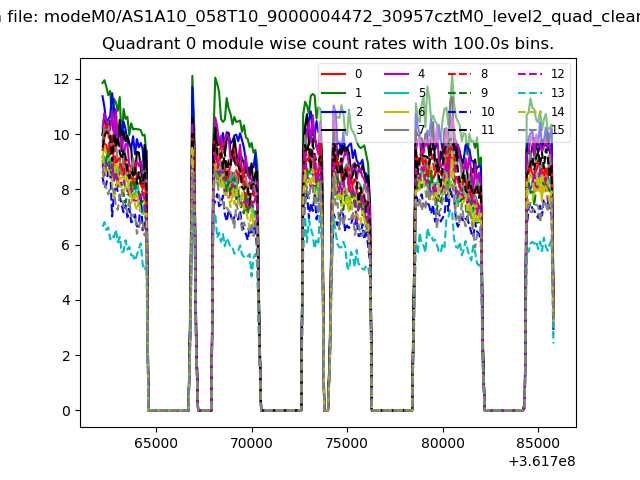 |
 |
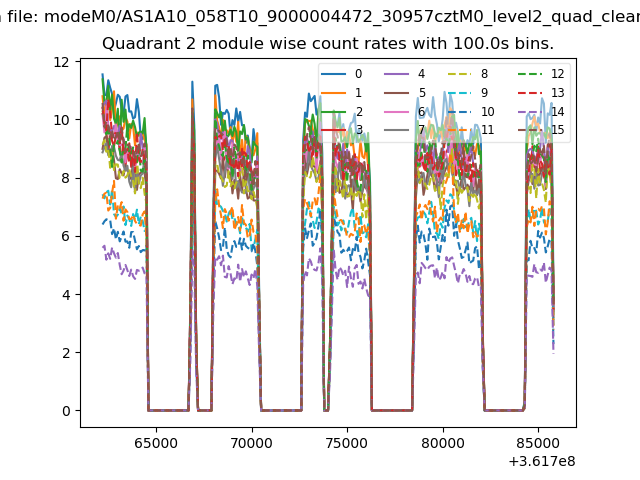
| Module-wise count rates for Quadrant B Data is divided into 100 sec bins |
 |
 |
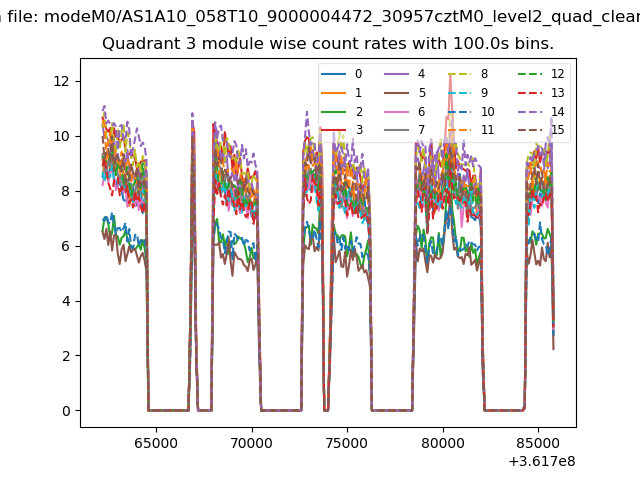
| Module-wise count rates for Quadrant C Data is divided into 100 sec bins |
 |
 |
| Module-wise count rates for Quadrant D Data is divided into 100 sec bins |
 |
 |
| Parameter | Plot |
|---|---|
| CZT HV Monitor | 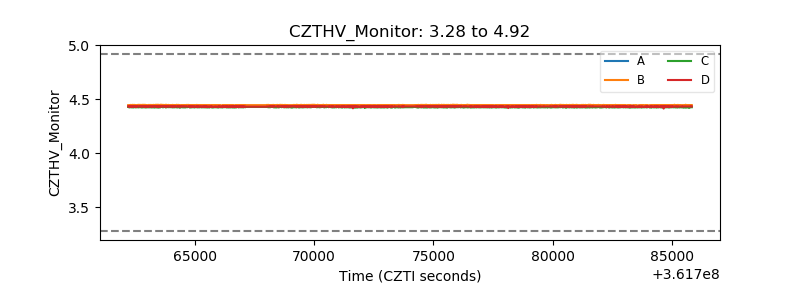 |
| D_VDD | 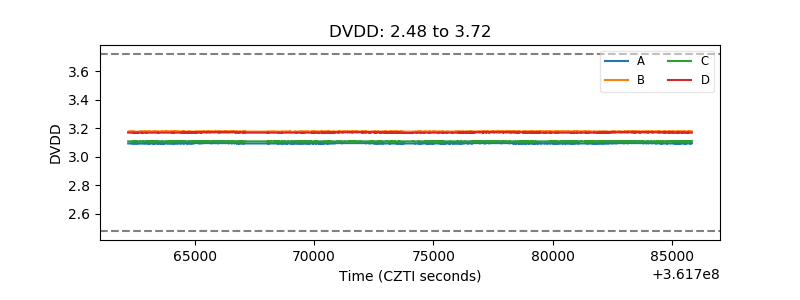 |
| Temperature 1 | 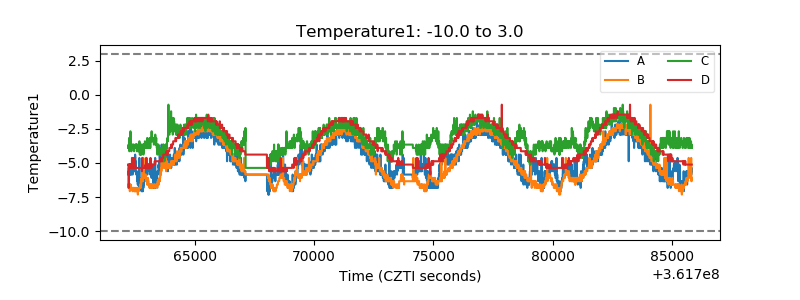 |
| Veto HV Monitor | 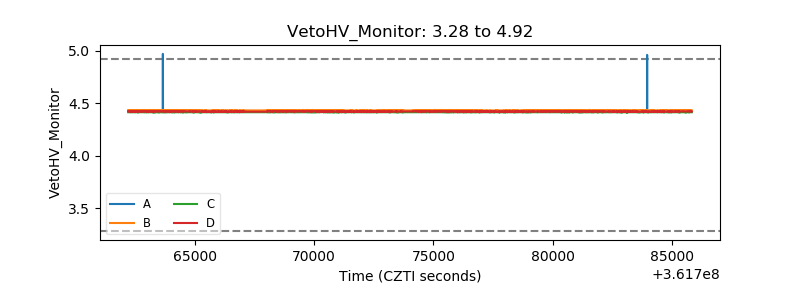 |
| Veto LLD | 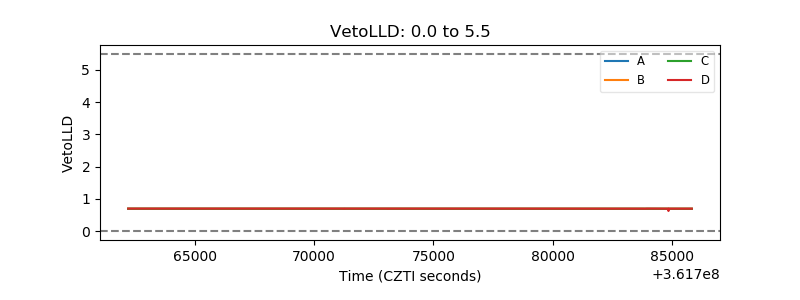 |
| Alpha Counter | 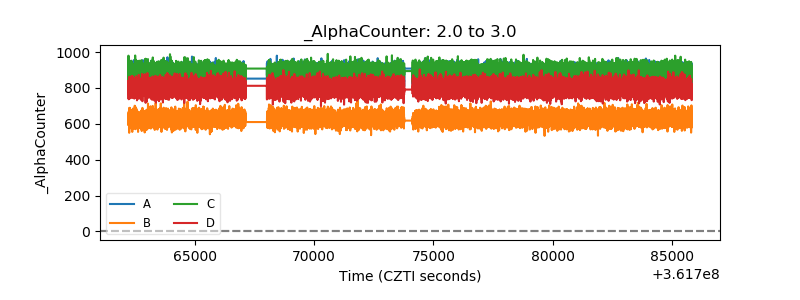 |
| _CPM_Rate | 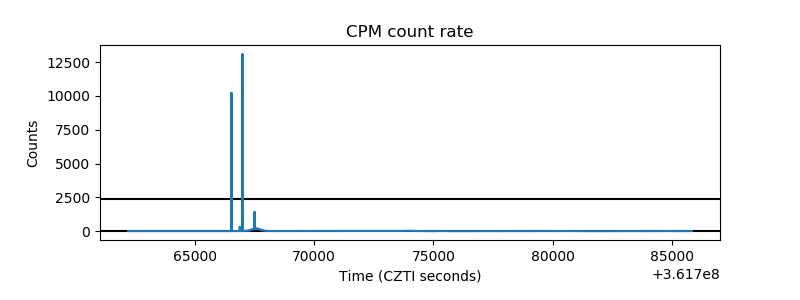 |
| CZT Counter | 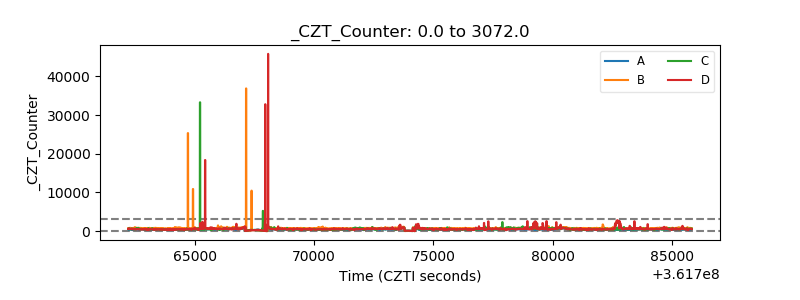 |
| +2.5 Volts monitor | 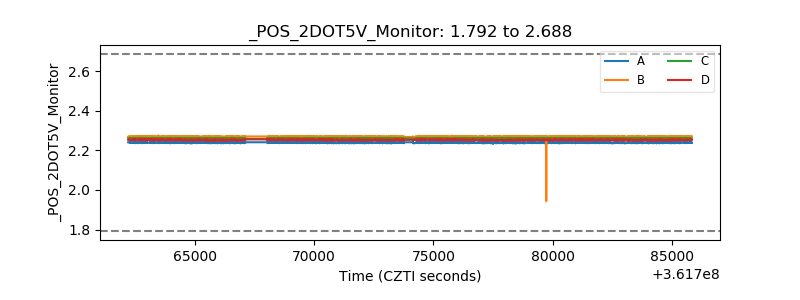 |
| +5 Volts monitor | 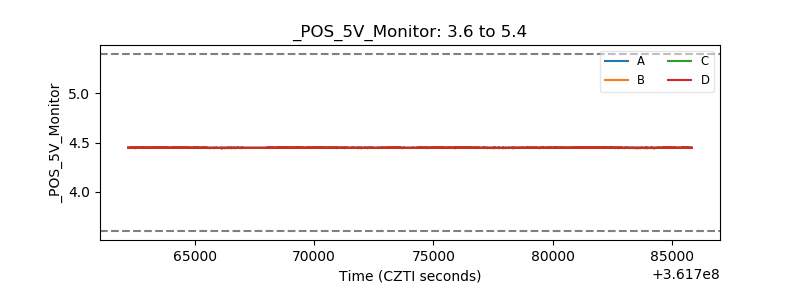 |
| _ROLL_ROT | 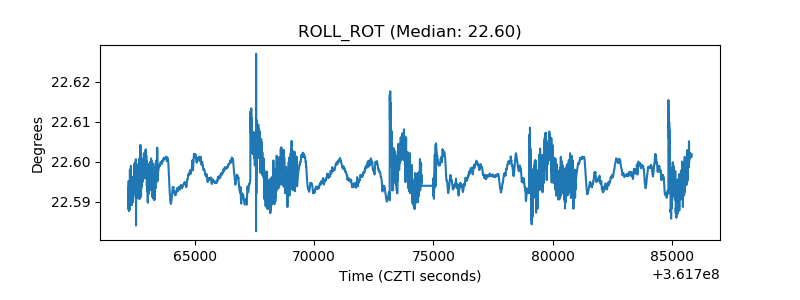 |
| _Roll_DEC | 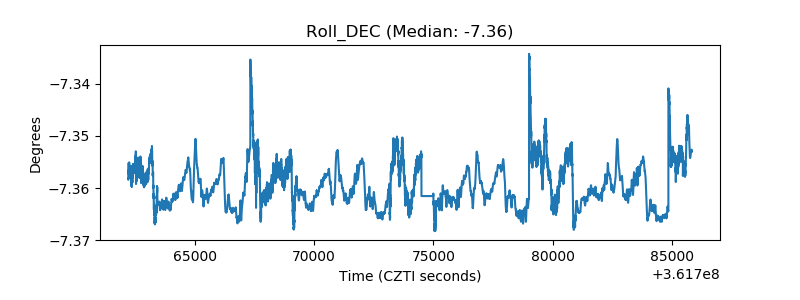 |
| _Roll_RA | 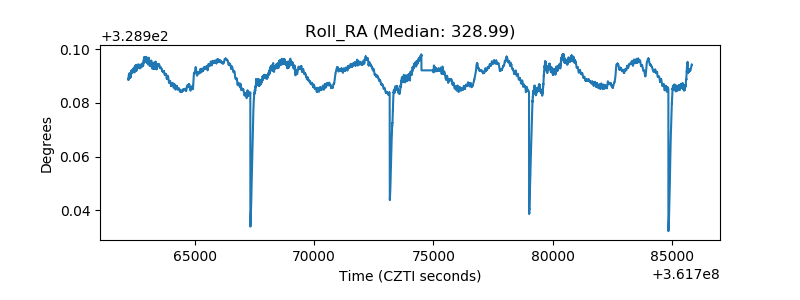 |
| Veto Counter | 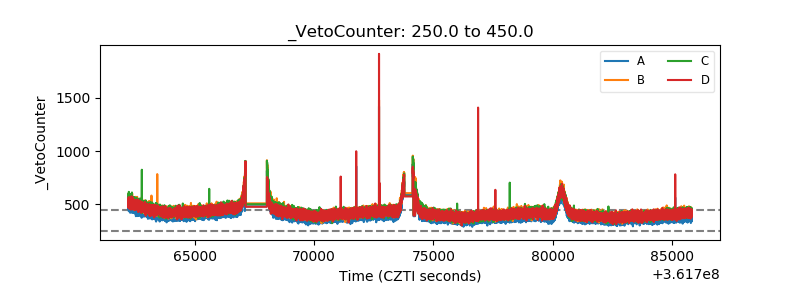 |