| Param | Original file | Final file |
|---|---|---|
| Filename | modeM0/AS1A10_058T11_9000004474cztM0_level2.fits | modeM0/AS1A10_058T11_9000004474cztM0_level2_quad_clean.evt |
| Size (bytes) | 779,120,640 | 603,158,400 |
| Size | 743.0 MB | 575.2 MB |
| Events in quadrant A | 4,872,516 | 3,437,874 |
| Events in quadrant B | 4,564,196 | 3,365,479 |
| Events in quadrant C | 4,720,166 | 3,214,655 |
| Events in quadrant D | 4,172,050 | 2,981,118 |
| Mode M9 | |||
|---|---|---|---|
| Quadrant | BADHDUFLAG | Total packets | Discarded packets |
| A | 0 | 115 | 0 |
| B | 0 | 116 | 0 |
| C | 0 | 116 | 0 |
| D | 0 | 116 | 0 |
| Mode M0 | |||
|---|---|---|---|
| Quadrant | BADHDUFLAG | Total packets | Discarded packets |
| A | 0 | 161073 | 0 |
| B | 0 | 237873 | 0 |
| C | 0 | 182764 | 0 |
| D | 0 | 209024 | 0 |
| Mode SS | |||
|---|---|---|---|
| Quadrant | BADHDUFLAG | Total packets | Discarded packets |
| A | 0 | 1562 | 0 |
| B | 0 | 1562 | 0 |
| C | 0 | 1562 | 0 |
| D | 0 | 1562 | 0 |
| Quadrant | Total seconds | Saturated seconds | Saturation percentage |
|---|---|---|---|
| A | 76803 | 1082 | 1.408799% |
| B | 76803 | 2412 | 3.140502% |
| C | 76802 | 2695 | 3.509023% |
| D | 76802 | 2281 | 2.969975% |
Noise dominated data is calculated using 1-second bins in cleaned event files. If a bin has >2000 counts, and if more than 50% of those come from <1% of pixels, then it is considered to be noise-dominated and hence unusable.
| Quadrant | # 1 sec bins | Bins with >0 counts | Bins with >2000 counts | High rate bins dominated by noise | Noise dominated (total time) | Noise dominated (detector-on time) | Marked lightcurve |
|---|---|---|---|---|---|---|---|
| A | 104817 | 76792 | 0 | 0 | 0.00% | 0.00% | 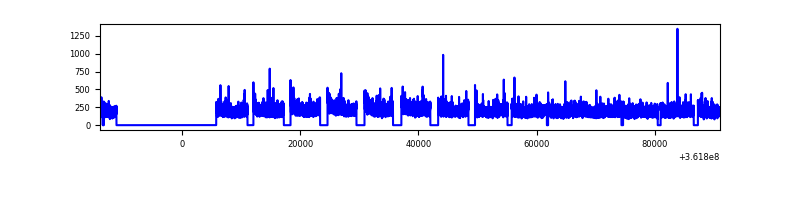 |
| B | 104817 | 76791 | 0 | 0 | 0.00% | 0.00% | 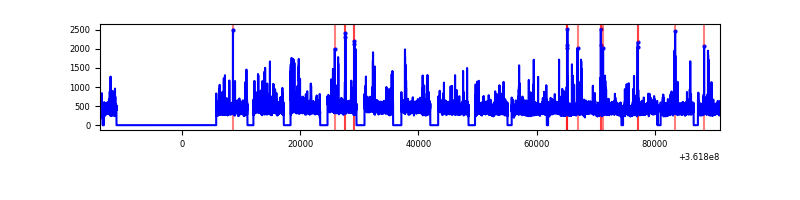 |
| C | 104817 | 76788 | 0 | 0 | 0.00% | 0.00% |  |
| D | 104817 | 76769 | 0 | 0 | 0.00% | 0.00% | 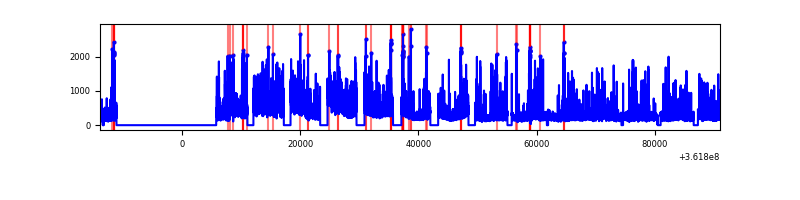 |
Top three noisy pixels from each quadrant. If the there are fewer than three noisy pixels in the level2.evt file, extra rows are filled as -1
| Pixel properties | Quadrant properties | ||||||
|---|---|---|---|---|---|---|---|
| Quadrant | DetID | PixID | Counts | Sigma | Mean | Median | Sigma |
| A | 0 | 29 | 4677 | 11.17 | 1269 | 1189 | 312.3 |
| A | 7 | 110 | 3801 | 8.36 | 1269 | 1189 | 312.3 |
| A | 9 | 19 | 3684 | 7.99 | 1269 | 1189 | 312.3 |
| B | 2 | 9 | 3573 | 10.21 | 1206 | 1150 | 237.2 |
| B | 5 | 128 | 3023 | 7.9 | 1206 | 1150 | 237.2 |
| B | 3 | 80 | 2996 | 7.78 | 1206 | 1150 | 237.2 |
| C | 12 | 241 | 3271 | 6.62 | 1250 | 1176 | 316.3 |
| C | 3 | 126 | 3254 | 6.57 | 1250 | 1176 | 316.3 |
| C | 3 | 187 | 3231 | 6.5 | 1250 | 1176 | 316.3 |
| D | 10 | 189 | 2946 | 5.93 | 1192 | 1088 | 313.2 |
| D | 6 | 231 | 2860 | 5.66 | 1192 | 1088 | 313.2 |
| D | 7 | 3 | 2849 | 5.62 | 1192 | 1088 | 313.2 |
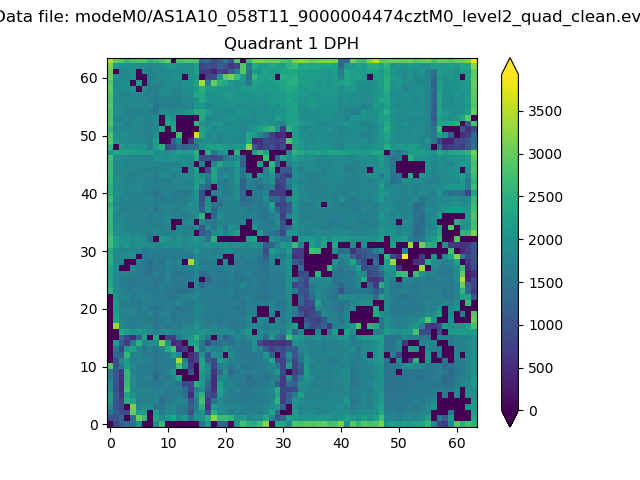
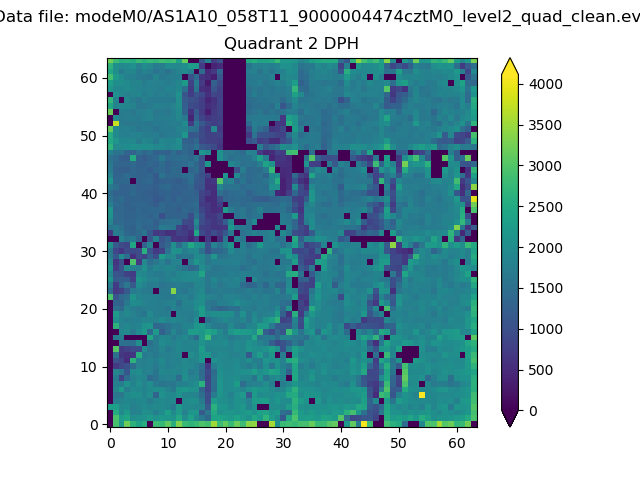
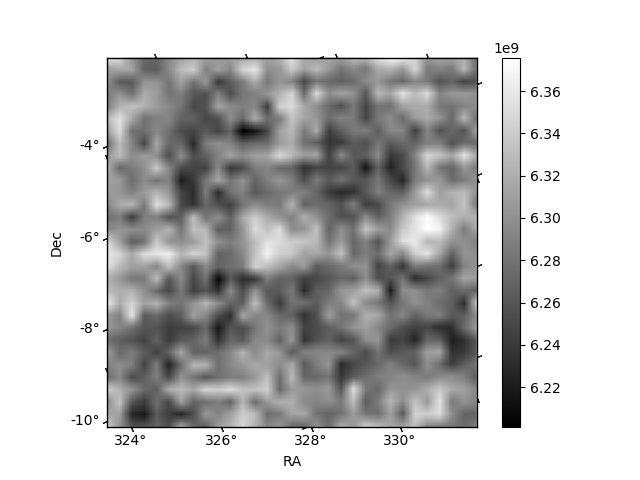
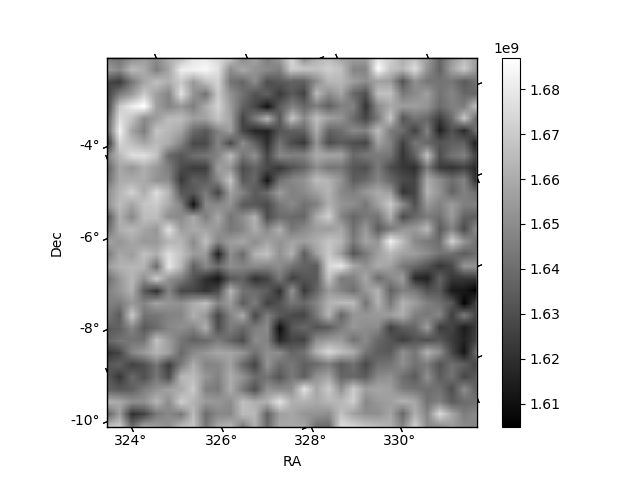
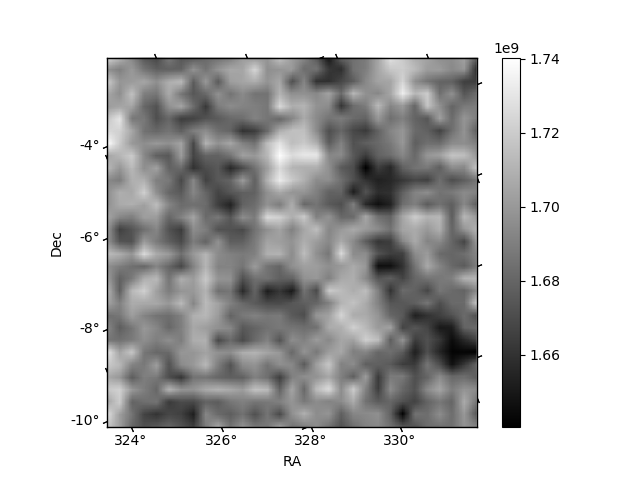
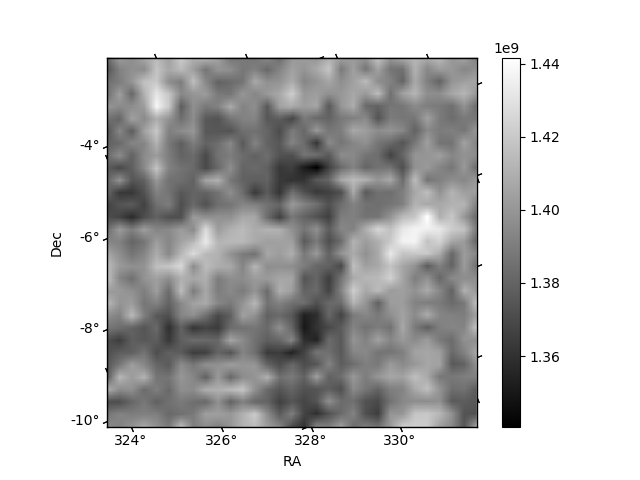
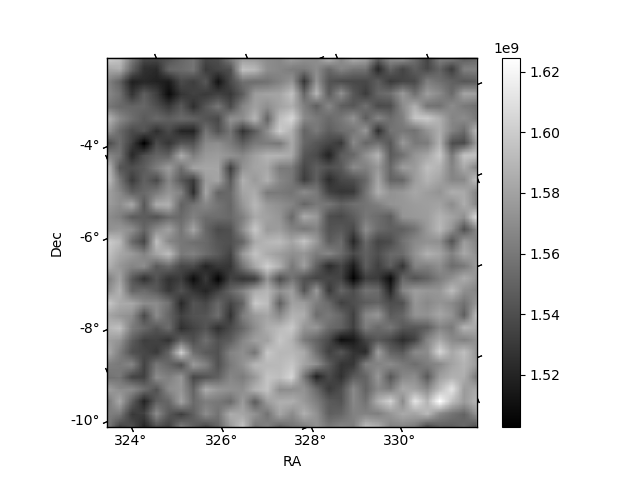
Histogram calculated using DETX and DETY for each event in the final _common_clean file
| Quadrant A | 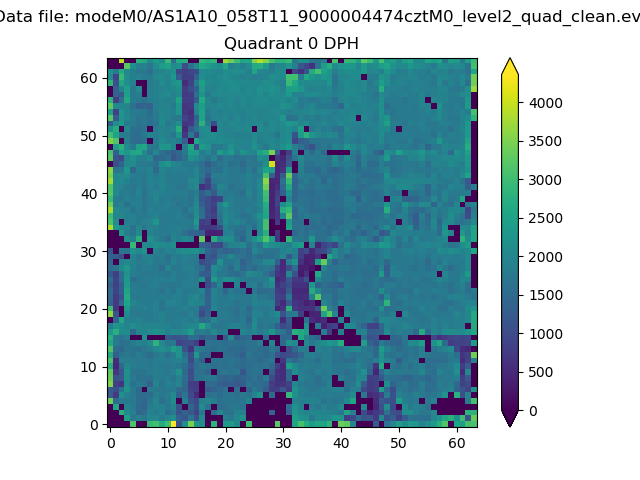 |
 |
Quadrant B |
|---|---|---|---|
| Quadrant D | 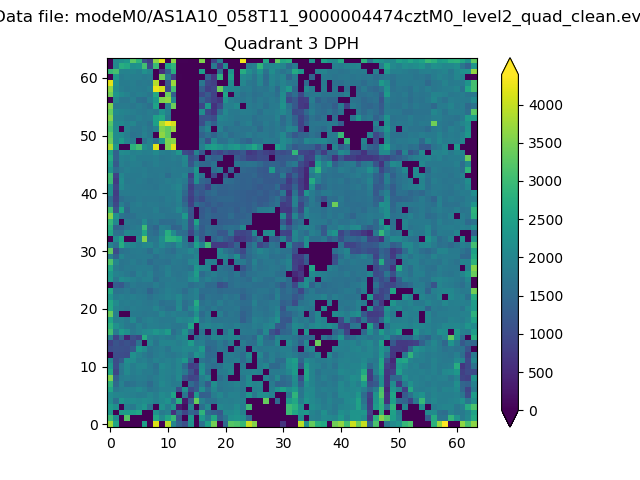 |
 |
Quadrant C |
| Plot type | Count rate plots | Images |
|---|---|---|
| Comparison with Poisson distribution Blue bars denote a histogram of data divided into 1 sec bins. Red curve is a Poisson curve with rate = median count rate of data. |
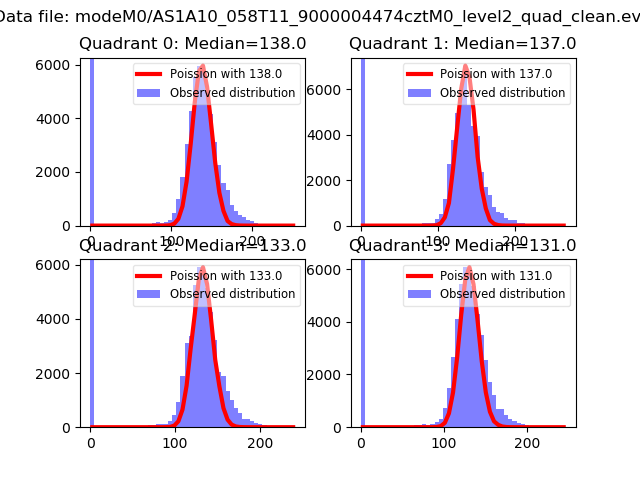 |
 |
| Quadrant-wise count rates Data is divided into 100 sec bins |
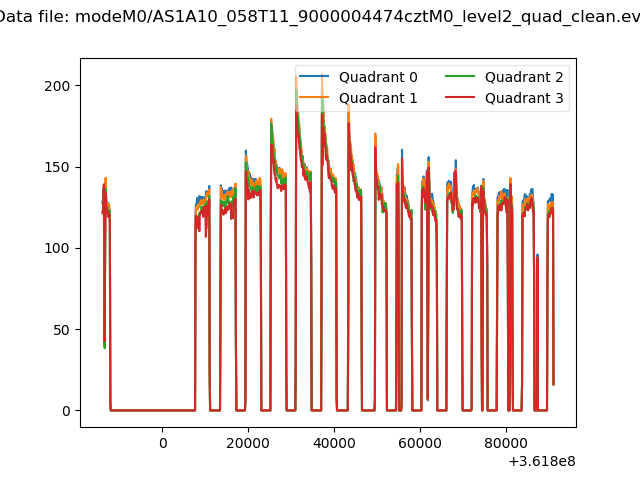 |
|
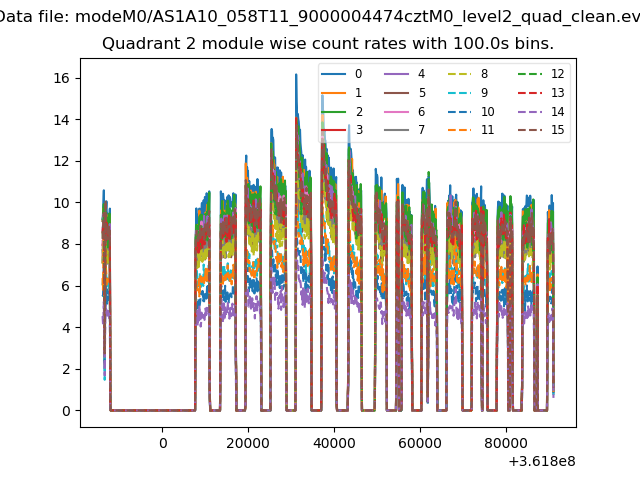
| Module-wise count rates for Quadrant A Data is divided into 100 sec bins |
 |
 |
| Module-wise count rates for Quadrant B Data is divided into 100 sec bins |
 |
 |
| Module-wise count rates for Quadrant C Data is divided into 100 sec bins |
 |
 |
| Module-wise count rates for Quadrant D Data is divided into 100 sec bins |
 |
 |
| Parameter | Plot |
|---|---|
| CZT HV Monitor | 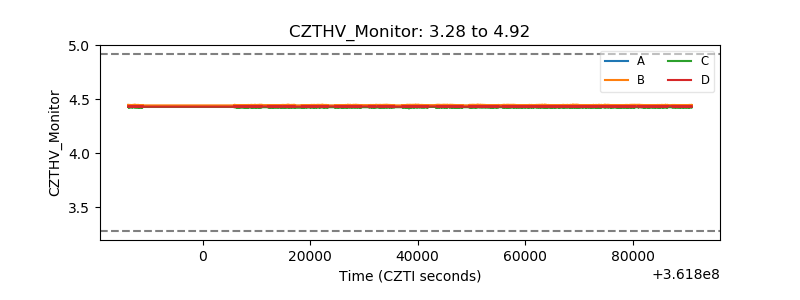 |
| D_VDD | 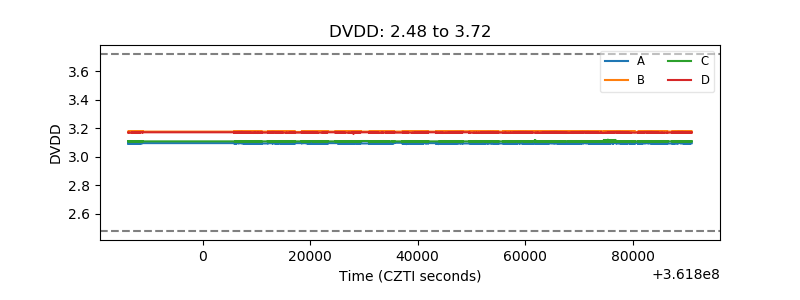 |
| Temperature 1 | 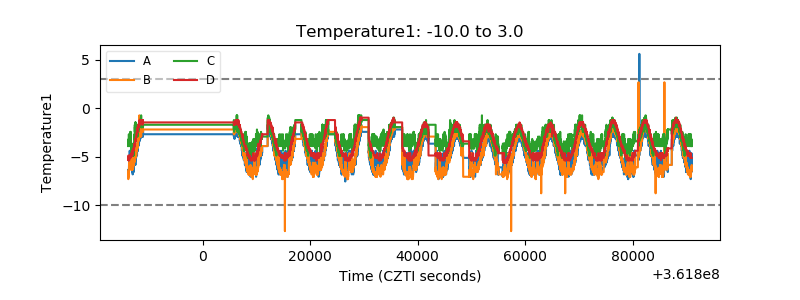 |
| Veto HV Monitor | 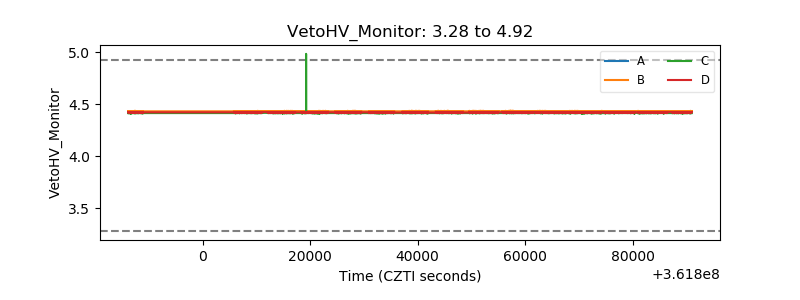 |
| Veto LLD | 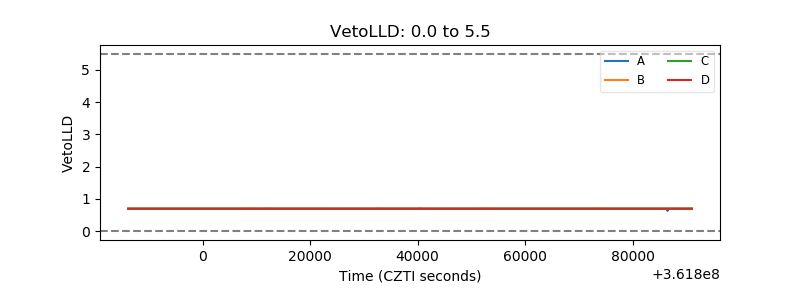 |
| Alpha Counter |  |
| _CPM_Rate | 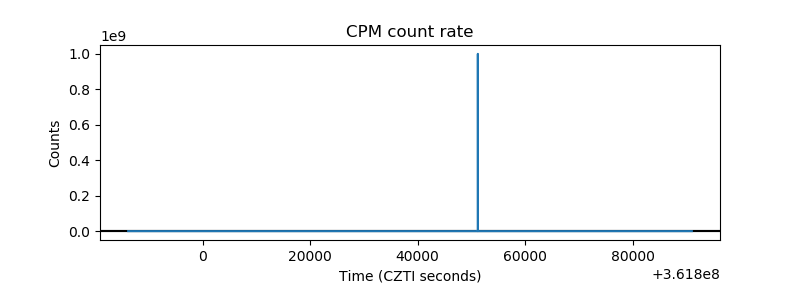 |
| CZT Counter |  |
| +2.5 Volts monitor |  |
| +5 Volts monitor |  |
| _ROLL_ROT | 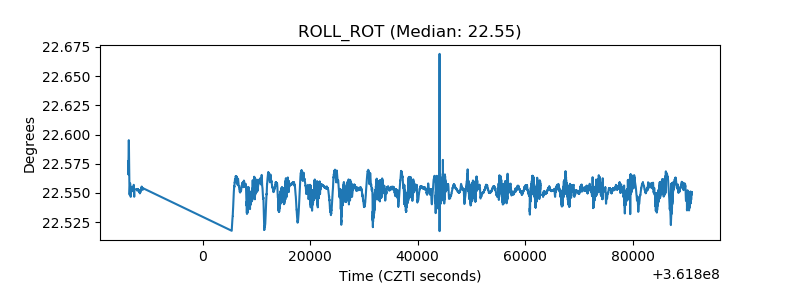 |
| _Roll_DEC | 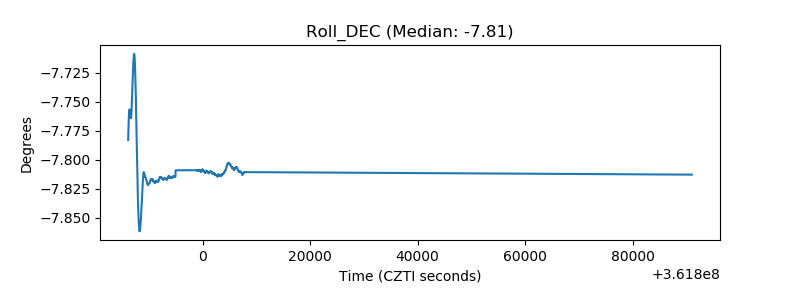 |
| _Roll_RA | 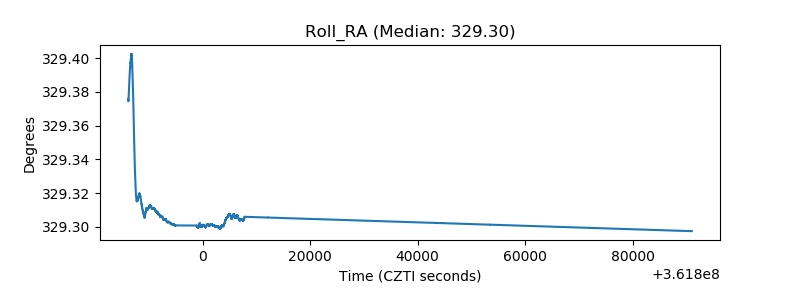 |
| Veto Counter | 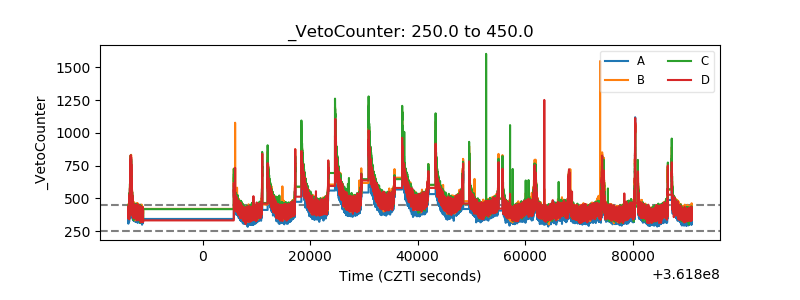 |