| Param | Original file | Final file |
|---|---|---|
| Filename | modeM0/AS1A10_058T11_9000004474_30953cztM0_level2.evt | modeM0/AS1A10_058T11_9000004474_30953cztM0_level2_quad_clean.evt |
| Size (bytes) | 175,648,320 | 33,468,480 |
| Size | 167.5 MB | 31.9 MB |
| Events in quadrant A | 1,088,640 | 217,484 |
| Events in quadrant B | 1,679,657 | 217,620 |
| Events in quadrant C | 1,242,221 | 211,752 |
| Events in quadrant D | 1,162,868 | 212,611 |
| Mode M9 | |||
|---|---|---|---|
| Quadrant | BADHDUFLAG | Total packets | Discarded packets |
| A | 0 | 1 | 0 |
| B | 0 | 1 | 0 |
| C | 0 | 1 | 0 |
| D | 0 | 1 | 0 |
| Mode M0 | |||
|---|---|---|---|
| Quadrant | BADHDUFLAG | Total packets | Discarded packets |
| A | 0 | 4613 | 3 |
| B | 0 | 6569 | 2 |
| C | 0 | 4978 | 2 |
| D | 0 | 4762 | 2 |
| Mode SS | |||
|---|---|---|---|
| Quadrant | BADHDUFLAG | Total packets | Discarded packets |
| A | 0 | 44 | 0 |
| B | 0 | 44 | 0 |
| C | 0 | 44 | 0 |
| D | 0 | 44 | 0 |
| Quadrant | Total seconds | Saturated seconds | Saturation percentage |
|---|---|---|---|
| A | 2115 | 210 | 9.929078% |
| B | 2115 | 272 | 12.860520% |
| C | 2115 | 229 | 10.827423% |
| D | 2115 | 188 | 8.888889% |
Noise dominated data is calculated using 1-second bins in cleaned event files. If a bin has >2000 counts, and if more than 50% of those come from <1% of pixels, then it is considered to be noise-dominated and hence unusable.
| Quadrant | # 1 sec bins | Bins with >0 counts | Bins with >2000 counts | High rate bins dominated by noise | Noise dominated (total time) | Noise dominated (detector-on time) | Marked lightcurve |
|---|---|---|---|---|---|---|---|
| A | 2225 | 2115 | 0 | 0 | 0.00% | 0.00% | 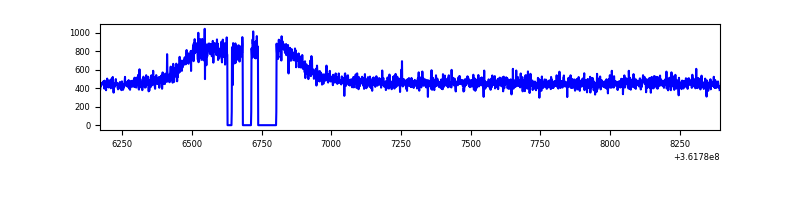 |
| B | 2225 | 2115 | 0 | 0 | 0.00% | 0.00% | 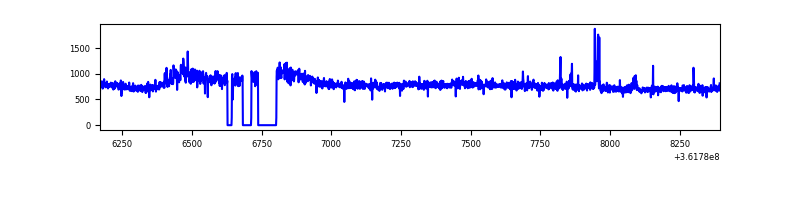 |
| C | 2225 | 2115 | 4 | 4 | 0.18% | 0.19% | 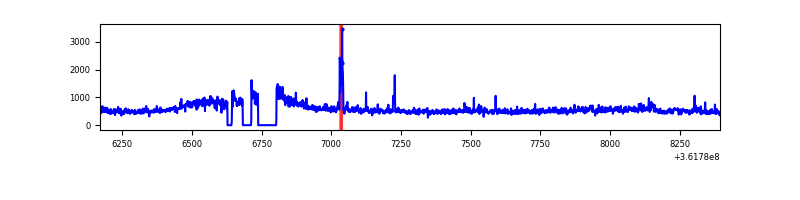 |
| D | 2225 | 2116 | 5 | 5 | 0.22% | 0.24% | 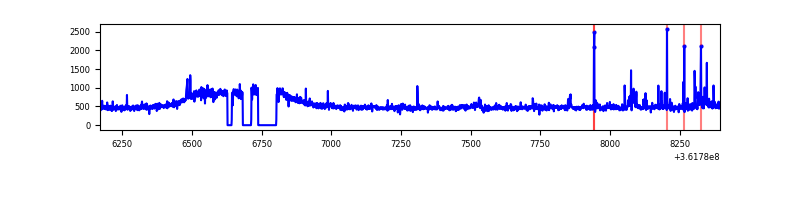 |
Top three noisy pixels from each quadrant. If the there are fewer than three noisy pixels in the level2.evt file, extra rows are filled as -1
| Pixel properties | Quadrant properties | ||||||
|---|---|---|---|---|---|---|---|
| Quadrant | DetID | PixID | Counts | Sigma | Mean | Median | Sigma |
| A | 13 | 254 | 3091 | 47.57 | 282 | 274 | 59.2 |
| A | 3 | 137 | 3022 | 46.4 | 282 | 274 | 59.2 |
| A | 0 | 226 | 2282 | 33.91 | 282 | 274 | 59.2 |
| B | 6 | 159 | 574540 | 10171.15 | 271 | 262 | 56.5 |
| B | 0 | 190 | 18983 | 331.57 | 271 | 262 | 56.5 |
| B | 0 | 183 | 9797 | 168.88 | 271 | 262 | 56.5 |
| C | 3 | 233 | 86747 | 1340.11 | 266 | 266 | 64.5 |
| C | 0 | 10 | 73605 | 1136.46 | 266 | 266 | 64.5 |
| C | 14 | 238 | 40020 | 616.03 | 266 | 266 | 64.5 |
| D | 8 | 195 | 54841 | 764.34 | 276 | 268 | 71.4 |
| D | 15 | 47 | 27160 | 376.64 | 276 | 268 | 71.4 |
| D | 2 | 250 | 19433 | 268.42 | 276 | 268 | 71.4 |
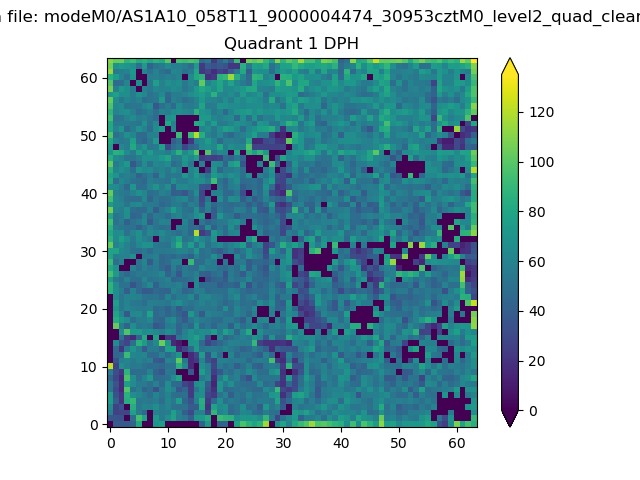
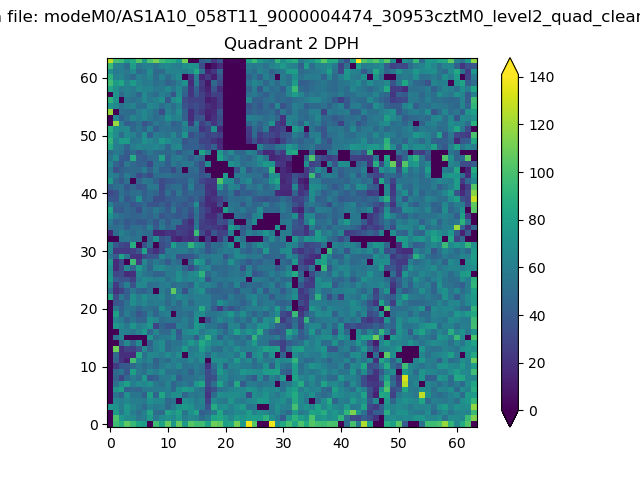
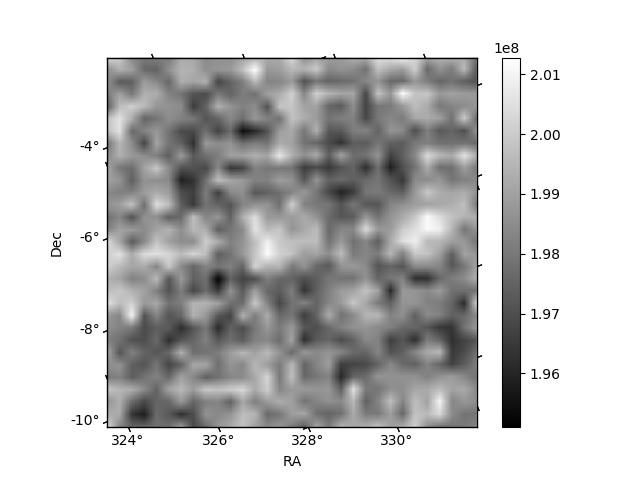
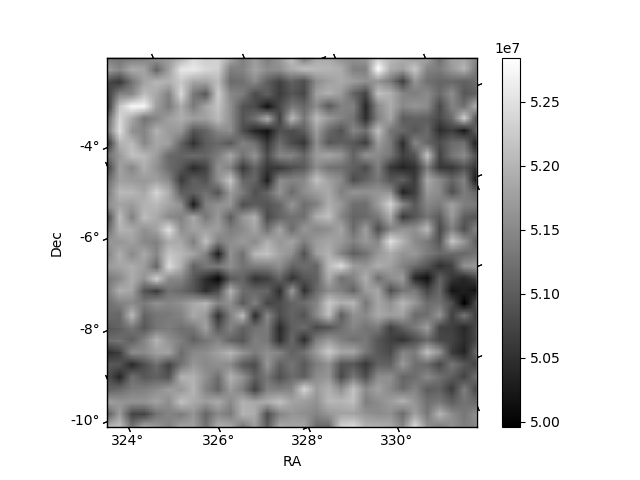
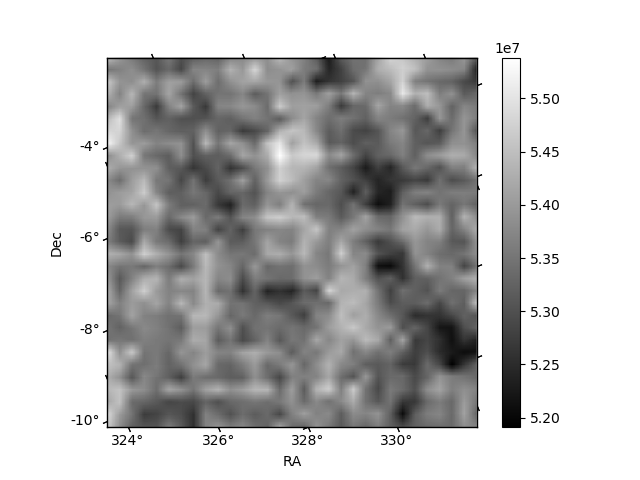
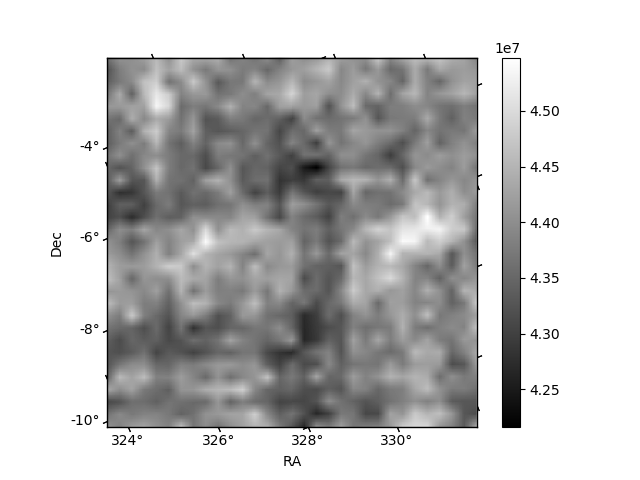
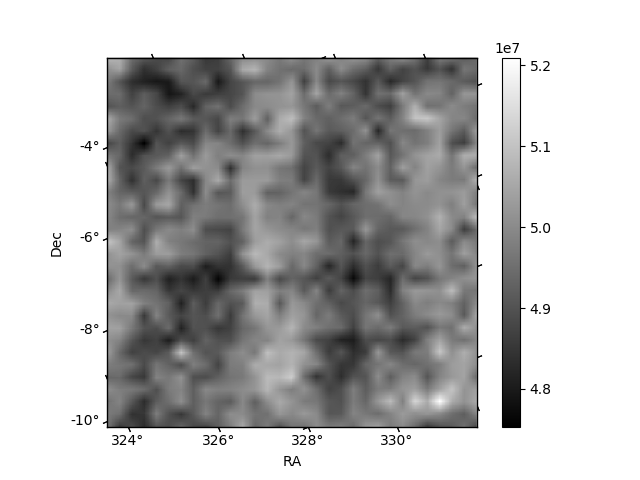
Histogram calculated using DETX and DETY for each event in the final _common_clean file
| Quadrant A |  |
 |
Quadrant B |
|---|---|---|---|
| Quadrant D | 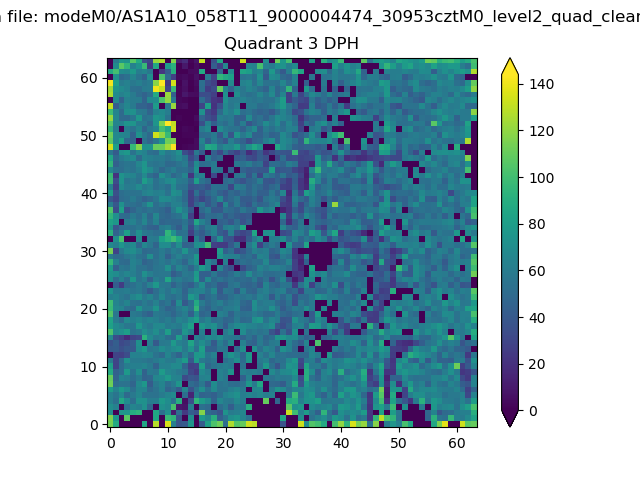 |
 |
Quadrant C |
| Plot type | Count rate plots | Images |
|---|---|---|
| Comparison with Poisson distribution Blue bars denote a histogram of data divided into 1 sec bins. Red curve is a Poisson curve with rate = median count rate of data. |
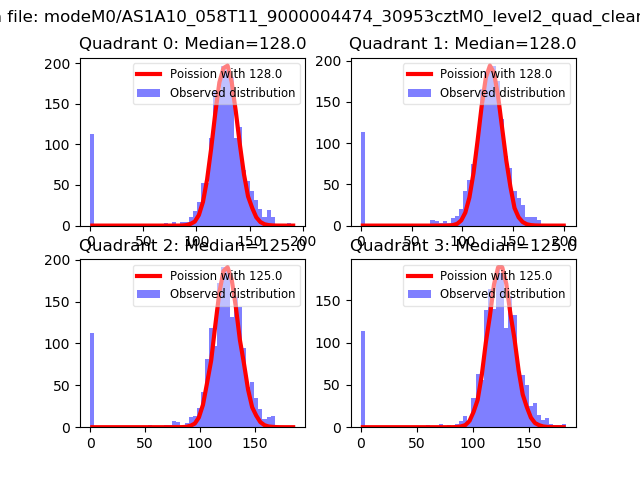 |
 |
| Quadrant-wise count rates Data is divided into 100 sec bins |
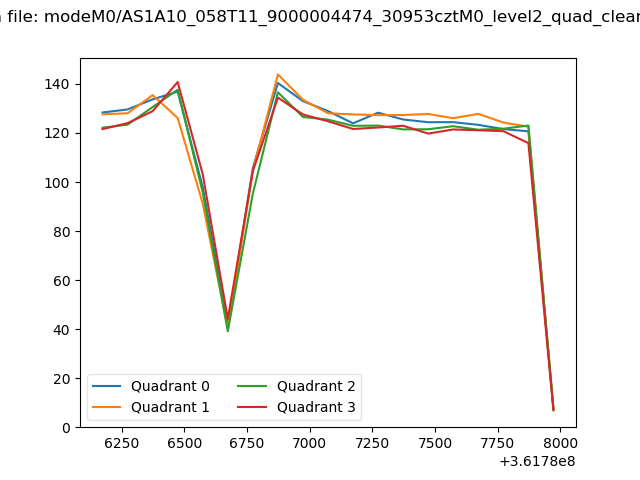 |
|
| Module-wise count rates for Quadrant A Data is divided into 100 sec bins |
 |
 |
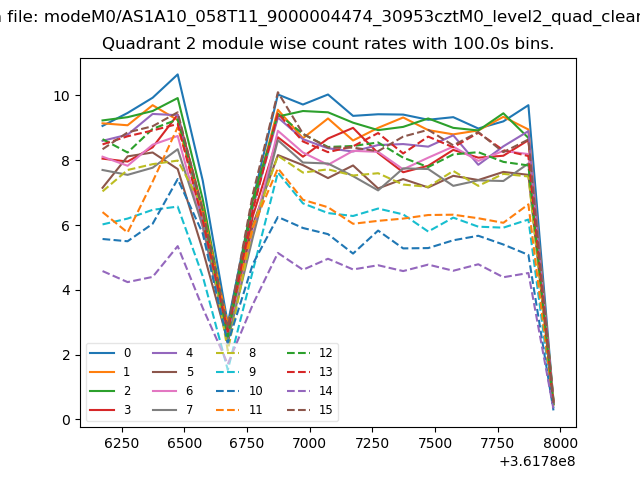
| Module-wise count rates for Quadrant B Data is divided into 100 sec bins |
 |
 |
| Module-wise count rates for Quadrant C Data is divided into 100 sec bins |
 |
 |
| Module-wise count rates for Quadrant D Data is divided into 100 sec bins |
 |
 |
| Parameter | Plot |
|---|---|
| CZT HV Monitor | 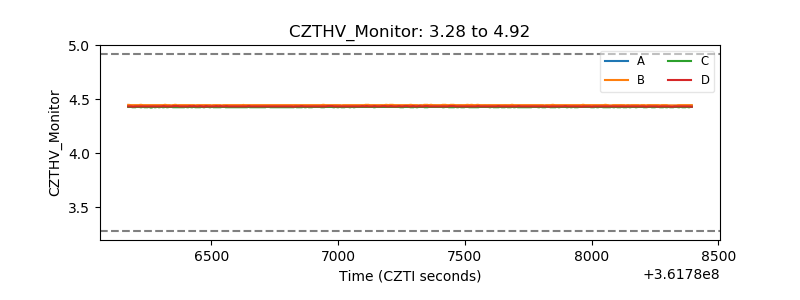 |
| D_VDD | 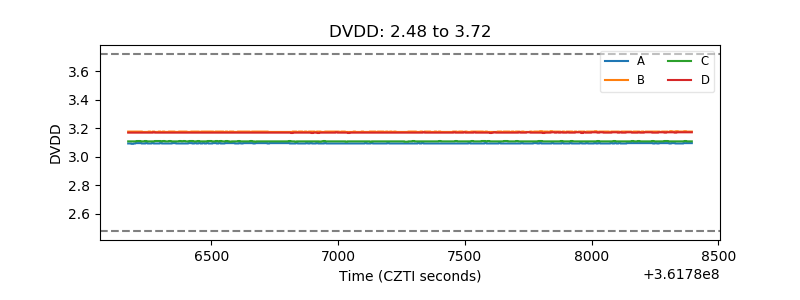 |
| Temperature 1 | 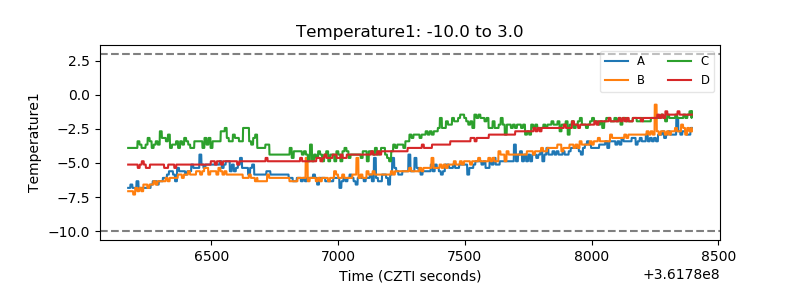 |
| Veto HV Monitor | 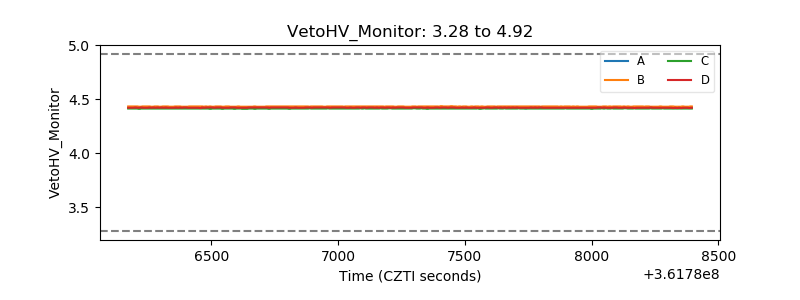 |
| Veto LLD | 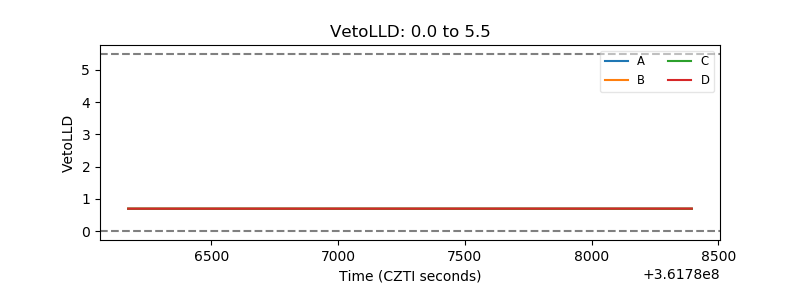 |
| Alpha Counter | 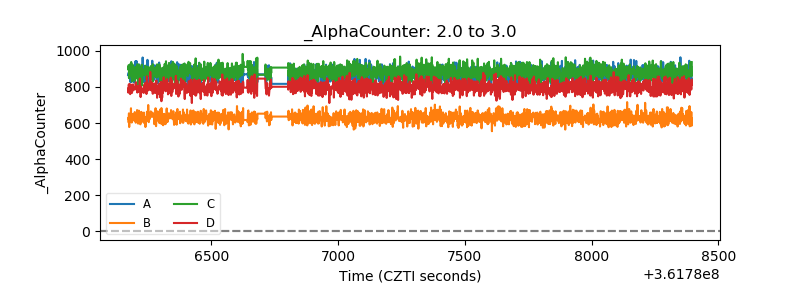 |
| _CPM_Rate | 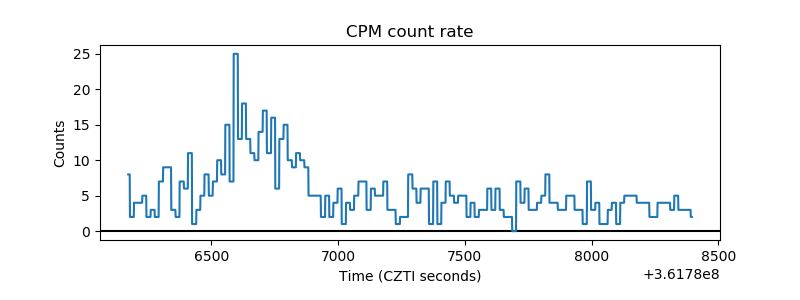 |
| CZT Counter | 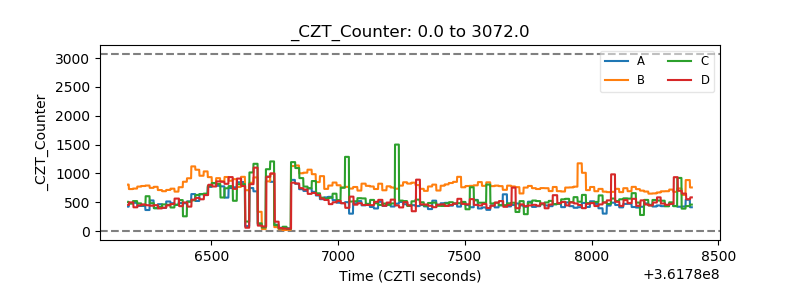 |
| +2.5 Volts monitor | 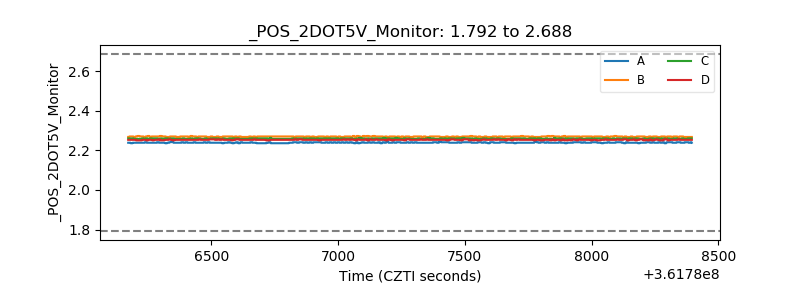 |
| +5 Volts monitor | 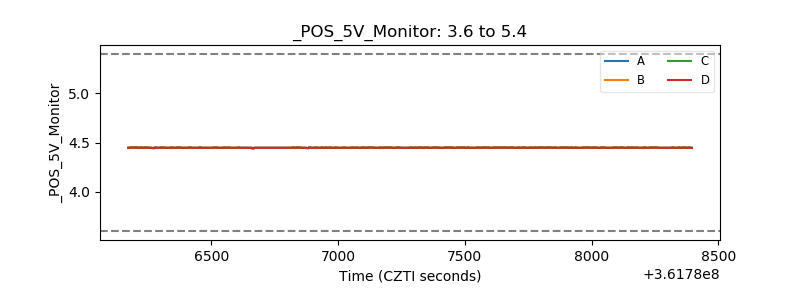 |
| _ROLL_ROT | 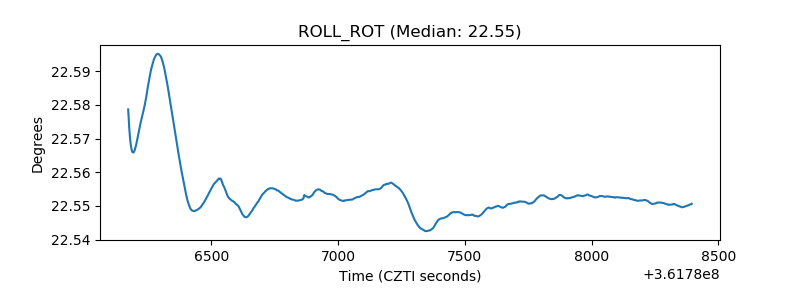 |
| _Roll_DEC | 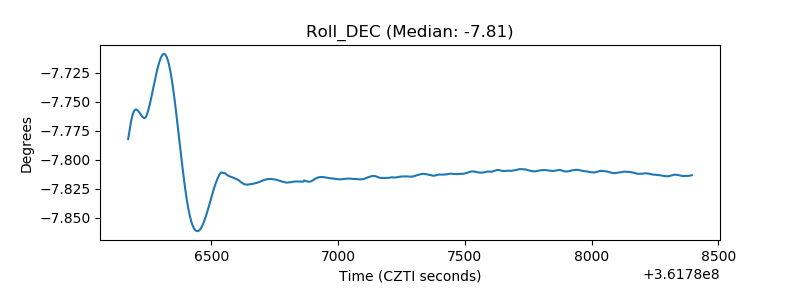 |
| _Roll_RA | 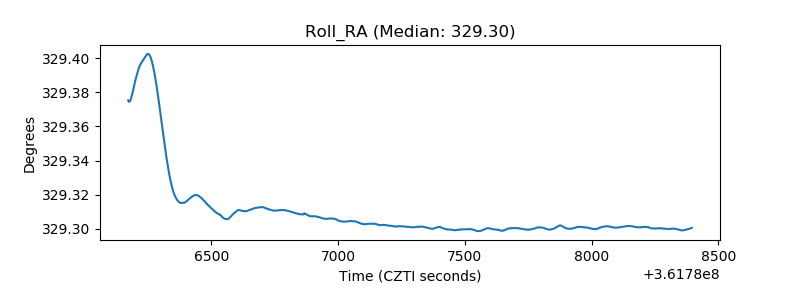 |
| Veto Counter | 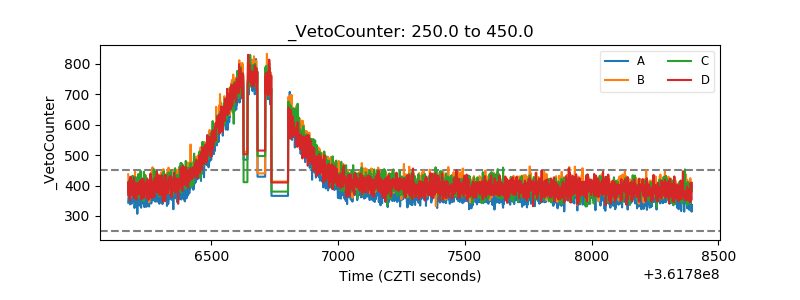 |