| Param | Original file | Final file |
|---|---|---|
| Filename | modeM0/AS1A10_058T11_9000004474_30956cztM0_level2.evt | modeM0/AS1A10_058T11_9000004474_30956cztM0_level2_quad_clean.evt |
| Size (bytes) | 1,492,269,120 | 210,844,800 |
| Size | 1.4 GB | 201.1 MB |
| Events in quadrant A | 8,686,571 | 1,315,336 |
| Events in quadrant B | 14,437,934 | 1,301,226 |
| Events in quadrant C | 10,050,205 | 1,254,599 |
| Events in quadrant D | 10,782,705 | 1,250,684 |
| Mode M9 | |||
|---|---|---|---|
| Quadrant | BADHDUFLAG | Total packets | Discarded packets |
| A | 0 | 19 | 0 |
| B | 0 | 19 | 0 |
| C | 0 | 19 | 0 |
| D | 0 | 19 | 0 |
| Mode M0 | |||
|---|---|---|---|
| Quadrant | BADHDUFLAG | Total packets | Discarded packets |
| A | 0 | 37458 | 3 |
| B | 0 | 56378 | 3 |
| C | 0 | 40882 | 3 |
| D | 0 | 43254 | 3 |
| Mode SS | |||
|---|---|---|---|
| Quadrant | BADHDUFLAG | Total packets | Discarded packets |
| A | 0 | 372 | 0 |
| B | 0 | 372 | 0 |
| C | 0 | 372 | 0 |
| D | 0 | 372 | 0 |
| Quadrant | Total seconds | Saturated seconds | Saturation percentage |
|---|---|---|---|
| A | 18340 | 211 | 1.150491% |
| B | 18340 | 406 | 2.213740% |
| C | 18340 | 416 | 2.268266% |
| D | 18340 | 412 | 2.246456% |
Noise dominated data is calculated using 1-second bins in cleaned event files. If a bin has >2000 counts, and if more than 50% of those come from <1% of pixels, then it is considered to be noise-dominated and hence unusable.
| Quadrant | # 1 sec bins | Bins with >0 counts | Bins with >2000 counts | High rate bins dominated by noise | Noise dominated (total time) | Noise dominated (detector-on time) | Marked lightcurve |
|---|---|---|---|---|---|---|---|
| A | 20205 | 18341 | 0 | 0 | 0.00% | 0.00% | 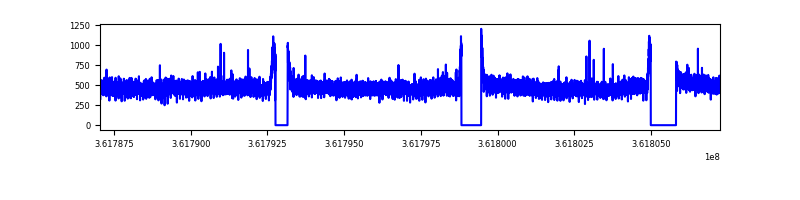 |
| B | 20205 | 18340 | 51 | 51 | 0.25% | 0.28% | 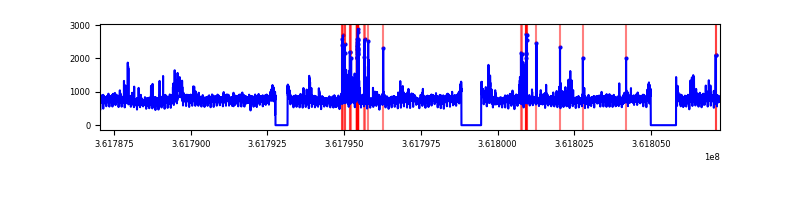 |
| C | 20205 | 18341 | 31 | 31 | 0.15% | 0.17% | 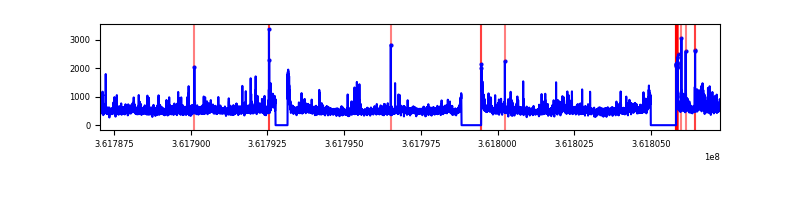 |
| D | 20205 | 18340 | 219 | 219 | 1.08% | 1.19% | 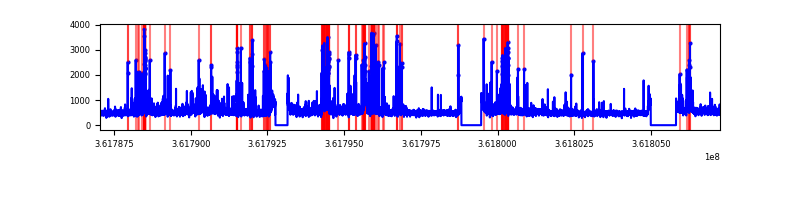 |
Top three noisy pixels from each quadrant. If the there are fewer than three noisy pixels in the level2.evt file, extra rows are filled as -1
| Pixel properties | Quadrant properties | ||||||
|---|---|---|---|---|---|---|---|
| Quadrant | DetID | PixID | Counts | Sigma | Mean | Median | Sigma |
| A | 13 | 254 | 31504 | 65.03 | 2250 | 2199 | 450.6 |
| A | 3 | 137 | 23670 | 47.65 | 2250 | 2199 | 450.6 |
| A | 0 | 226 | 18654 | 36.52 | 2250 | 2199 | 450.6 |
| B | 6 | 159 | 5075121 | 11873.43 | 2209 | 2150 | 427.3 |
| B | 5 | 172 | 223495 | 518.06 | 2209 | 2150 | 427.3 |
| B | 15 | 36 | 143977 | 331.95 | 2209 | 2150 | 427.3 |
| C | 3 | 233 | 832367 | 1648.52 | 2144 | 2157 | 503.6 |
| C | 0 | 10 | 468687 | 926.37 | 2144 | 2157 | 503.6 |
| C | 14 | 238 | 346083 | 682.92 | 2144 | 2157 | 503.6 |
| D | 8 | 195 | 950387 | 1792.32 | 2176 | 2118 | 529.1 |
| D | 15 | 47 | 683459 | 1287.8 | 2176 | 2118 | 529.1 |
| D | 2 | 250 | 620341 | 1168.5 | 2176 | 2118 | 529.1 |
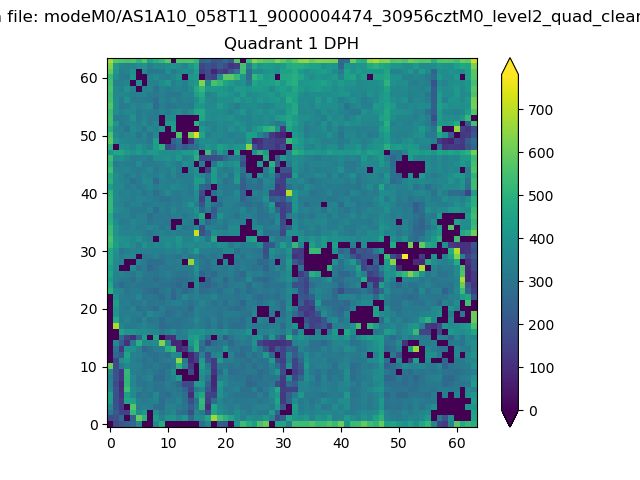
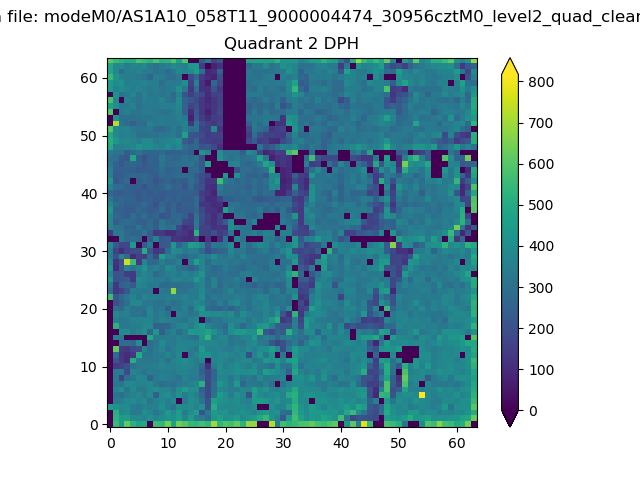
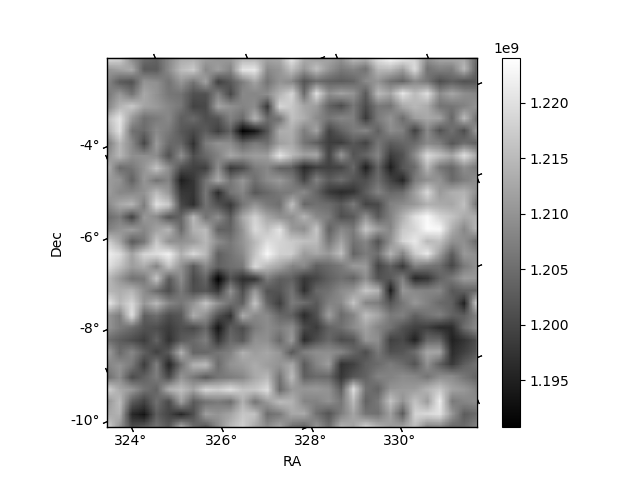
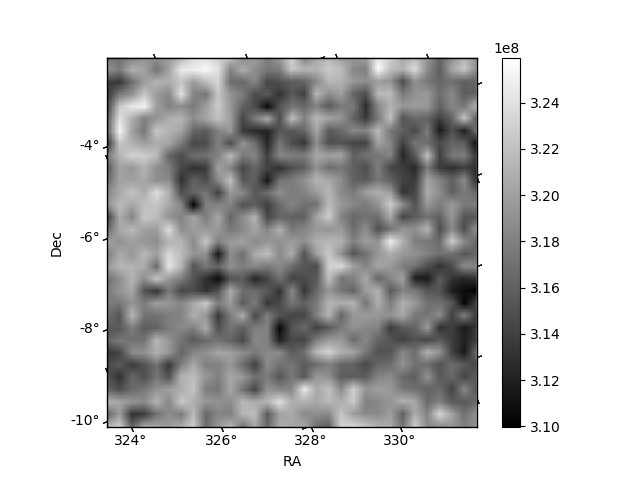
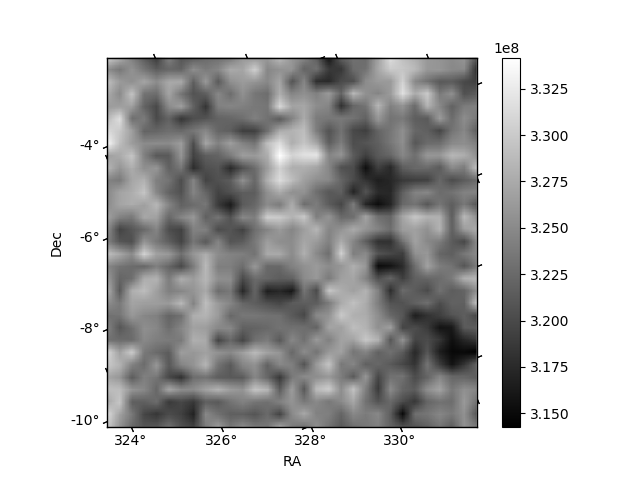
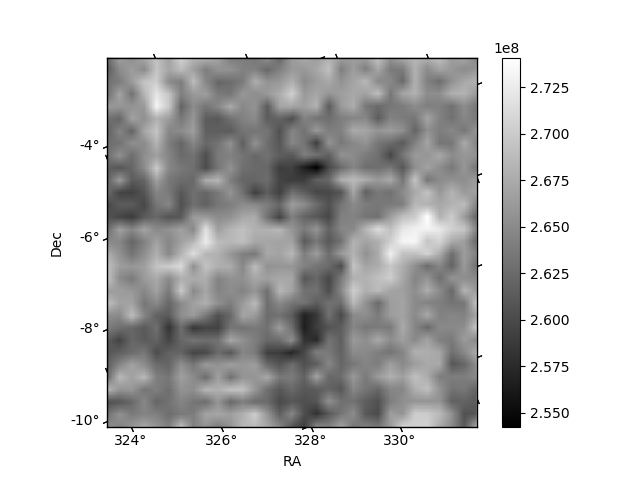
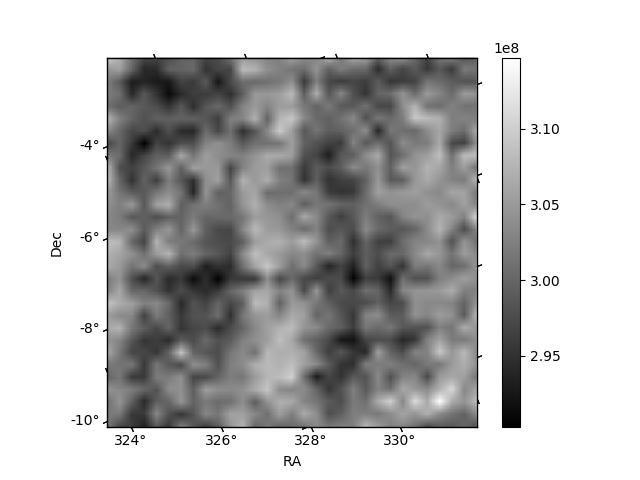
Histogram calculated using DETX and DETY for each event in the final _common_clean file
| Quadrant A |  |
 |
Quadrant B |
|---|---|---|---|
| Quadrant D | 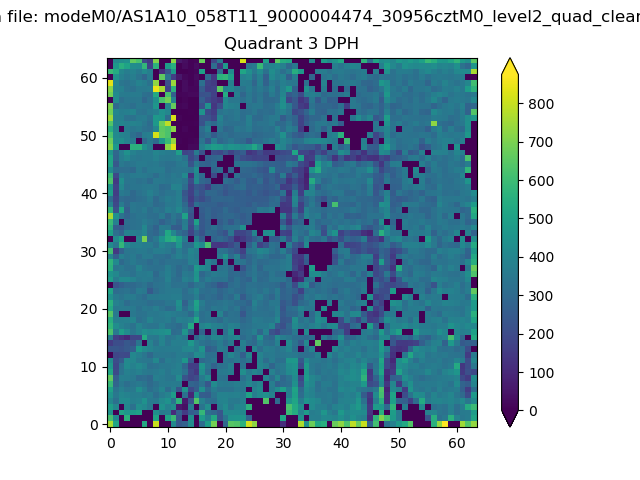 |
 |
Quadrant C |
| Plot type | Count rate plots | Images |
|---|---|---|
| Comparison with Poisson distribution Blue bars denote a histogram of data divided into 1 sec bins. Red curve is a Poisson curve with rate = median count rate of data. |
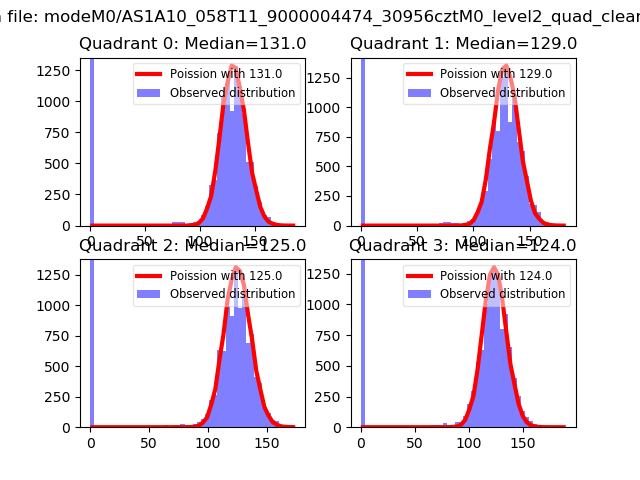 |
 |
| Quadrant-wise count rates Data is divided into 100 sec bins |
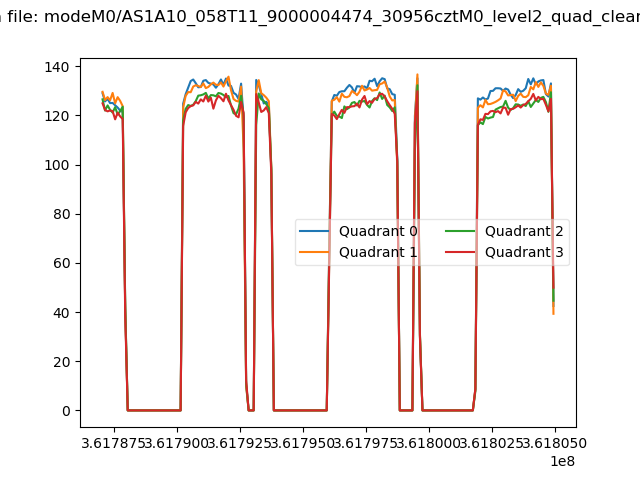 |
|
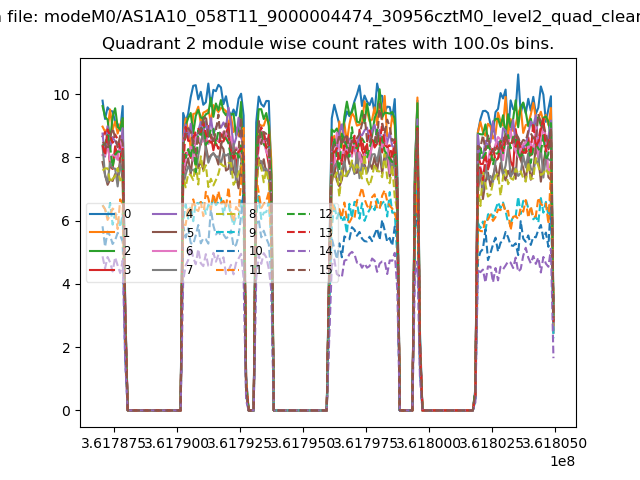
| Module-wise count rates for Quadrant A Data is divided into 100 sec bins |
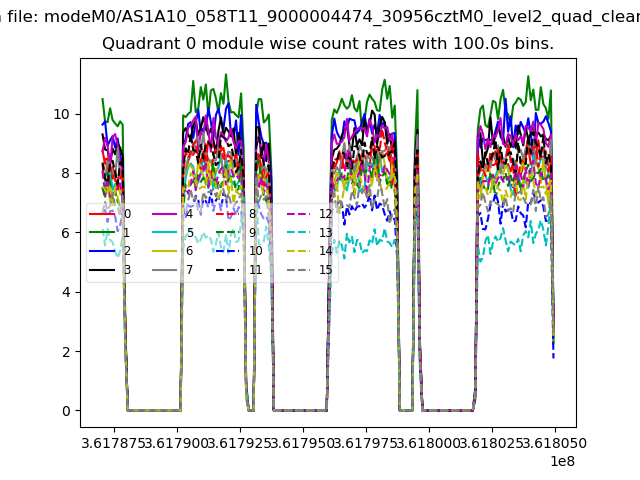 |
 |
| Module-wise count rates for Quadrant B Data is divided into 100 sec bins |
 |
 |
| Module-wise count rates for Quadrant C Data is divided into 100 sec bins |
 |
 |
| Module-wise count rates for Quadrant D Data is divided into 100 sec bins |
 |
 |
| Parameter | Plot |
|---|---|
| CZT HV Monitor | 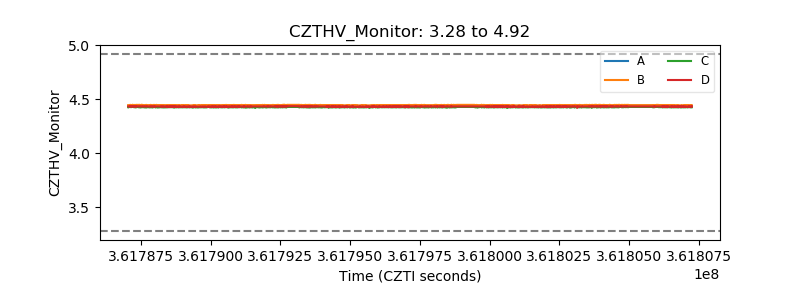 |
| D_VDD | 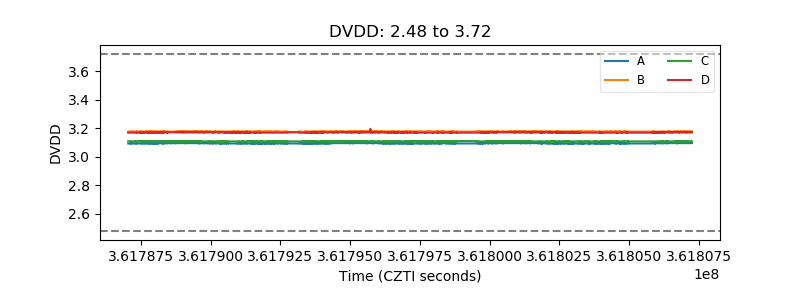 |
| Temperature 1 | 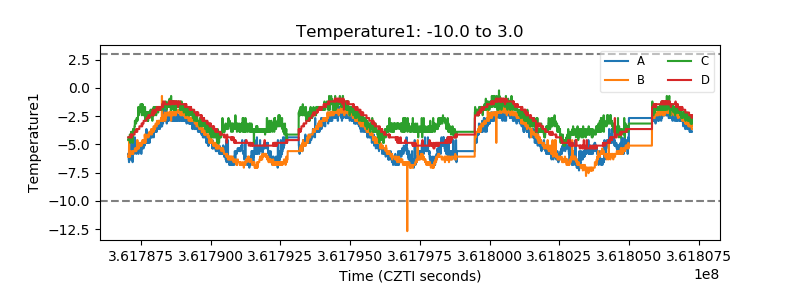 |
| Veto HV Monitor | 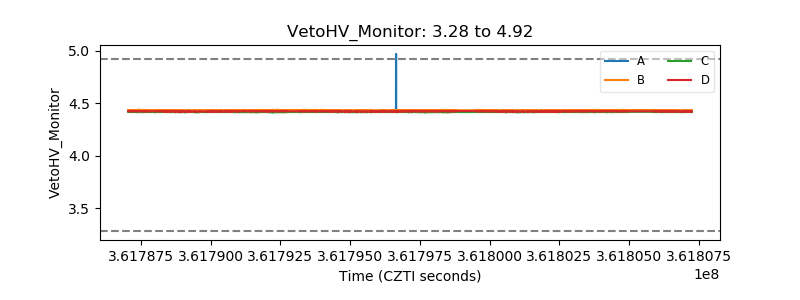 |
| Veto LLD | 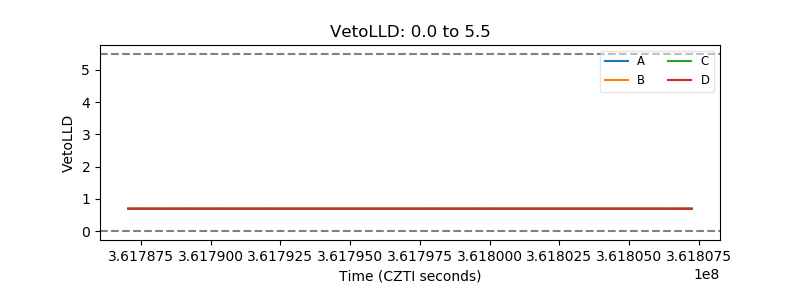 |
| Alpha Counter | 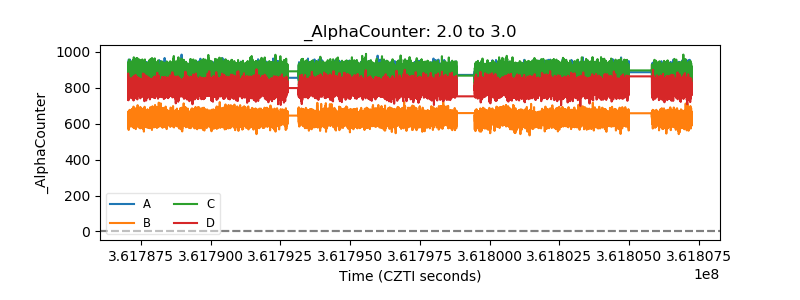 |
| _CPM_Rate | 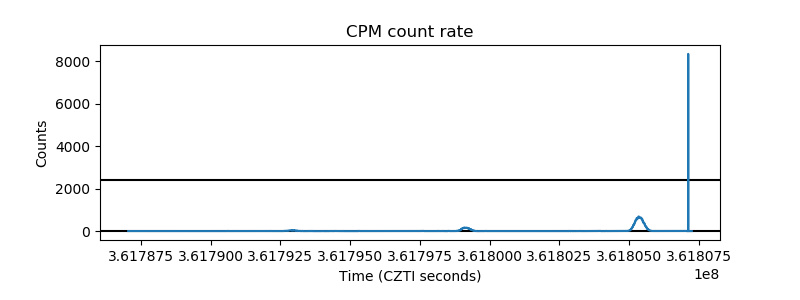 |
| CZT Counter | 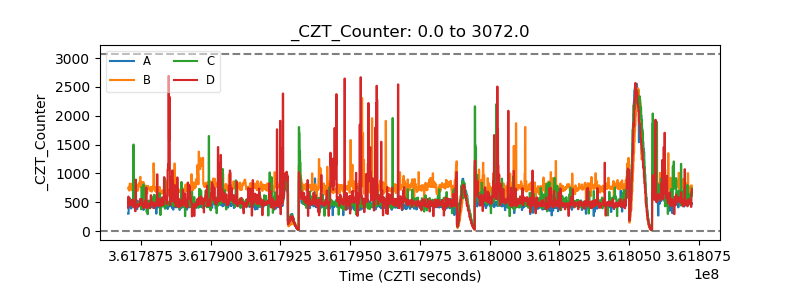 |
| +2.5 Volts monitor | 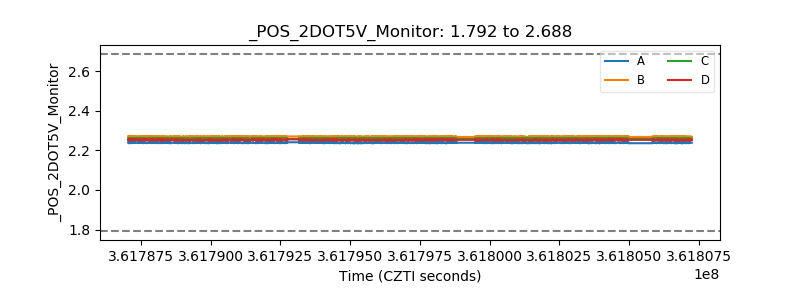 |
| +5 Volts monitor | 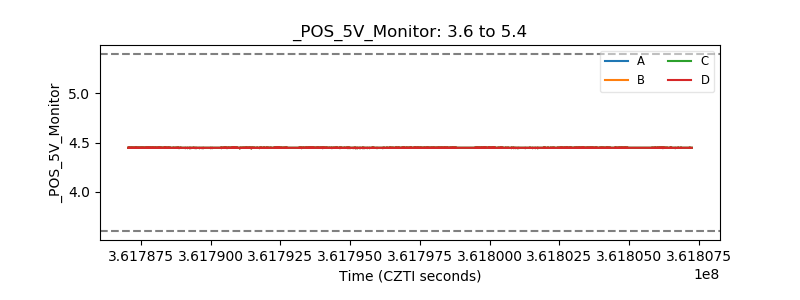 |
| _ROLL_ROT |  |
| _Roll_DEC | 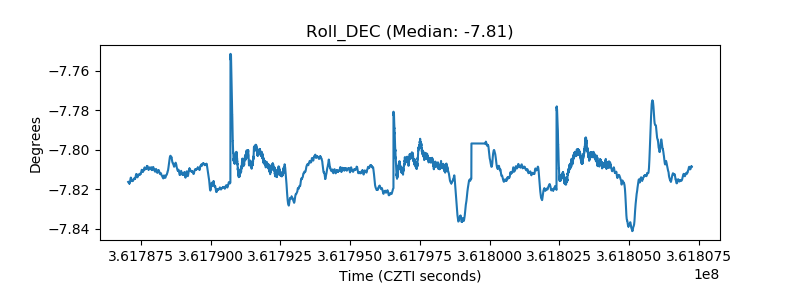 |
| _Roll_RA | 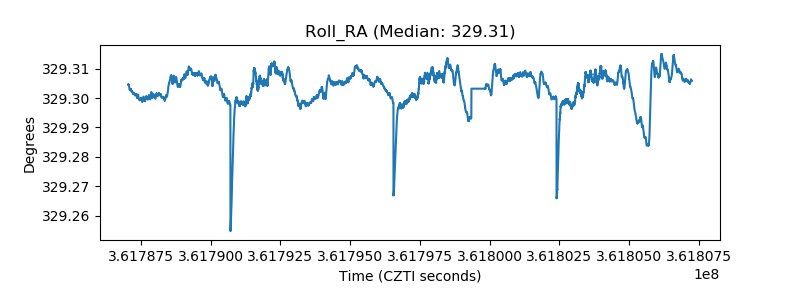 |
| Veto Counter | 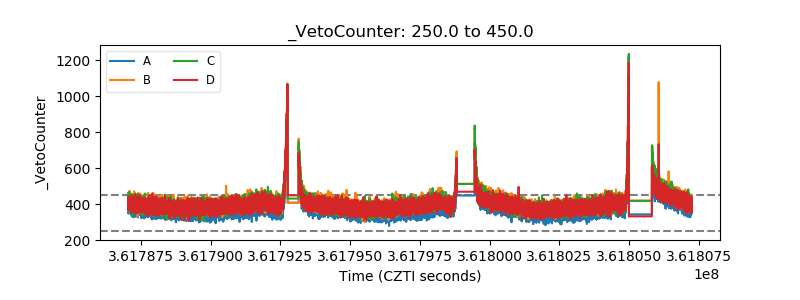 |