| Param | Original file | Final file |
|---|---|---|
| Filename | modeM0/AS1A10_058T11_9000004474_30957cztM0_level2.evt | modeM0/AS1A10_058T11_9000004474_30957cztM0_level2_quad_clean.evt |
| Size (bytes) | 857,718,720 | 104,664,960 |
| Size | 818.0 MB | 99.8 MB |
| Events in quadrant A | 4,595,699 | 650,708 |
| Events in quadrant B | 7,380,588 | 643,564 |
| Events in quadrant C | 6,080,916 | 619,268 |
| Events in quadrant D | 7,291,395 | 610,623 |
| Mode M9 | |||
|---|---|---|---|
| Quadrant | BADHDUFLAG | Total packets | Discarded packets |
| A | 0 | 14 | 0 |
| B | 0 | 15 | 0 |
| C | 0 | 15 | 0 |
| D | 0 | 15 | 0 |
| Mode M0 | |||
|---|---|---|---|
| Quadrant | BADHDUFLAG | Total packets | Discarded packets |
| A | 0 | 19580 | 4 |
| B | 0 | 28614 | 4 |
| C | 0 | 24321 | 5 |
| D | 0 | 27907 | 4 |
| Mode SS | |||
|---|---|---|---|
| Quadrant | BADHDUFLAG | Total packets | Discarded packets |
| A | 0 | 190 | 0 |
| B | 0 | 190 | 0 |
| C | 0 | 190 | 0 |
| D | 0 | 190 | 0 |
| Quadrant | Total seconds | Saturated seconds | Saturation percentage |
|---|---|---|---|
| A | 9297 | 251 | 2.699796% |
| B | 9297 | 390 | 4.194902% |
| C | 9296 | 461 | 4.959122% |
| D | 9296 | 467 | 5.023666% |
Noise dominated data is calculated using 1-second bins in cleaned event files. If a bin has >2000 counts, and if more than 50% of those come from <1% of pixels, then it is considered to be noise-dominated and hence unusable.
| Quadrant | # 1 sec bins | Bins with >0 counts | Bins with >2000 counts | High rate bins dominated by noise | Noise dominated (total time) | Noise dominated (detector-on time) | Marked lightcurve |
|---|---|---|---|---|---|---|---|
| A | 27286 | 9298 | 0 | 0 | 0.00% | 0.00% | 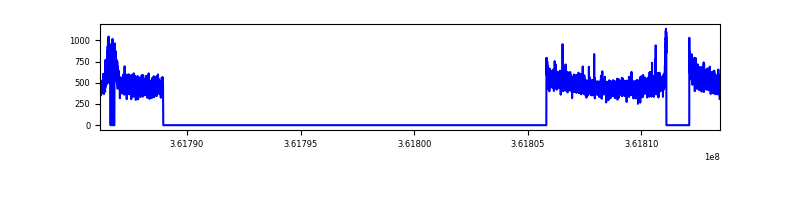 |
| B | 27286 | 9298 | 6 | 6 | 0.02% | 0.06% | 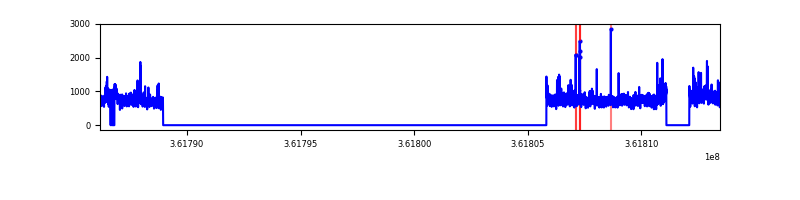 |
| C | 27286 | 9297 | 55 | 55 | 0.20% | 0.59% | 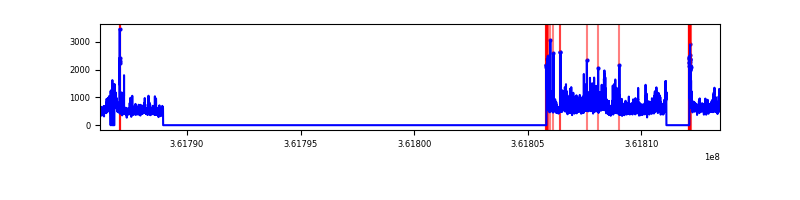 |
| D | 27286 | 9298 | 206 | 206 | 0.75% | 2.22% | 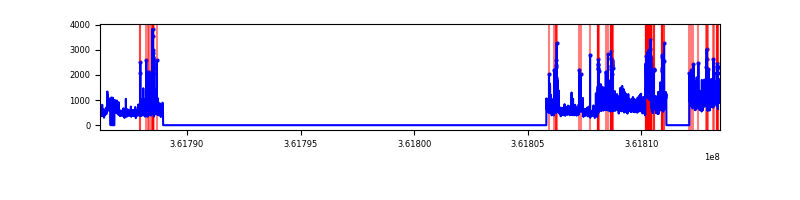 |
Top three noisy pixels from each quadrant. If the there are fewer than three noisy pixels in the level2.evt file, extra rows are filled as -1
| Pixel properties | Quadrant properties | ||||||
|---|---|---|---|---|---|---|---|
| Quadrant | DetID | PixID | Counts | Sigma | Mean | Median | Sigma |
| A | 13 | 254 | 15411 | 59.22 | 1191 | 1163 | 240.6 |
| A | 3 | 137 | 12165 | 45.73 | 1191 | 1163 | 240.6 |
| A | 0 | 226 | 9790 | 35.86 | 1191 | 1163 | 240.6 |
| B | 6 | 159 | 2569690 | 11464.05 | 1164 | 1133 | 224.1 |
| B | 0 | 183 | 64918 | 284.69 | 1164 | 1133 | 224.1 |
| B | 0 | 190 | 50147 | 218.76 | 1164 | 1133 | 224.1 |
| C | 3 | 233 | 1105720 | 4163.48 | 1126 | 1134 | 265.3 |
| C | 0 | 10 | 383904 | 1442.76 | 1126 | 1134 | 265.3 |
| C | 14 | 238 | 179448 | 672.11 | 1126 | 1134 | 265.3 |
| D | 13 | 174 | 2173714 | 7947.94 | 1147 | 1118 | 273.4 |
| D | 8 | 195 | 411210 | 1500.23 | 1147 | 1118 | 273.4 |
| D | 2 | 250 | 246807 | 898.79 | 1147 | 1118 | 273.4 |
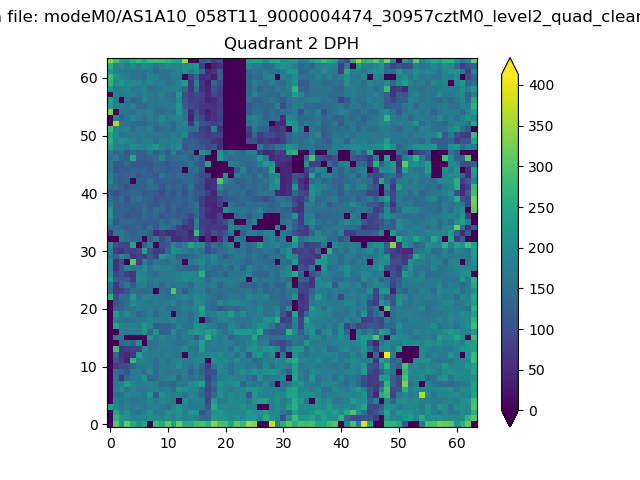
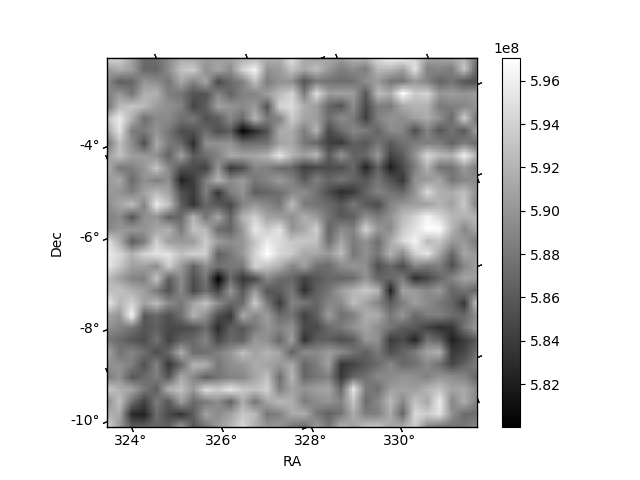
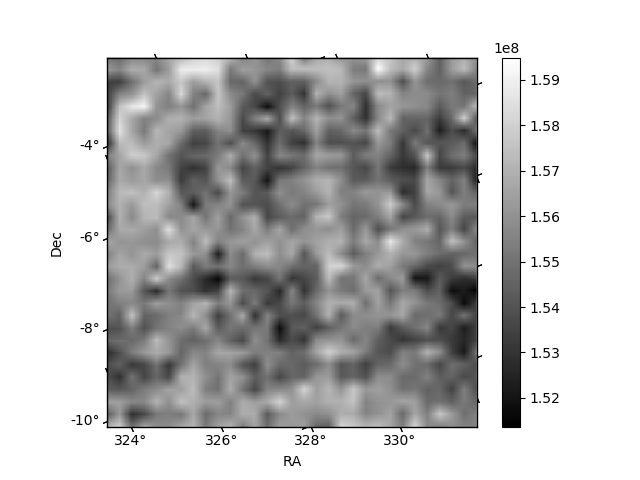
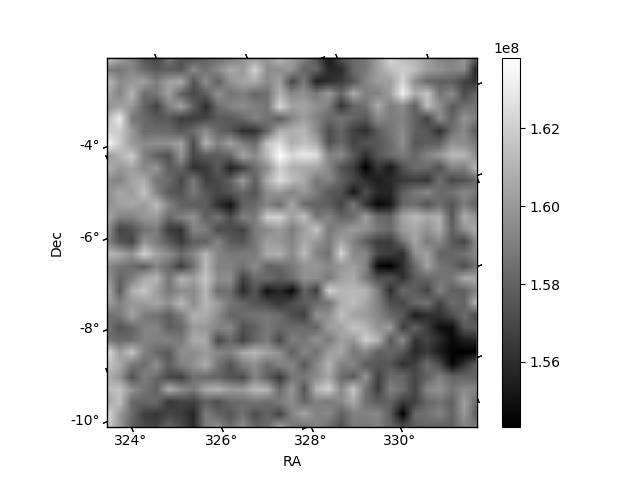
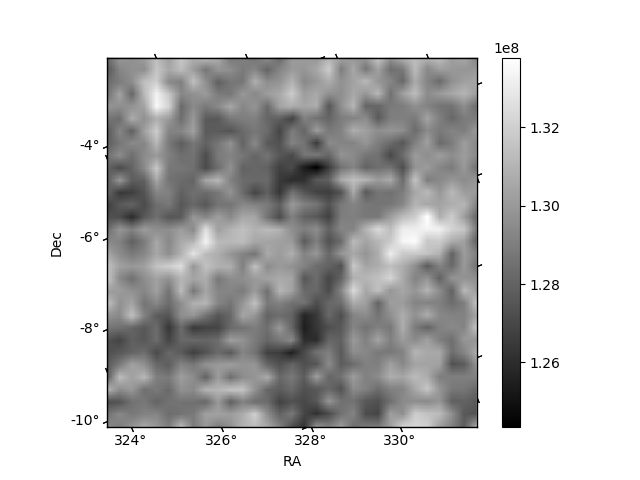
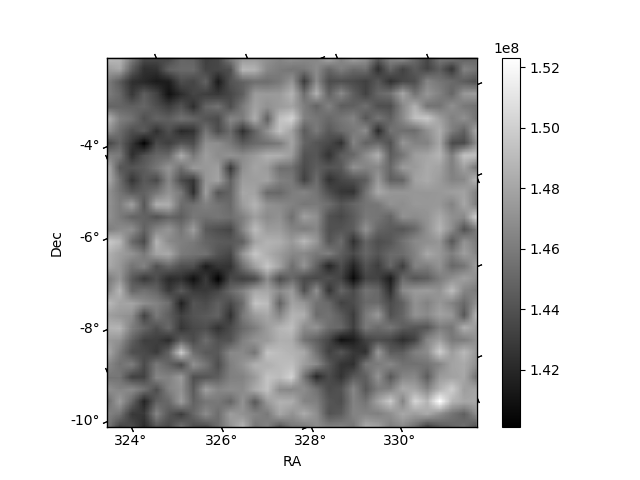
Histogram calculated using DETX and DETY for each event in the final _common_clean file
| Quadrant A | 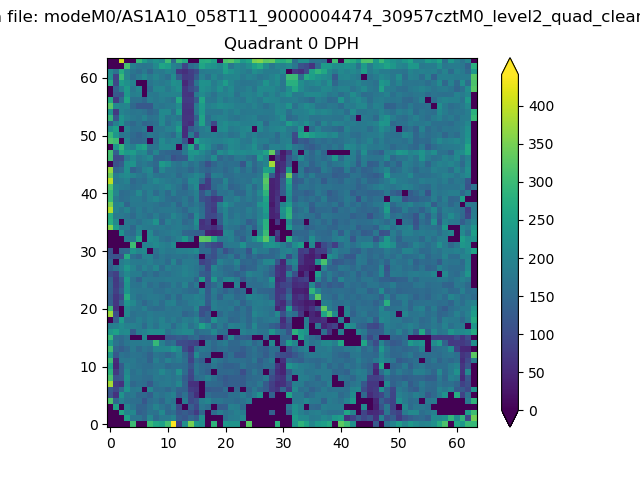 |
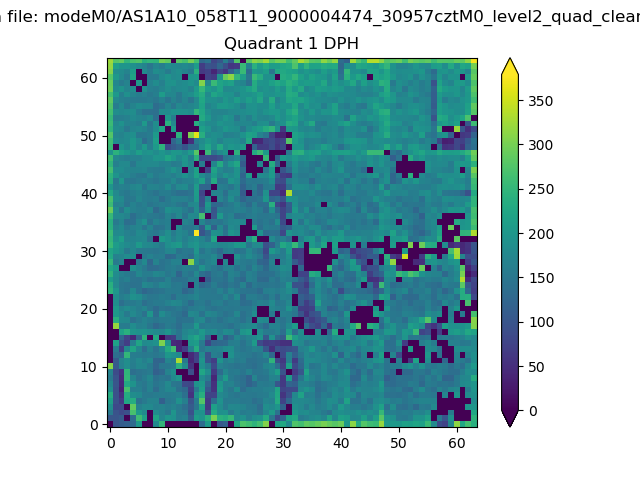 |
Quadrant B |
|---|---|---|---|
| Quadrant D | 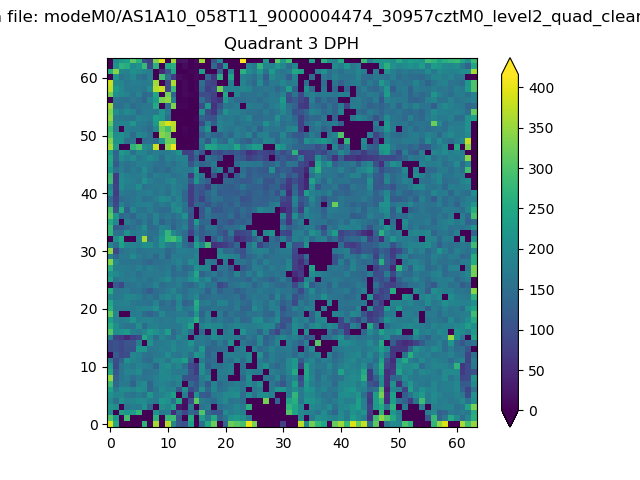 |
 |
Quadrant C |
| Plot type | Count rate plots | Images |
|---|---|---|
| Comparison with Poisson distribution Blue bars denote a histogram of data divided into 1 sec bins. Red curve is a Poisson curve with rate = median count rate of data. |
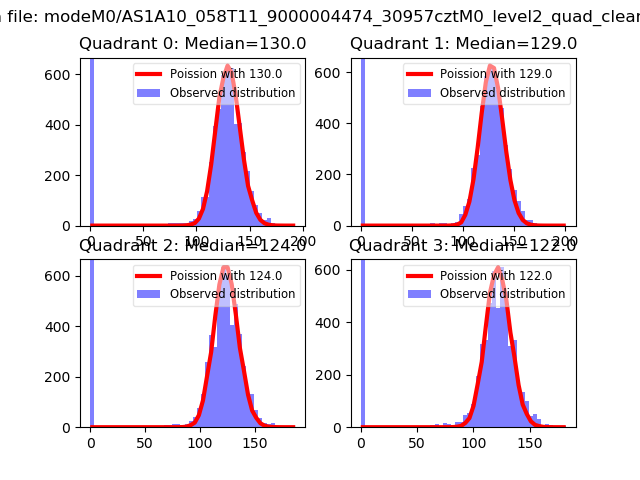 |
 |
| Quadrant-wise count rates Data is divided into 100 sec bins |
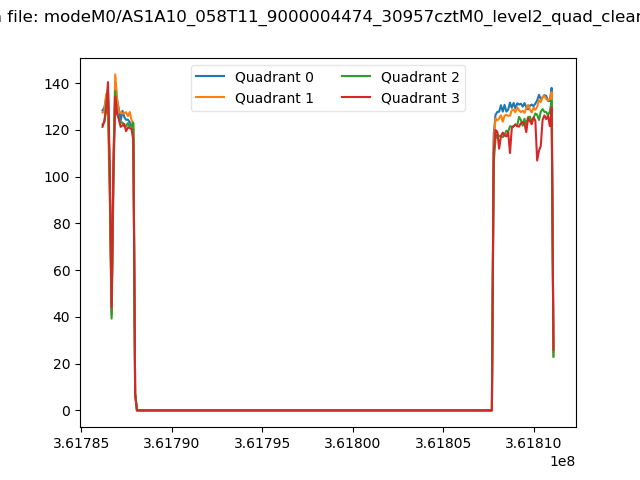 |
|
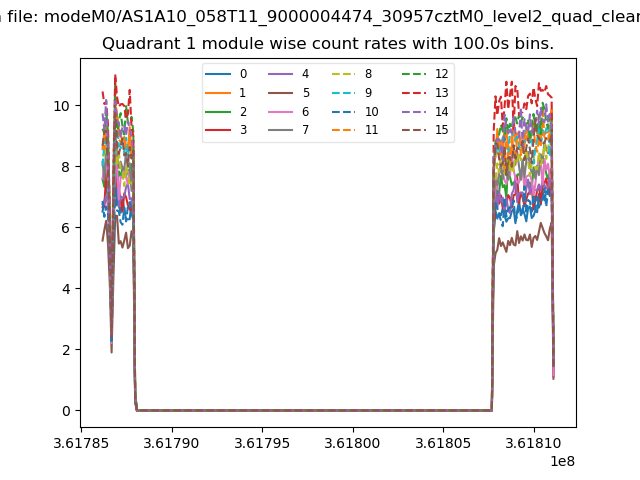
| Module-wise count rates for Quadrant A Data is divided into 100 sec bins |
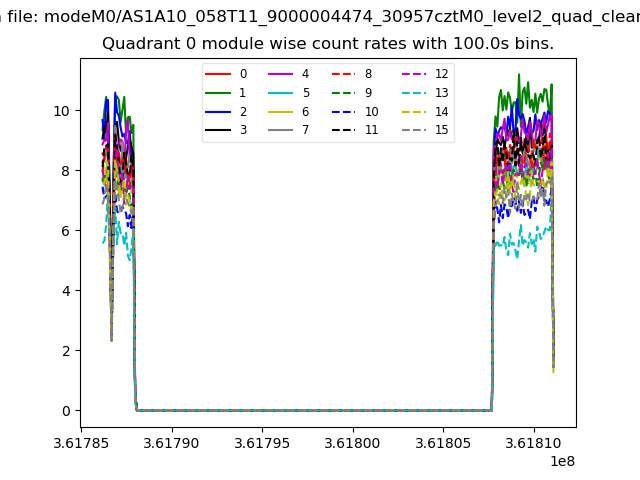 |
 |
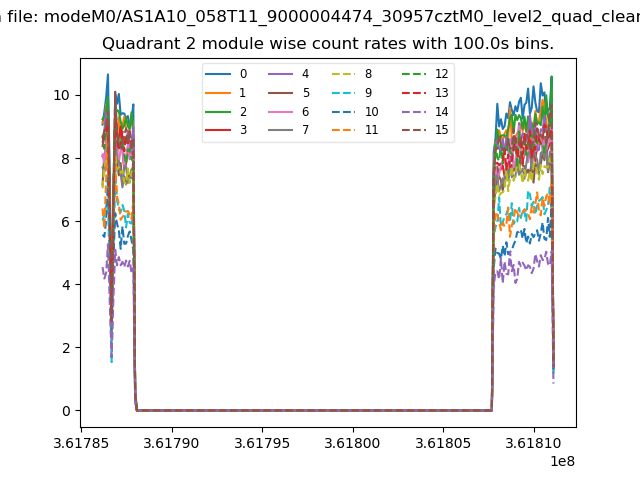
| Module-wise count rates for Quadrant B Data is divided into 100 sec bins |
 |
 |
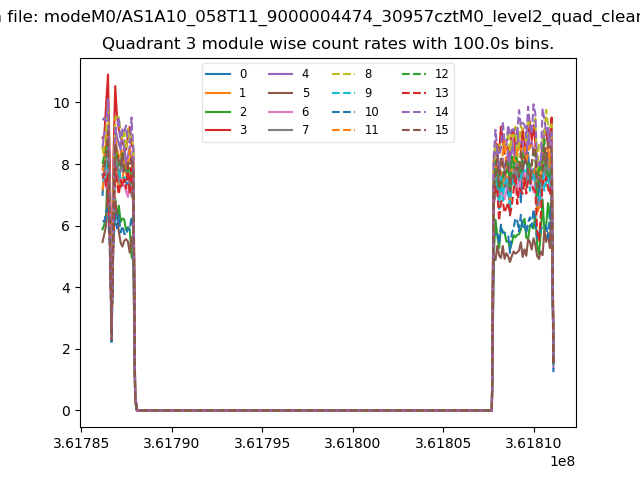
| Module-wise count rates for Quadrant C Data is divided into 100 sec bins |
 |
 |
| Module-wise count rates for Quadrant D Data is divided into 100 sec bins |
 |
 |
| Parameter | Plot |
|---|---|
| CZT HV Monitor |  |
| D_VDD | 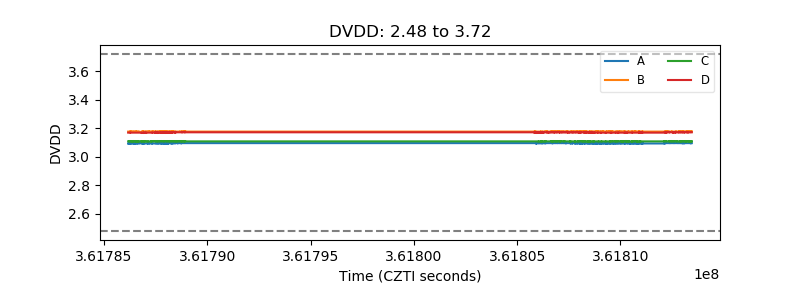 |
| Temperature 1 | 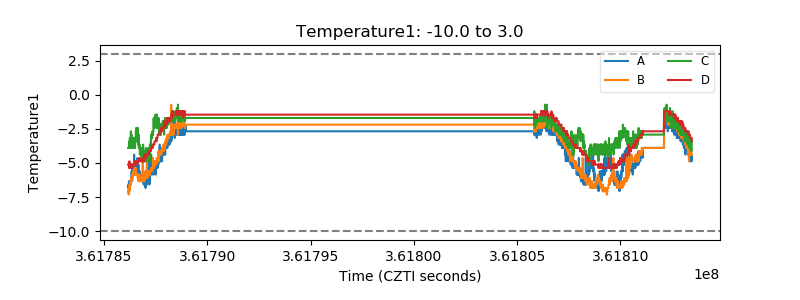 |
| Veto HV Monitor | 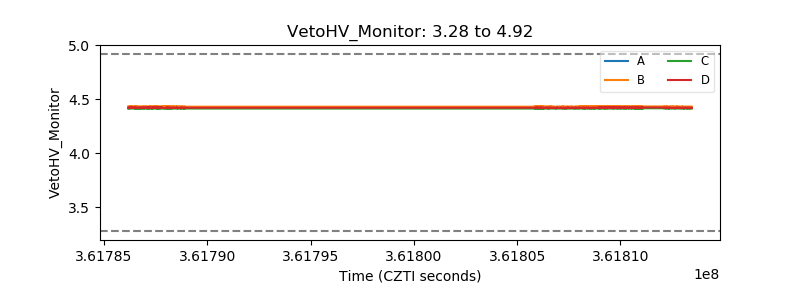 |
| Veto LLD | 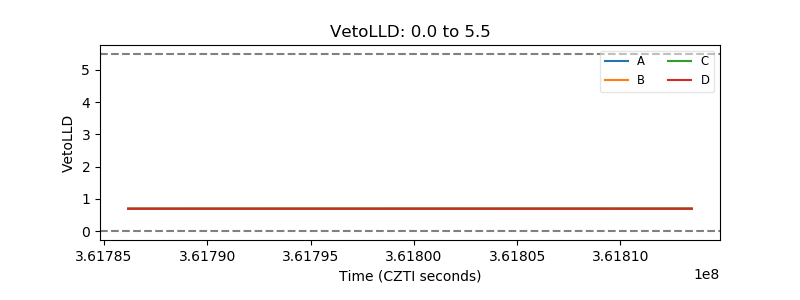 |
| Alpha Counter | 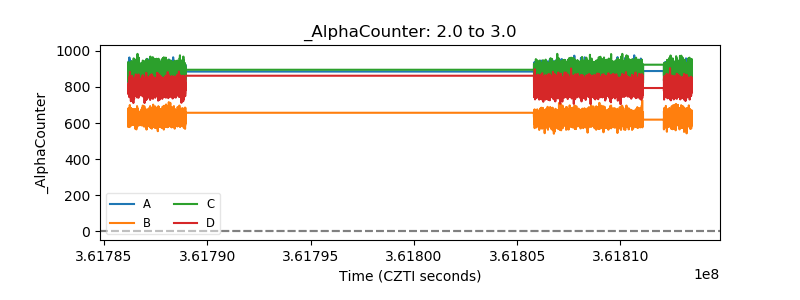 |
| _CPM_Rate | 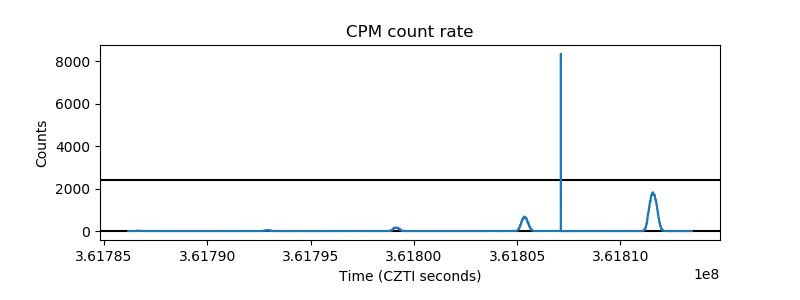 |
| CZT Counter | 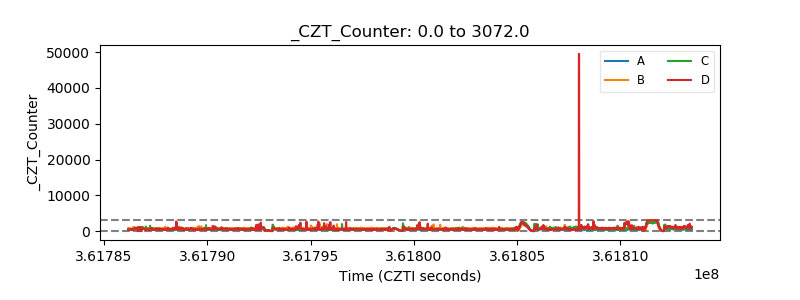 |
| +2.5 Volts monitor |  |
| +5 Volts monitor |  |
| _ROLL_ROT | 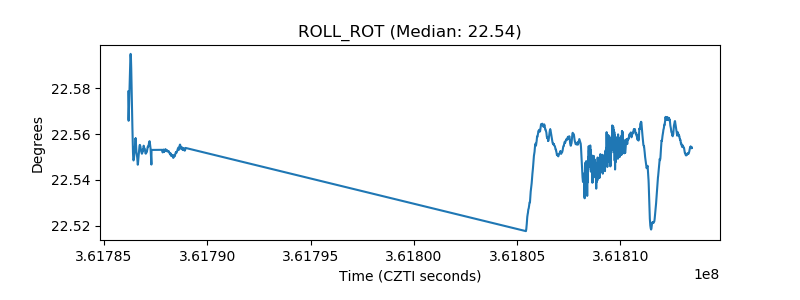 |
| _Roll_DEC | 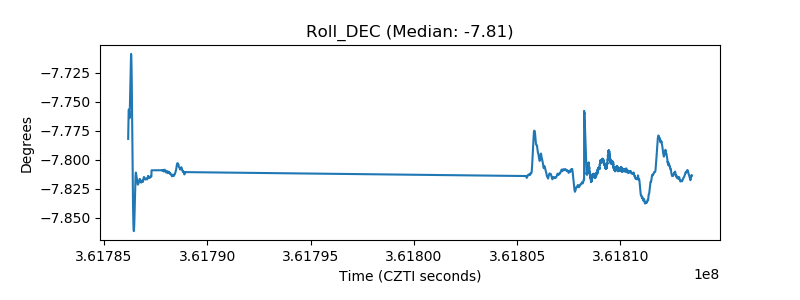 |
| _Roll_RA | 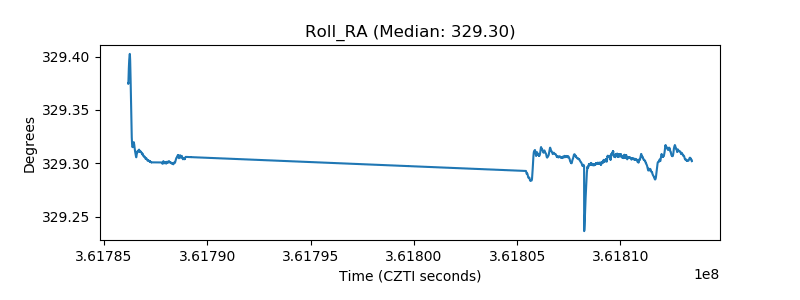 |
| Veto Counter | 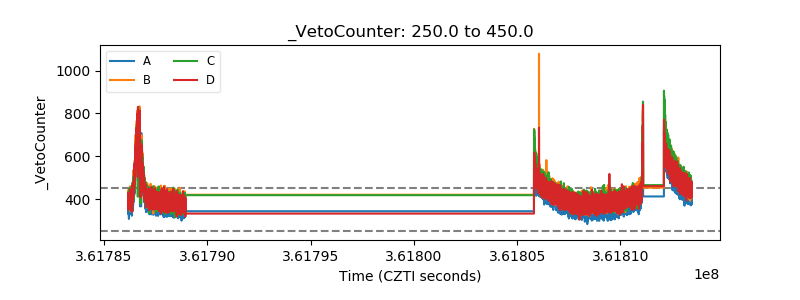 |