| Param | Original file | Final file |
|---|---|---|
| Filename | modeM0/AS1A10_058T11_9000004474_30959cztM0_level2.evt | modeM0/AS1A10_058T11_9000004474_30959cztM0_level2_quad_clean.evt |
| Size (bytes) | 691,796,160 | 81,201,600 |
| Size | 659.7 MB | 77.4 MB |
| Events in quadrant A | 3,322,117 | 520,528 |
| Events in quadrant B | 5,609,180 | 515,445 |
| Events in quadrant C | 4,368,381 | 494,667 |
| Events in quadrant D | 7,216,452 | 477,814 |
| Mode M9 | |||
|---|---|---|---|
| Quadrant | BADHDUFLAG | Total packets | Discarded packets |
| A | 0 | 20 | 0 |
| B | 0 | 21 | 0 |
| C | 0 | 21 | 0 |
| D | 0 | 21 | 0 |
| Mode M0 | |||
|---|---|---|---|
| Quadrant | BADHDUFLAG | Total packets | Discarded packets |
| A | 0 | 14029 | 2 |
| B | 0 | 20970 | 3 |
| C | 0 | 17534 | 2 |
| D | 0 | 26039 | 2 |
| Mode SS | |||
|---|---|---|---|
| Quadrant | BADHDUFLAG | Total packets | Discarded packets |
| A | 0 | 130 | 0 |
| B | 0 | 130 | 0 |
| C | 0 | 130 | 0 |
| D | 0 | 130 | 0 |
| Quadrant | Total seconds | Saturated seconds | Saturation percentage |
|---|---|---|---|
| A | 6461 | 44 | 0.681009% |
| B | 6460 | 291 | 4.504644% |
| C | 6460 | 256 | 3.962848% |
| D | 6460 | 359 | 5.557276% |
Noise dominated data is calculated using 1-second bins in cleaned event files. If a bin has >2000 counts, and if more than 50% of those come from <1% of pixels, then it is considered to be noise-dominated and hence unusable.
| Quadrant | # 1 sec bins | Bins with >0 counts | Bins with >2000 counts | High rate bins dominated by noise | Noise dominated (total time) | Noise dominated (detector-on time) | Marked lightcurve |
|---|---|---|---|---|---|---|---|
| A | 7606 | 6461 | 0 | 0 | 0.00% | 0.00% | 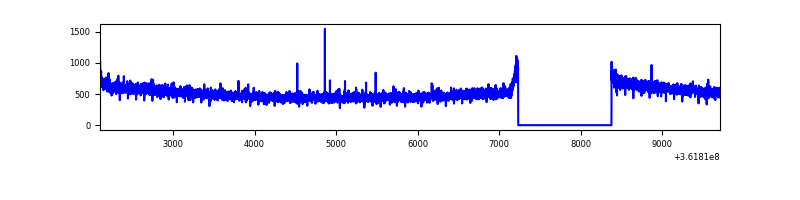 |
| B | 7605 | 6460 | 93 | 93 | 1.22% | 1.44% | 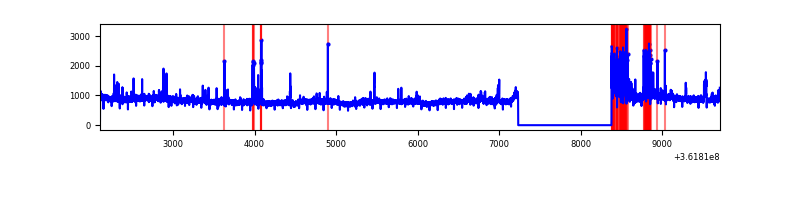 |
| C | 7605 | 6460 | 72 | 72 | 0.95% | 1.11% | 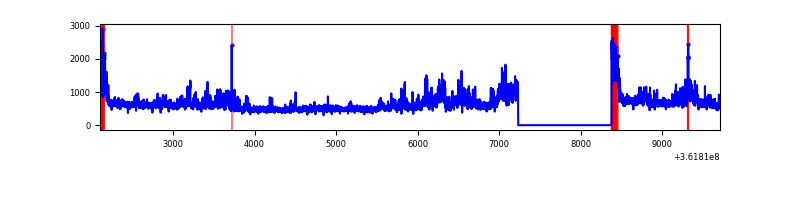 |
| D | 7605 | 6460 | 158 | 158 | 2.08% | 2.45% | 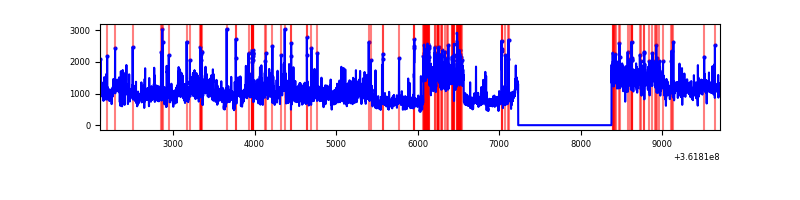 |
Top three noisy pixels from each quadrant. If the there are fewer than three noisy pixels in the level2.evt file, extra rows are filled as -1
| Pixel properties | Quadrant properties | ||||||
|---|---|---|---|---|---|---|---|
| Quadrant | DetID | PixID | Counts | Sigma | Mean | Median | Sigma |
| A | 13 | 254 | 11289 | 60.73 | 859 | 843 | 172.0 |
| A | 3 | 137 | 8338 | 43.58 | 859 | 843 | 172.0 |
| A | 11 | 47 | 7699 | 39.86 | 859 | 843 | 172.0 |
| B | 6 | 159 | 1856019 | 11713.6 | 837 | 816 | 158.4 |
| B | 4 | 80 | 312087 | 1965.34 | 837 | 816 | 158.4 |
| B | 0 | 183 | 48890 | 303.54 | 837 | 816 | 158.4 |
| C | 3 | 233 | 680695 | 3594.2 | 815 | 823 | 189.2 |
| C | 0 | 10 | 350479 | 1848.48 | 815 | 823 | 189.2 |
| C | 14 | 238 | 132804 | 697.73 | 815 | 823 | 189.2 |
| D | 13 | 174 | 3755857 | 19125.22 | 822 | 800 | 196.3 |
| D | 8 | 195 | 291269 | 1479.41 | 822 | 800 | 196.3 |
| D | 2 | 250 | 30942 | 153.52 | 822 | 800 | 196.3 |
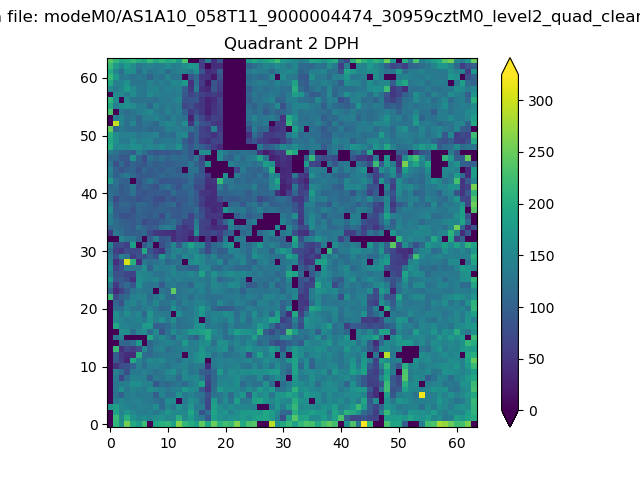
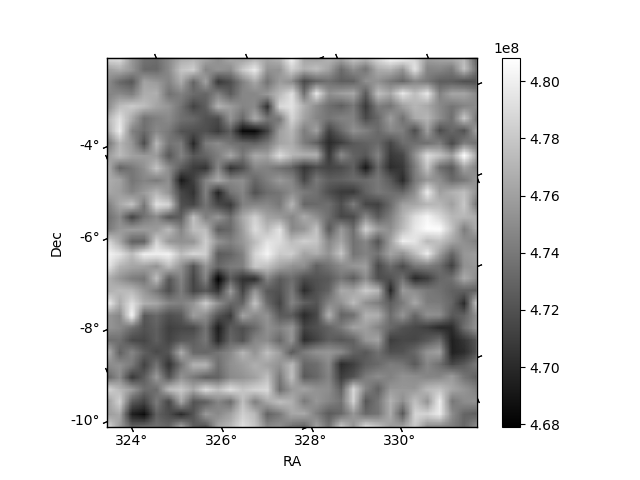
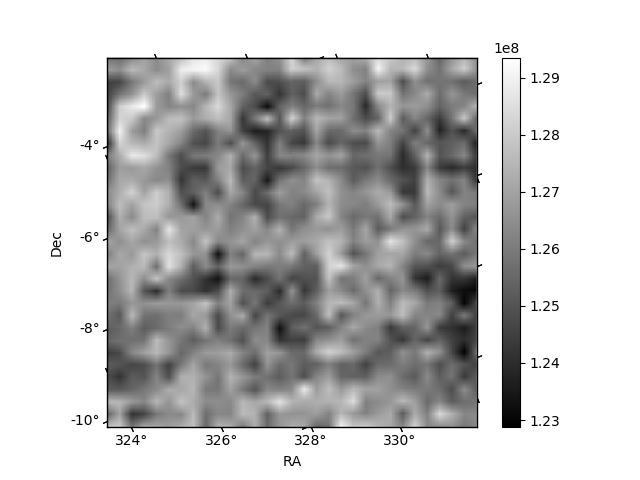
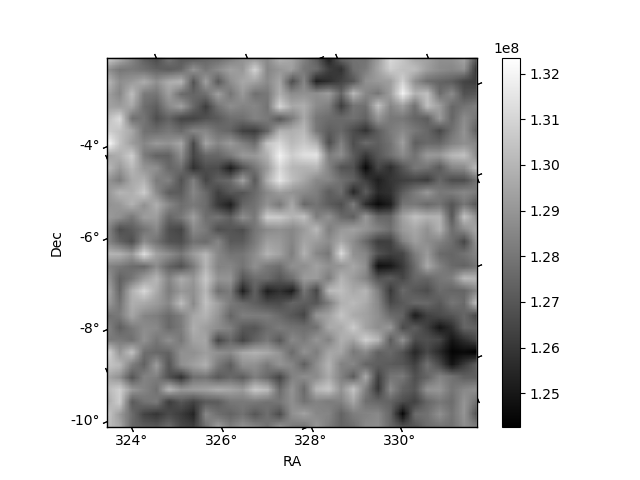
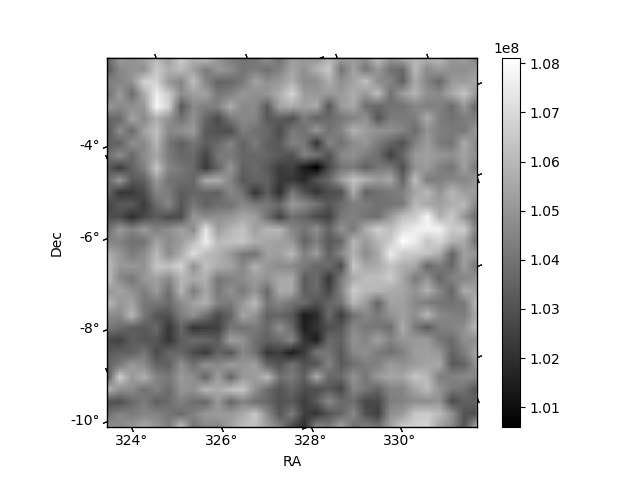
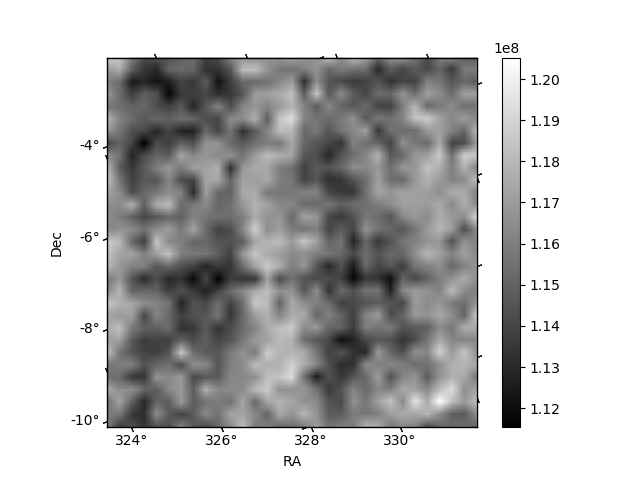
Histogram calculated using DETX and DETY for each event in the final _common_clean file
| Quadrant A | 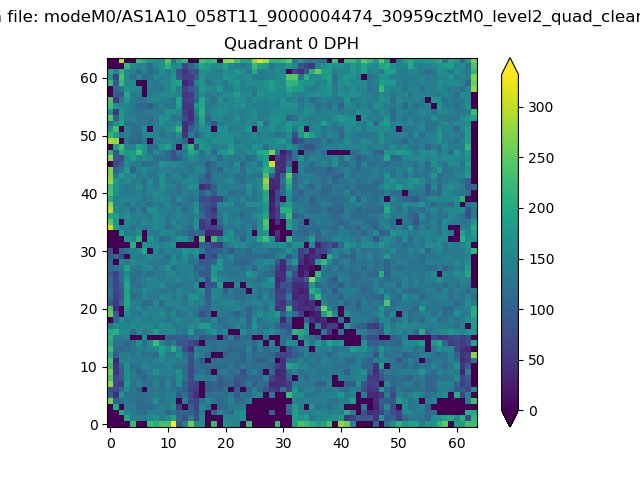 |
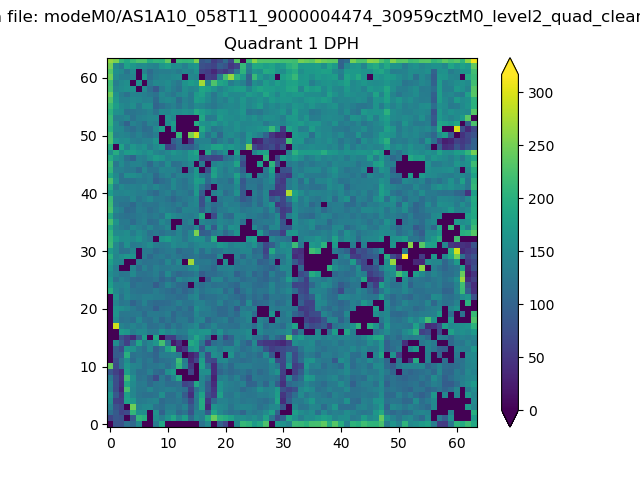 |
Quadrant B |
|---|---|---|---|
| Quadrant D | 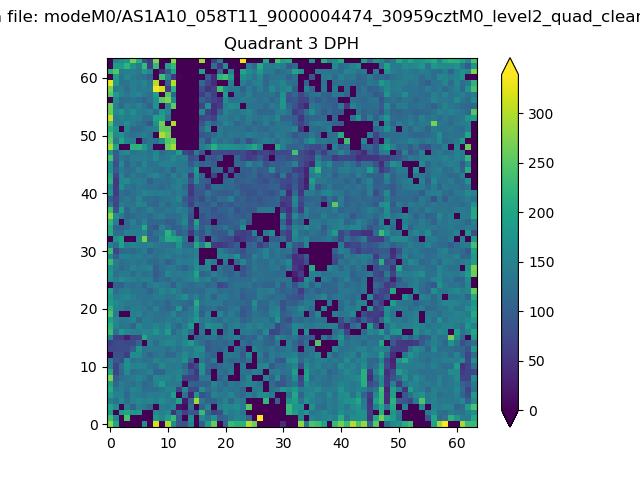 |
 |
Quadrant C |
| Plot type | Count rate plots | Images |
|---|---|---|
| Comparison with Poisson distribution Blue bars denote a histogram of data divided into 1 sec bins. Red curve is a Poisson curve with rate = median count rate of data. |
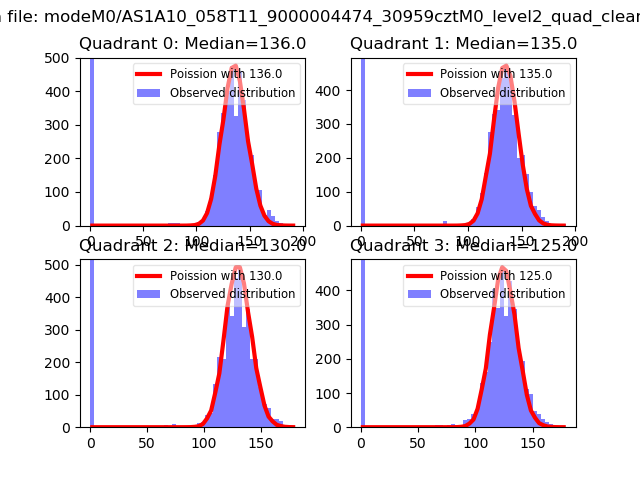 |
 |
| Quadrant-wise count rates Data is divided into 100 sec bins |
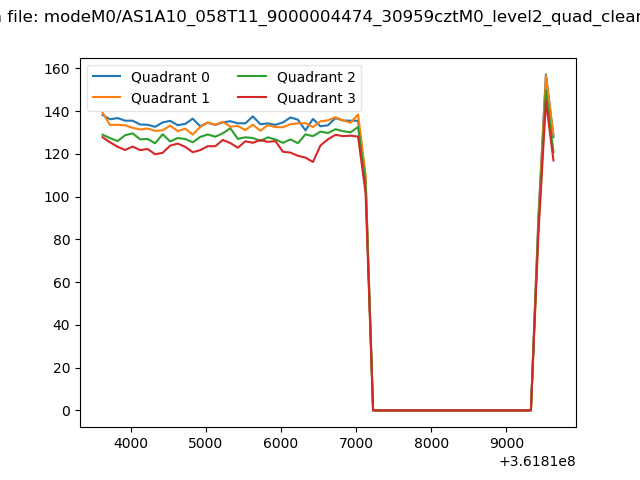 |
|
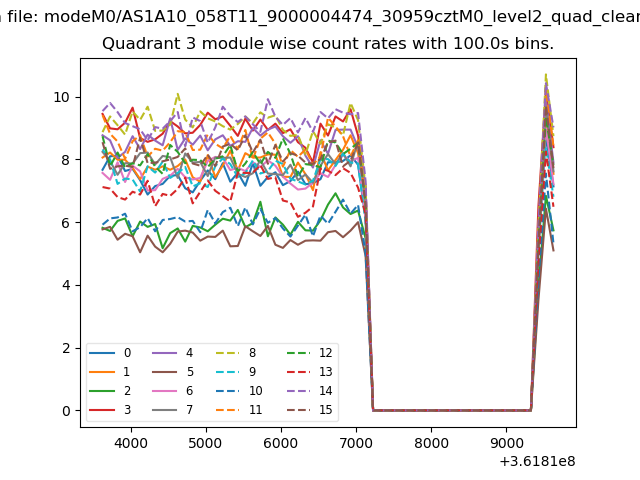
| Module-wise count rates for Quadrant A Data is divided into 100 sec bins |
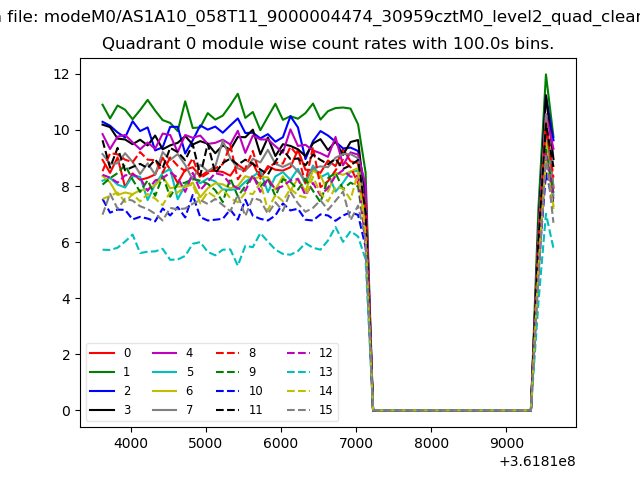 |
 |
| Module-wise count rates for Quadrant B Data is divided into 100 sec bins |
 |
 |
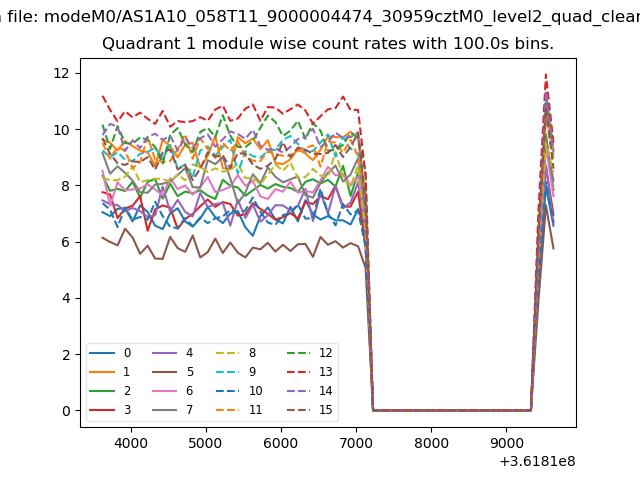
| Module-wise count rates for Quadrant C Data is divided into 100 sec bins |
 |
 |
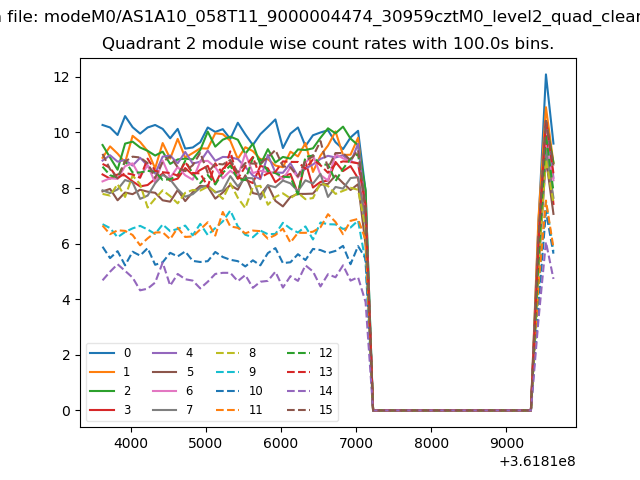
| Module-wise count rates for Quadrant D Data is divided into 100 sec bins |
 |
 |
| Parameter | Plot |
|---|---|
| CZT HV Monitor | 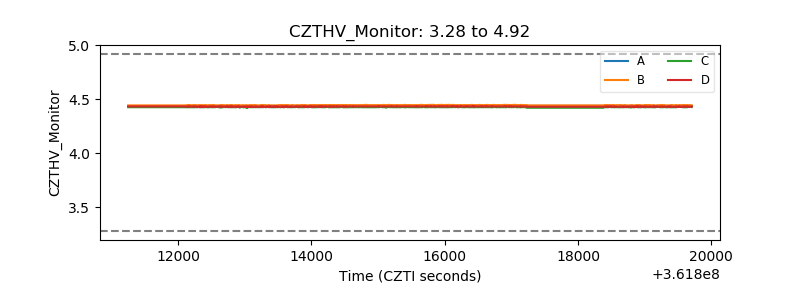 |
| D_VDD | 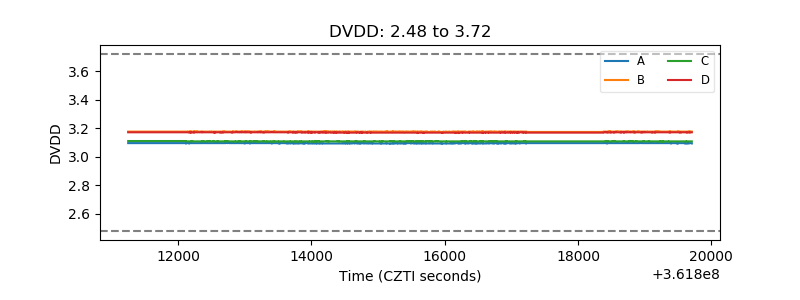 |
| Temperature 1 | 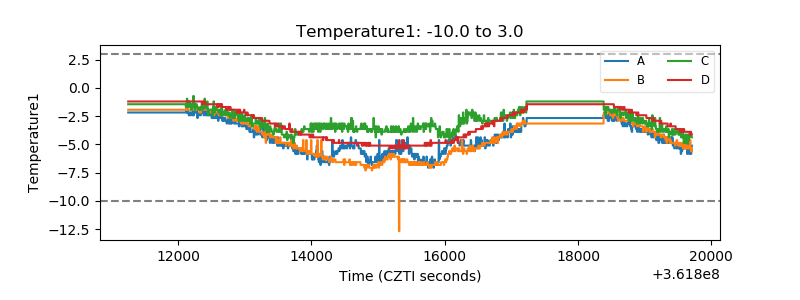 |
| Veto HV Monitor | 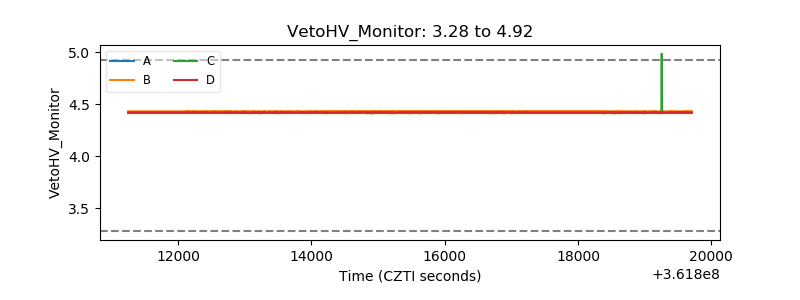 |
| Veto LLD | 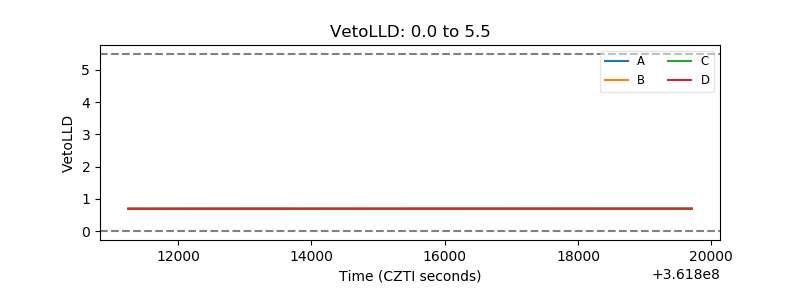 |
| Alpha Counter | 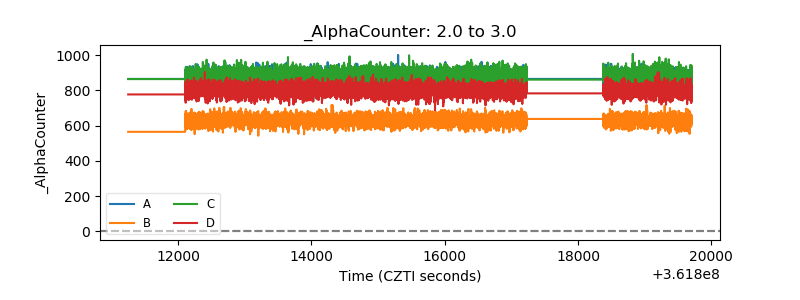 |
| _CPM_Rate |  |
| CZT Counter | 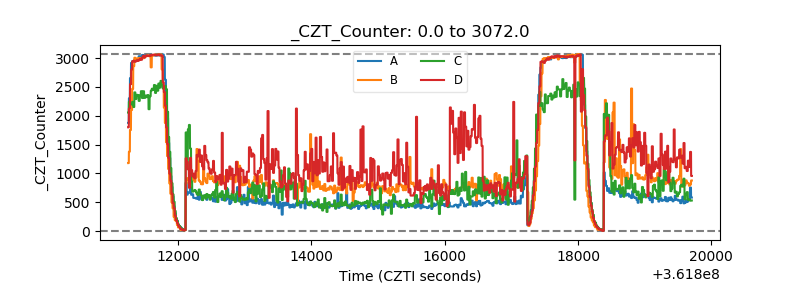 |
| +2.5 Volts monitor |  |
| +5 Volts monitor |  |
| _ROLL_ROT | 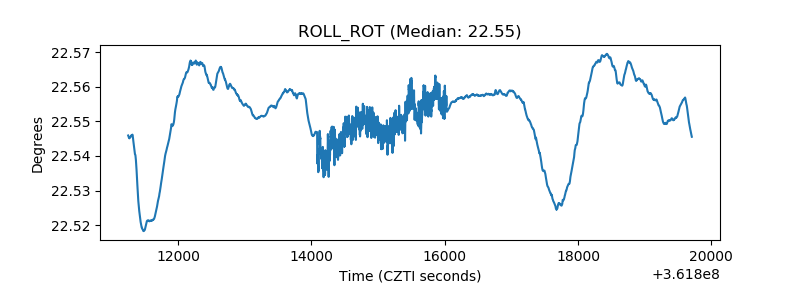 |
| _Roll_DEC | 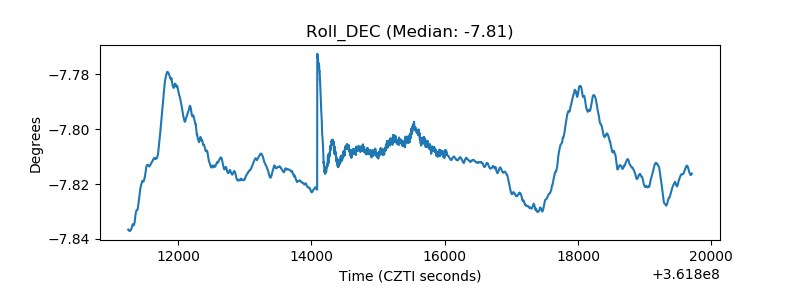 |
| _Roll_RA | 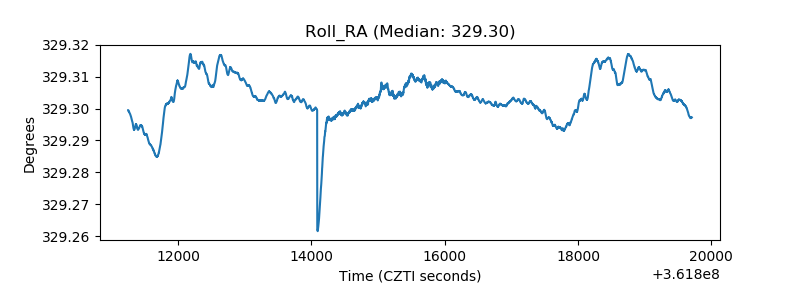 |
| Veto Counter | 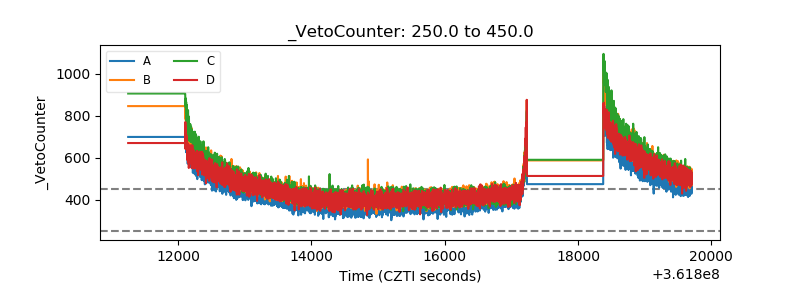 |