| Param | Original file | Final file |
|---|---|---|
| Filename | modeM0/AS1A10_058T11_9000004474_30960cztM0_level2.evt | modeM0/AS1A10_058T11_9000004474_30960cztM0_level2_quad_clean.evt |
| Size (bytes) | 609,759,360 | 93,072,960 |
| Size | 581.5 MB | 88.8 MB |
| Events in quadrant A | 3,154,736 | 618,333 |
| Events in quadrant B | 5,174,522 | 612,086 |
| Events in quadrant C | 3,728,212 | 596,361 |
| Events in quadrant D | 6,005,861 | 574,574 |
| Mode M9 | |||
|---|---|---|---|
| Quadrant | BADHDUFLAG | Total packets | Discarded packets |
| A | 0 | 12 | 0 |
| B | 0 | 12 | 0 |
| C | 0 | 12 | 0 |
| D | 0 | 12 | 0 |
| Mode M0 | |||
|---|---|---|---|
| Quadrant | BADHDUFLAG | Total packets | Discarded packets |
| A | 0 | 13175 | 1 |
| B | 0 | 19276 | 1 |
| C | 0 | 14940 | 2 |
| D | 0 | 22104 | 1 |
| Mode SS | |||
|---|---|---|---|
| Quadrant | BADHDUFLAG | Total packets | Discarded packets |
| A | 0 | 122 | 0 |
| B | 0 | 122 | 0 |
| C | 0 | 122 | 0 |
| D | 0 | 122 | 0 |
| Quadrant | Total seconds | Saturated seconds | Saturation percentage |
|---|---|---|---|
| A | 5972 | 38 | 0.636303% |
| B | 5973 | 173 | 2.896367% |
| C | 5972 | 175 | 2.930342% |
| D | 5972 | 260 | 4.353650% |
Noise dominated data is calculated using 1-second bins in cleaned event files. If a bin has >2000 counts, and if more than 50% of those come from <1% of pixels, then it is considered to be noise-dominated and hence unusable.
| Quadrant | # 1 sec bins | Bins with >0 counts | Bins with >2000 counts | High rate bins dominated by noise | Noise dominated (total time) | Noise dominated (detector-on time) | Marked lightcurve |
|---|---|---|---|---|---|---|---|
| A | 7227 | 5972 | 0 | 0 | 0.00% | 0.00% | 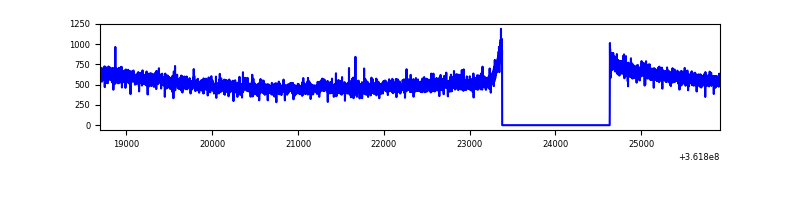 |
| B | 7228 | 5973 | 45 | 45 | 0.62% | 0.75% | 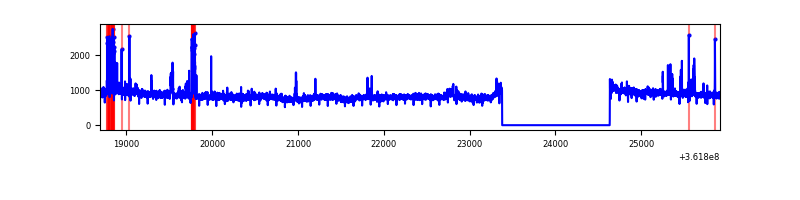 |
| C | 7227 | 5972 | 52 | 52 | 0.72% | 0.87% | 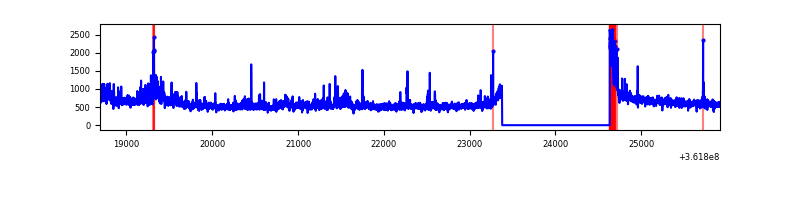 |
| D | 7227 | 5972 | 96 | 96 | 1.33% | 1.61% | 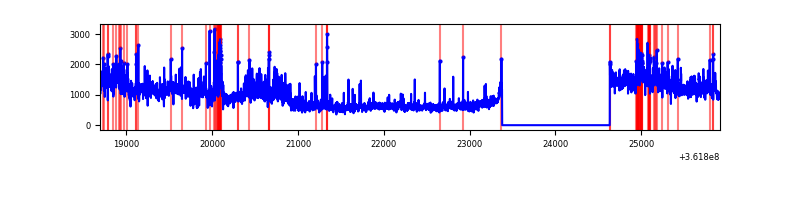 |
Top three noisy pixels from each quadrant. If the there are fewer than three noisy pixels in the level2.evt file, extra rows are filled as -1
| Pixel properties | Quadrant properties | ||||||
|---|---|---|---|---|---|---|---|
| Quadrant | DetID | PixID | Counts | Sigma | Mean | Median | Sigma |
| A | 11 | 47 | 15360 | 90.03 | 814 | 799 | 161.7 |
| A | 13 | 254 | 10412 | 59.44 | 814 | 799 | 161.7 |
| A | 3 | 137 | 7621 | 42.18 | 814 | 799 | 161.7 |
| B | 6 | 159 | 1726770 | 11407.75 | 806 | 787 | 151.3 |
| B | 4 | 80 | 140394 | 922.72 | 806 | 787 | 151.3 |
| B | 0 | 190 | 44693 | 290.19 | 806 | 787 | 151.3 |
| C | 0 | 10 | 298352 | 1627.93 | 787 | 797 | 182.8 |
| C | 3 | 233 | 207956 | 1133.37 | 787 | 797 | 182.8 |
| C | 14 | 238 | 129168 | 702.32 | 787 | 797 | 182.8 |
| D | 13 | 174 | 2640967 | 14135.95 | 789 | 772 | 186.8 |
| D | 8 | 195 | 257101 | 1372.42 | 789 | 772 | 186.8 |
| D | 2 | 250 | 100919 | 536.2 | 789 | 772 | 186.8 |
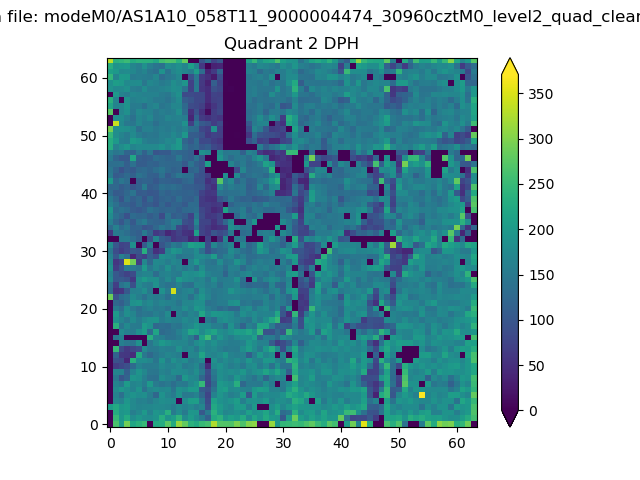
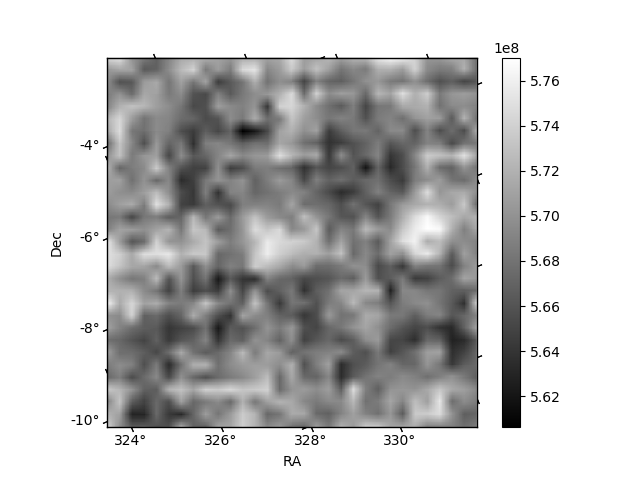
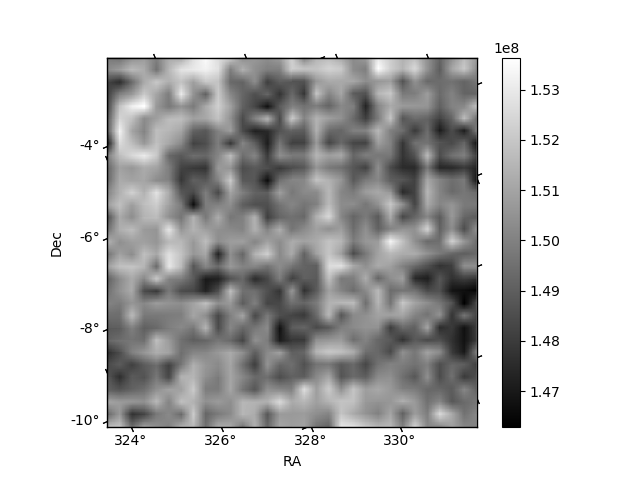
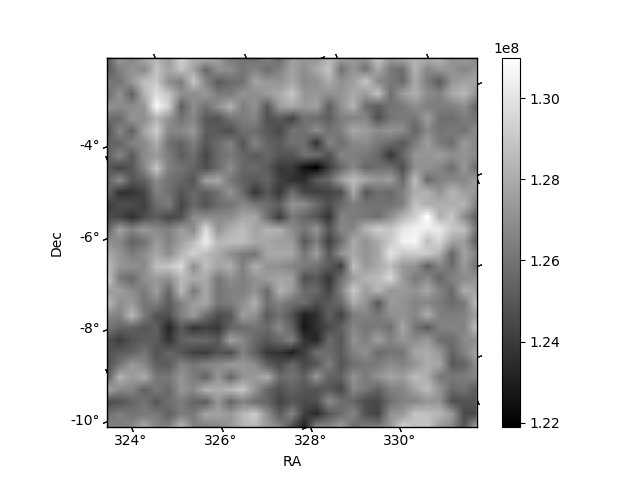
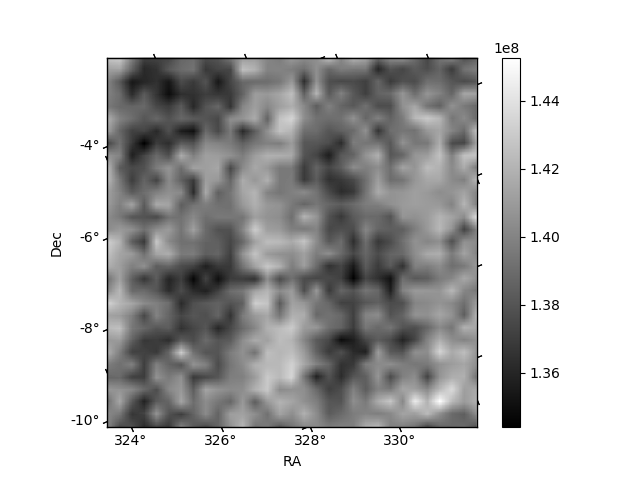
Histogram calculated using DETX and DETY for each event in the final _common_clean file
| Quadrant A | 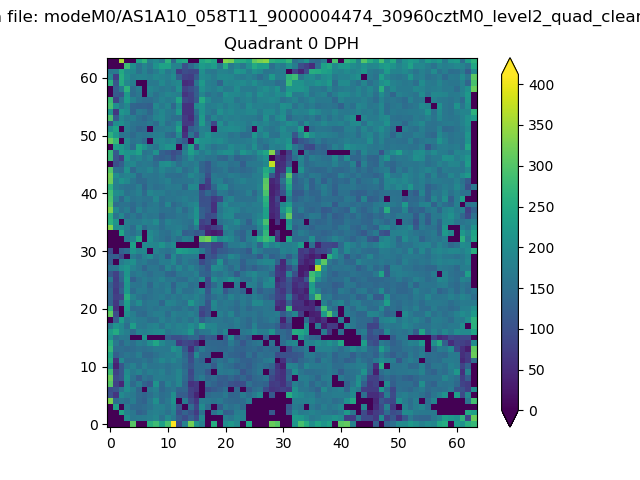 |
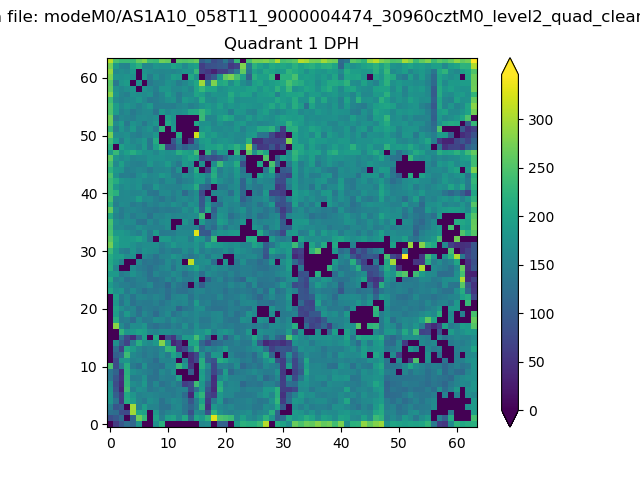 |
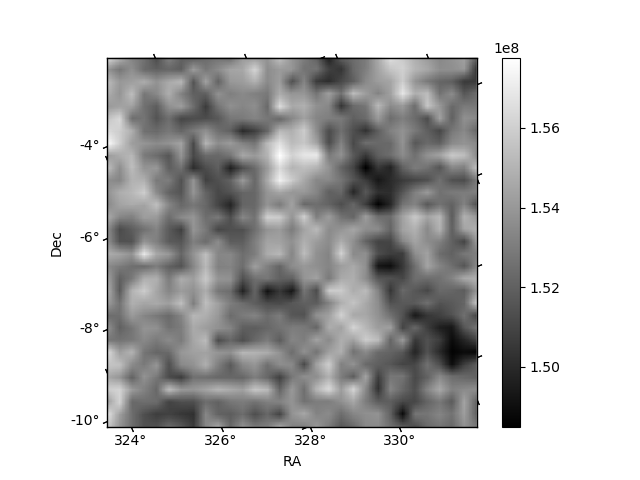
Quadrant B |
|---|---|---|---|
| Quadrant D | 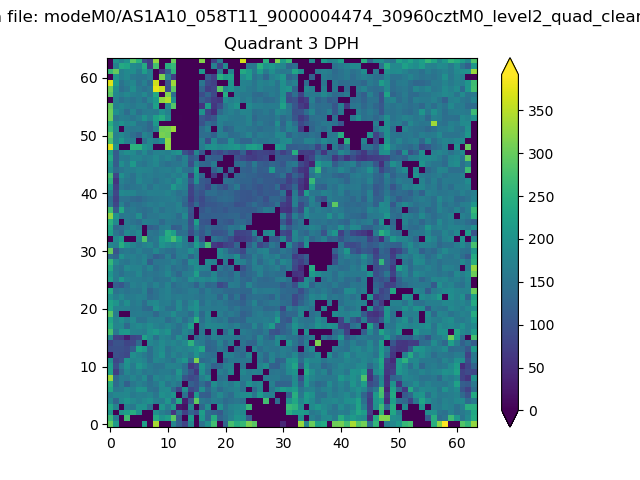 |
 |
Quadrant C |
| Plot type | Count rate plots | Images |
|---|---|---|
| Comparison with Poisson distribution Blue bars denote a histogram of data divided into 1 sec bins. Red curve is a Poisson curve with rate = median count rate of data. |
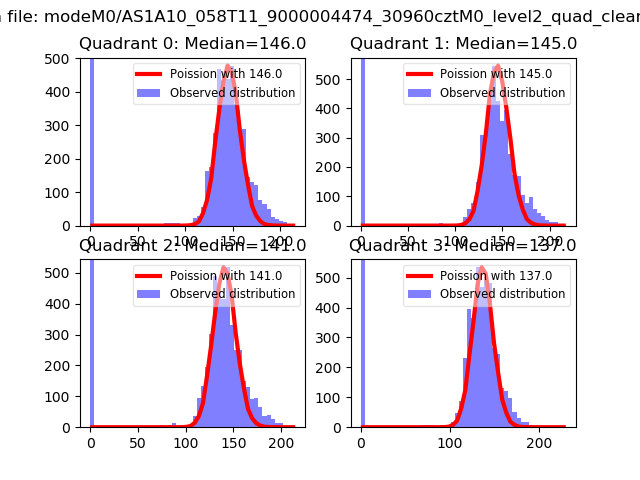 |
 |
| Quadrant-wise count rates Data is divided into 100 sec bins |
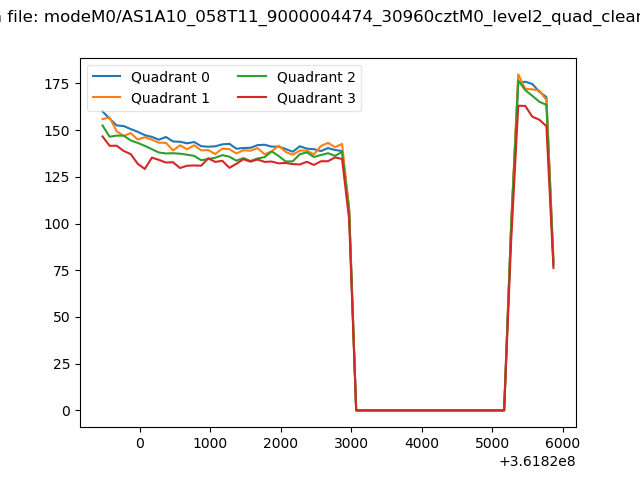 |
|
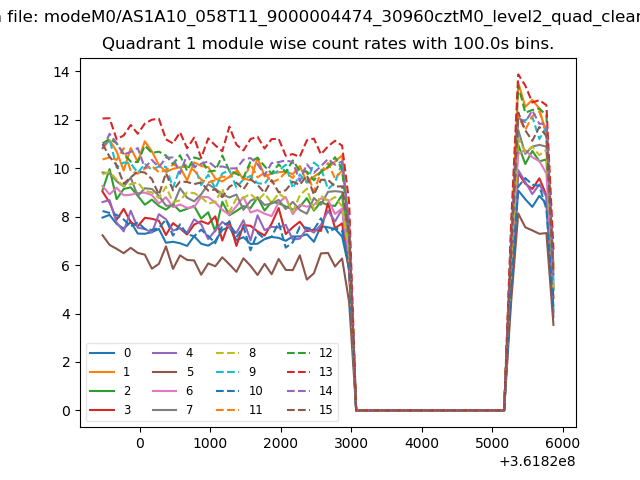
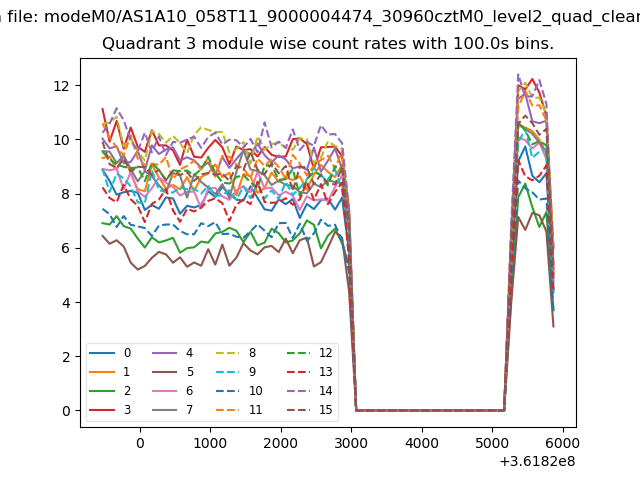
| Module-wise count rates for Quadrant A Data is divided into 100 sec bins |
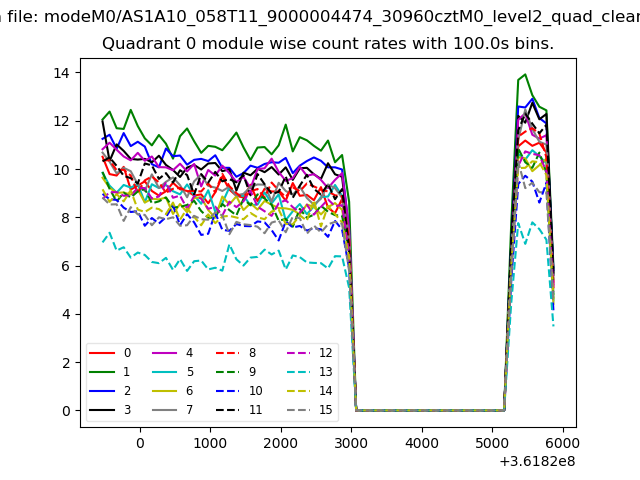 |
 |
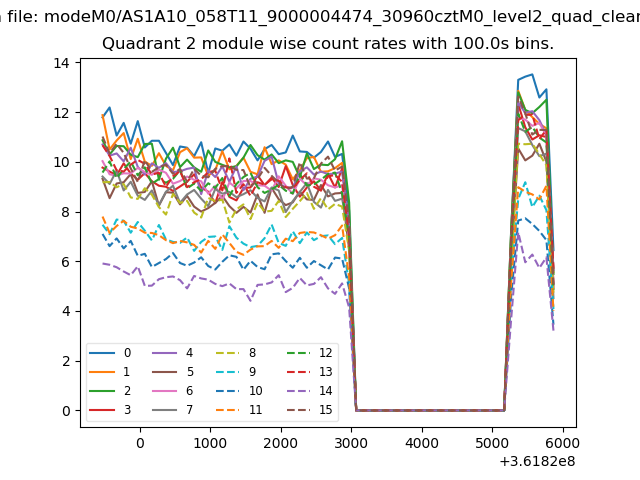
| Module-wise count rates for Quadrant B Data is divided into 100 sec bins |
 |
 |
| Module-wise count rates for Quadrant C Data is divided into 100 sec bins |
 |
 |
| Module-wise count rates for Quadrant D Data is divided into 100 sec bins |
 |
 |
| Parameter | Plot |
|---|---|
| CZT HV Monitor | 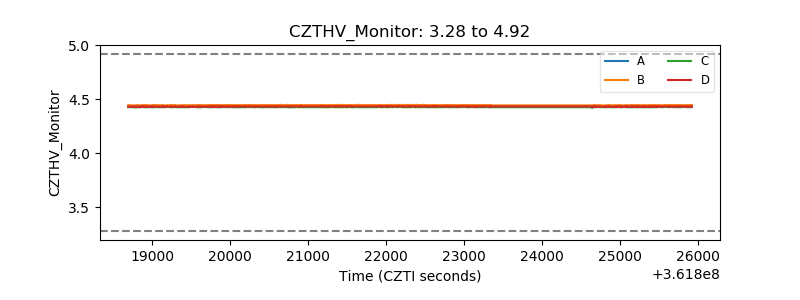 |
| D_VDD | 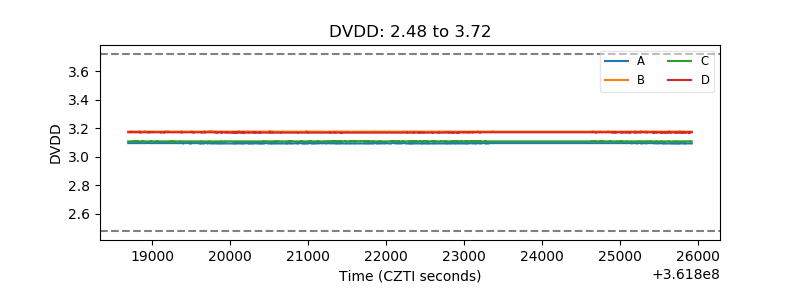 |
| Temperature 1 | 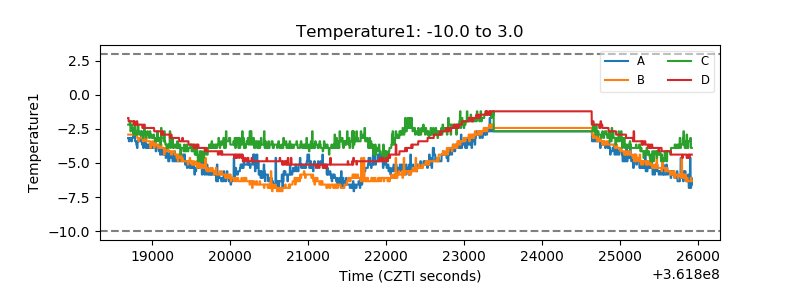 |
| Veto HV Monitor |  |
| Veto LLD | 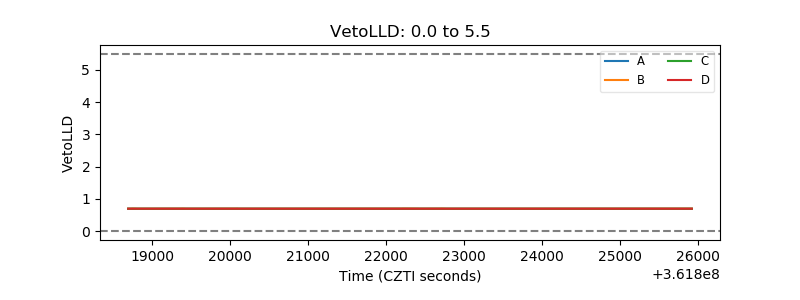 |
| Alpha Counter |  |
| _CPM_Rate |  |
| CZT Counter | 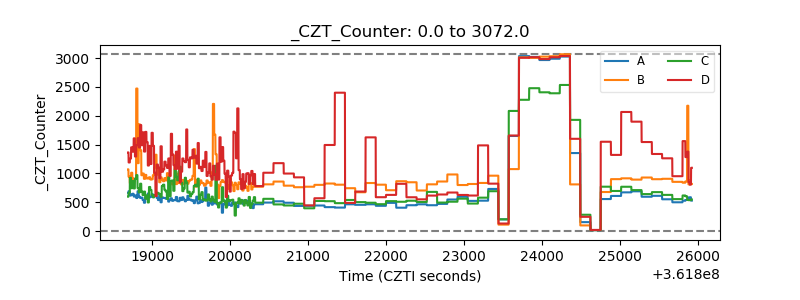 |
| +2.5 Volts monitor |  |
| +5 Volts monitor | 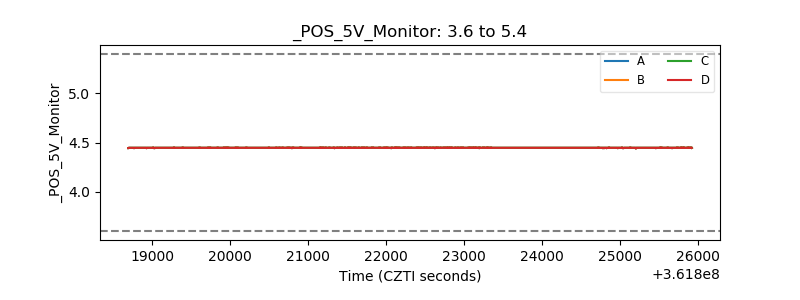 |
| _ROLL_ROT | 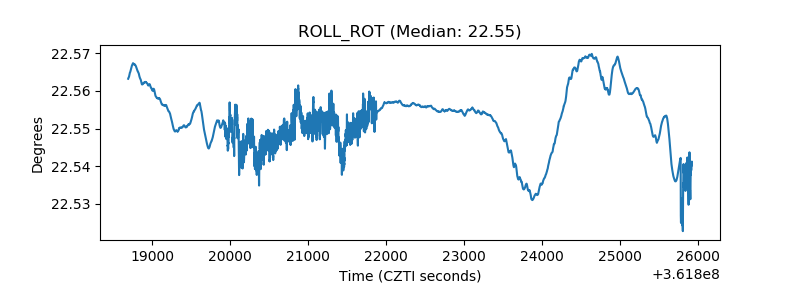 |
| _Roll_DEC | 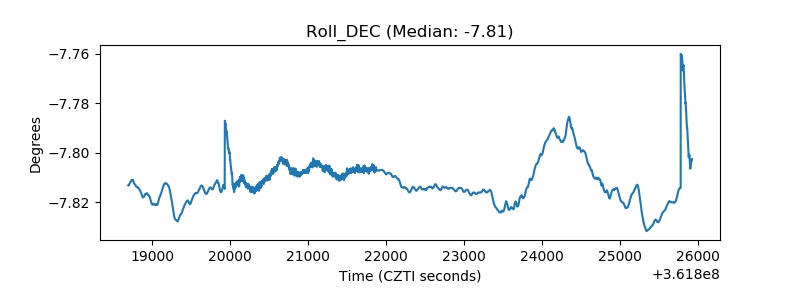 |
| _Roll_RA | 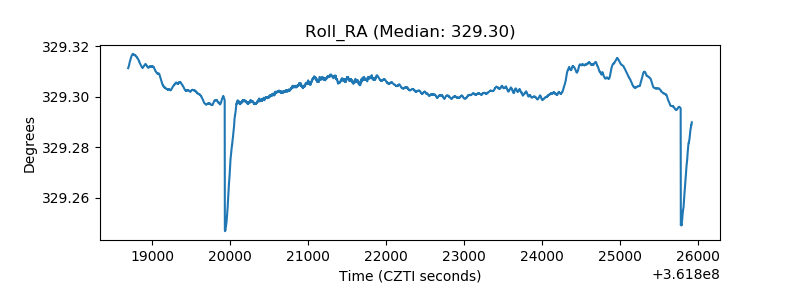 |
| Veto Counter | 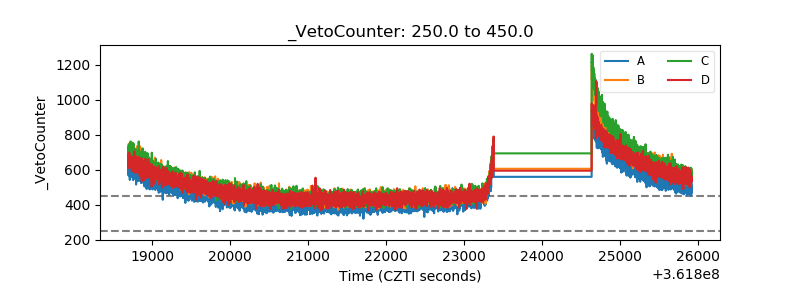 |