| Param | Original file | Final file |
|---|---|---|
| Filename | modeM0/AS1A10_058T11_9000004474_30961cztM0_level2.evt | modeM0/AS1A10_058T11_9000004474_30961cztM0_level2_quad_clean.evt |
| Size (bytes) | 642,752,640 | 108,924,480 |
| Size | 613.0 MB | 103.9 MB |
| Events in quadrant A | 3,402,663 | 728,772 |
| Events in quadrant B | 5,406,143 | 735,177 |
| Events in quadrant C | 3,911,079 | 716,916 |
| Events in quadrant D | 6,328,837 | 686,345 |
| Mode M9 | |||
|---|---|---|---|
| Quadrant | BADHDUFLAG | Total packets | Discarded packets |
| A | 0 | 14 | 0 |
| B | 0 | 14 | 0 |
| C | 0 | 14 | 0 |
| D | 0 | 14 | 0 |
| Mode M0 | |||
|---|---|---|---|
| Quadrant | BADHDUFLAG | Total packets | Discarded packets |
| A | 0 | 14058 | 2 |
| B | 0 | 20016 | 2 |
| C | 0 | 15612 | 2 |
| D | 0 | 23238 | 2 |
| Mode SS | |||
|---|---|---|---|
| Quadrant | BADHDUFLAG | Total packets | Discarded packets |
| A | 0 | 126 | 0 |
| B | 0 | 126 | 0 |
| C | 0 | 126 | 0 |
| D | 0 | 126 | 0 |
| Quadrant | Total seconds | Saturated seconds | Saturation percentage |
|---|---|---|---|
| A | 6185 | 25 | 0.404204% |
| B | 6186 | 151 | 2.440996% |
| C | 6186 | 261 | 4.219205% |
| D | 6186 | 234 | 3.782735% |
Noise dominated data is calculated using 1-second bins in cleaned event files. If a bin has >2000 counts, and if more than 50% of those come from <1% of pixels, then it is considered to be noise-dominated and hence unusable.
| Quadrant | # 1 sec bins | Bins with >0 counts | Bins with >2000 counts | High rate bins dominated by noise | Noise dominated (total time) | Noise dominated (detector-on time) | Marked lightcurve |
|---|---|---|---|---|---|---|---|
| A | 7545 | 6186 | 0 | 0 | 0.00% | 0.00% |  |
| B | 7546 | 6186 | 22 | 22 | 0.29% | 0.36% | 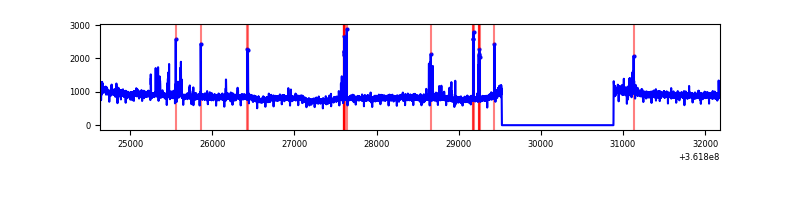 |
| C | 7546 | 6186 | 109 | 109 | 1.44% | 1.76% | 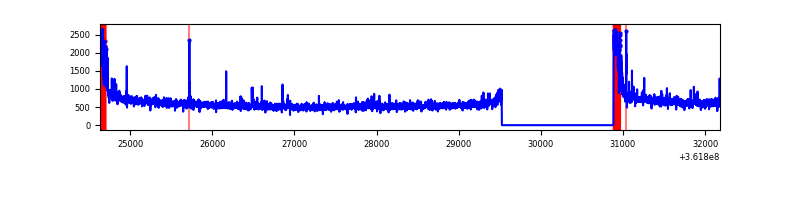 |
| D | 7546 | 6187 | 80 | 80 | 1.06% | 1.29% | 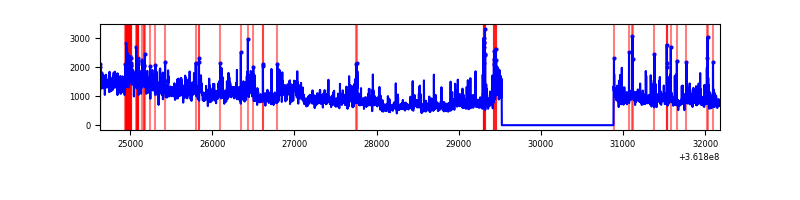 |
Top three noisy pixels from each quadrant. If the there are fewer than three noisy pixels in the level2.evt file, extra rows are filled as -1
| Pixel properties | Quadrant properties | ||||||
|---|---|---|---|---|---|---|---|
| Quadrant | DetID | PixID | Counts | Sigma | Mean | Median | Sigma |
| A | 11 | 47 | 38631 | 218.91 | 872 | 857 | 172.6 |
| A | 13 | 254 | 10902 | 58.21 | 872 | 857 | 172.6 |
| A | 3 | 137 | 7745 | 39.92 | 872 | 857 | 172.6 |
| B | 6 | 159 | 1816008 | 11165.07 | 871 | 851 | 162.6 |
| B | 4 | 80 | 53417 | 323.33 | 871 | 851 | 162.6 |
| B | 0 | 190 | 38716 | 232.91 | 871 | 851 | 162.6 |
| C | 0 | 10 | 395022 | 2022.99 | 844 | 854 | 194.8 |
| C | 14 | 238 | 138673 | 707.33 | 844 | 854 | 194.8 |
| C | 3 | 233 | 63306 | 320.52 | 844 | 854 | 194.8 |
| D | 13 | 174 | 2623910 | 13141.08 | 850 | 830 | 199.6 |
| D | 8 | 195 | 319584 | 1596.89 | 850 | 830 | 199.6 |
| D | 2 | 250 | 149017 | 742.39 | 850 | 830 | 199.6 |
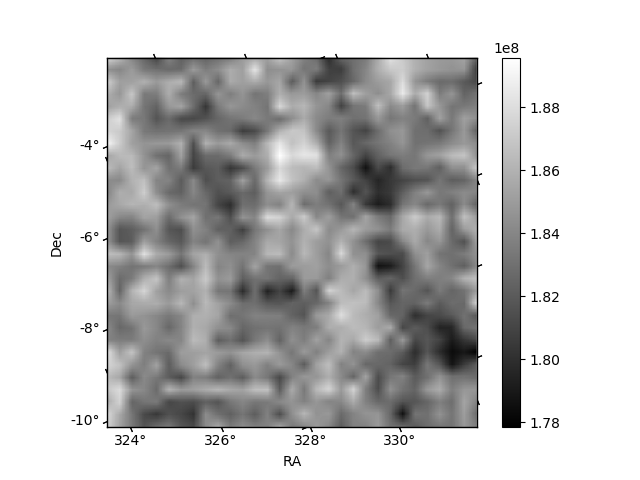
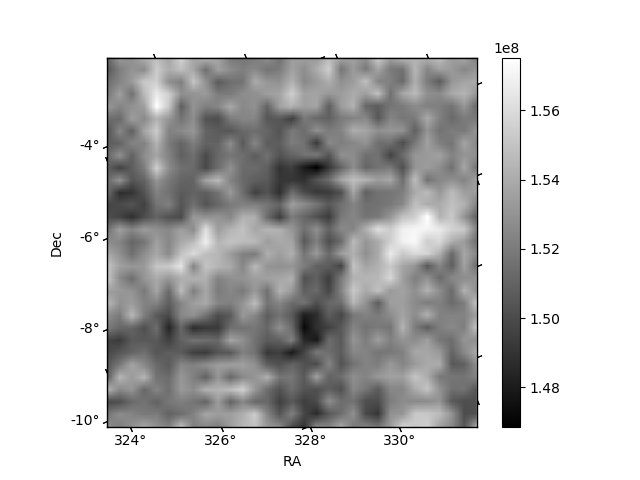
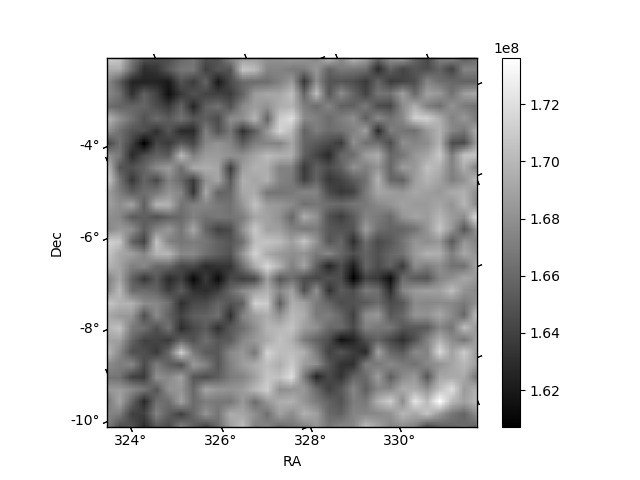
Histogram calculated using DETX and DETY for each event in the final _common_clean file
| Quadrant A | 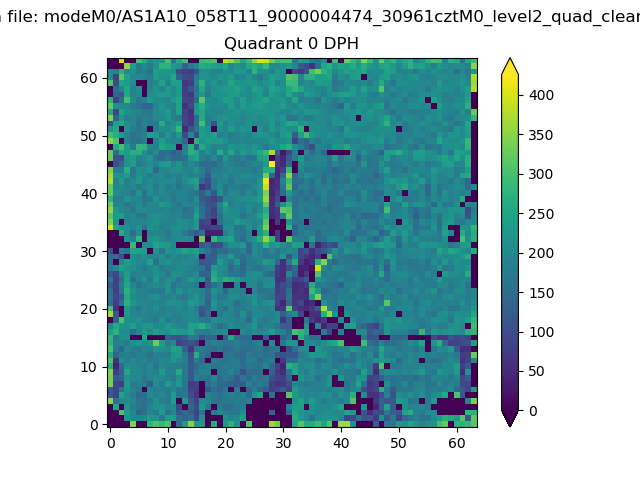 |
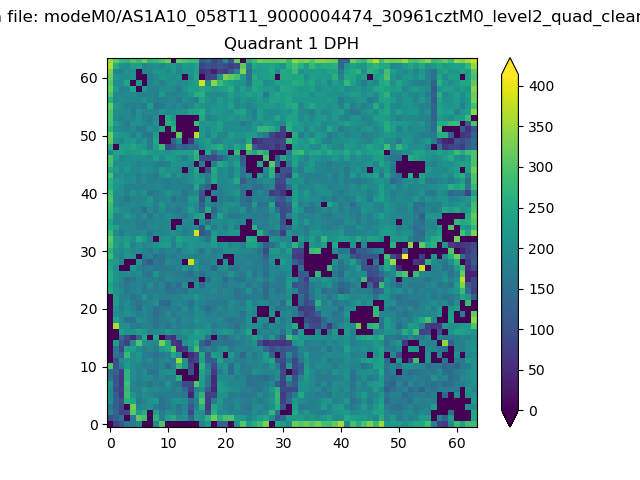 |
Quadrant B |
|---|---|---|---|
| Quadrant D | 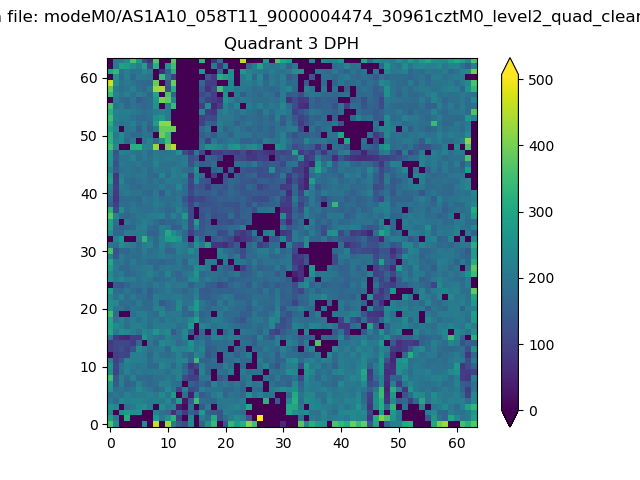 |
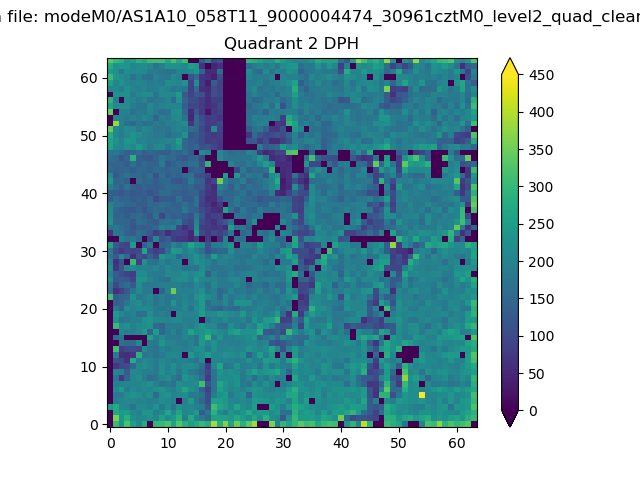 |
Quadrant C |
| Plot type | Count rate plots | Images |
|---|---|---|
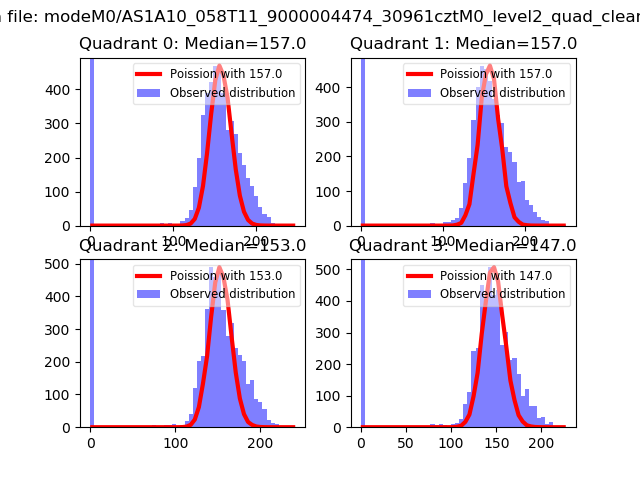
| Comparison with Poisson distribution Blue bars denote a histogram of data divided into 1 sec bins. Red curve is a Poisson curve with rate = median count rate of data. |
 |
 |
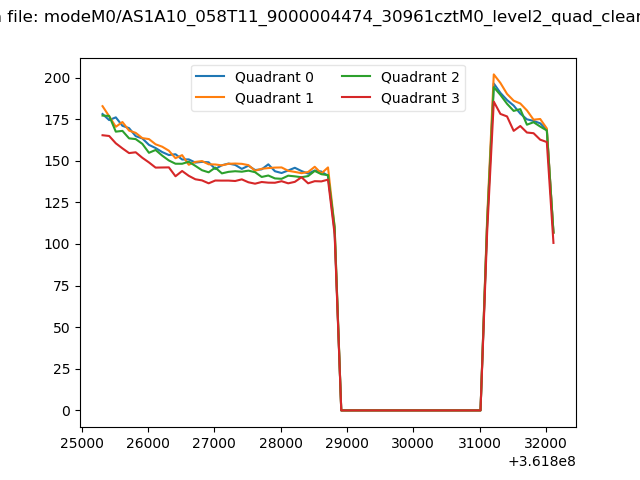
| Quadrant-wise count rates Data is divided into 100 sec bins |
 |
|
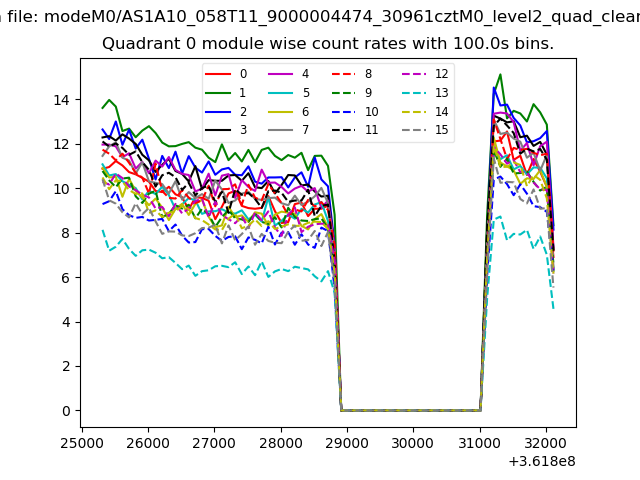
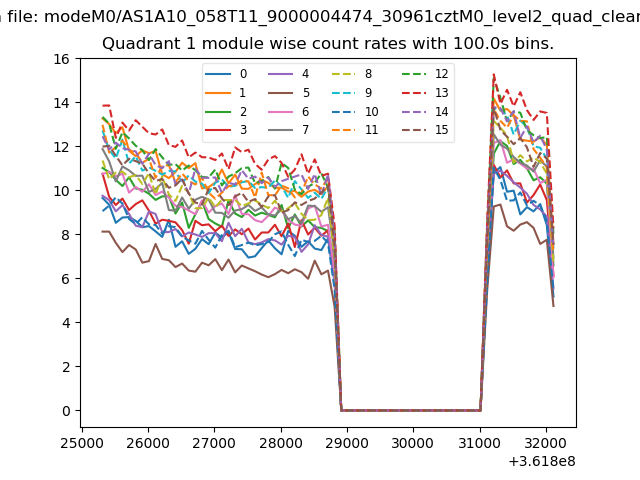
| Module-wise count rates for Quadrant A Data is divided into 100 sec bins |
 |
 |
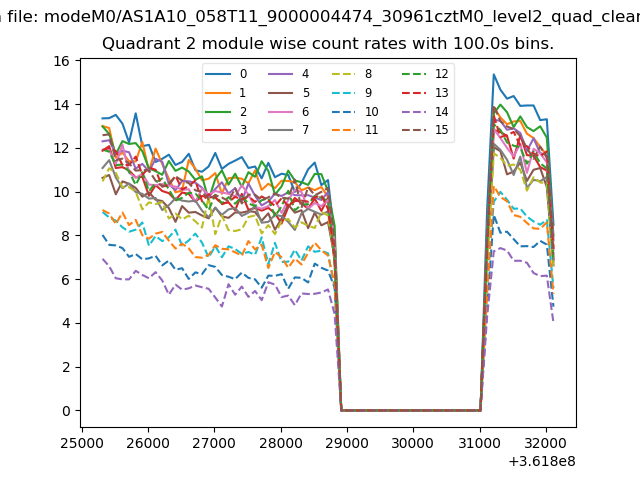
| Module-wise count rates for Quadrant B Data is divided into 100 sec bins |
 |
 |
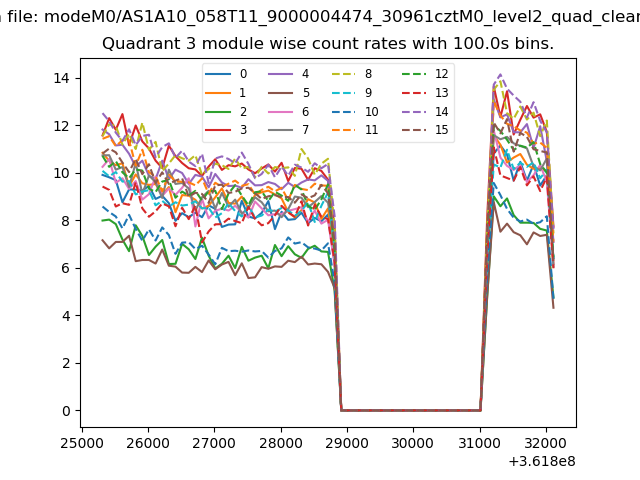
| Module-wise count rates for Quadrant C Data is divided into 100 sec bins |
 |
 |
| Module-wise count rates for Quadrant D Data is divided into 100 sec bins |
 |
 |
| Parameter | Plot |
|---|---|
| CZT HV Monitor | 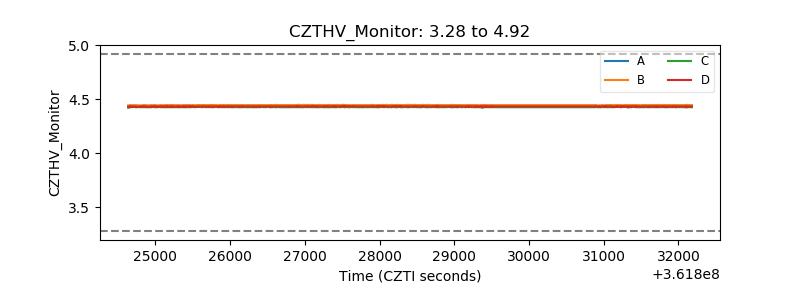 |
| D_VDD | 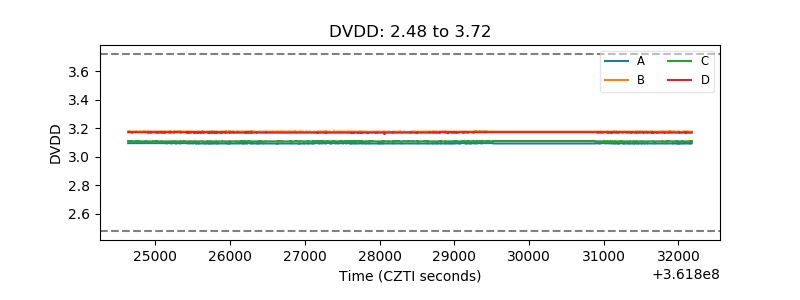 |
| Temperature 1 | 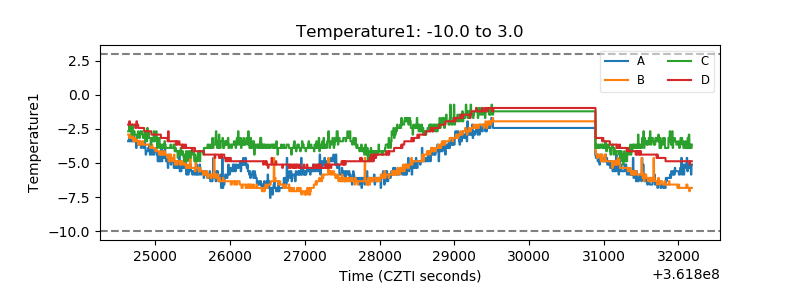 |
| Veto HV Monitor | 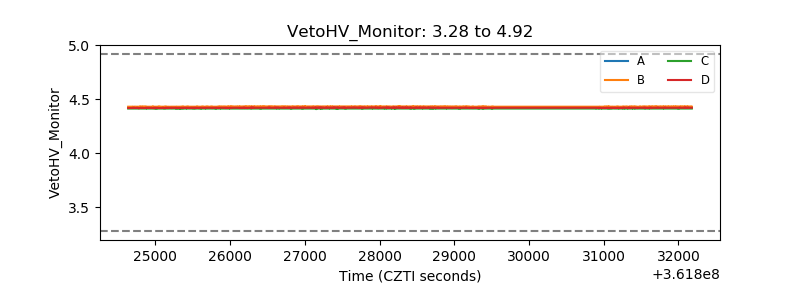 |
| Veto LLD | 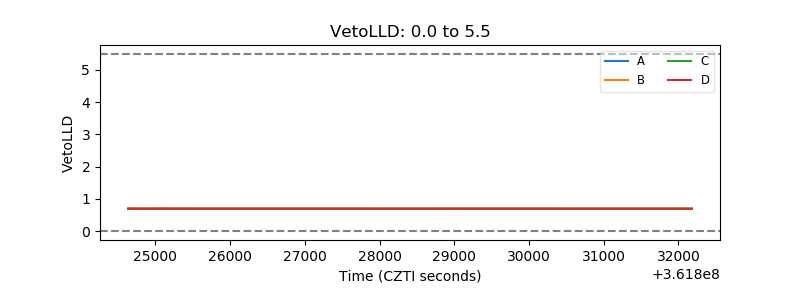 |
| Alpha Counter | 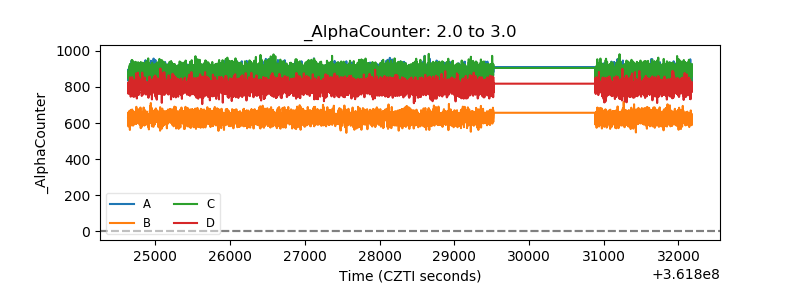 |
| _CPM_Rate | 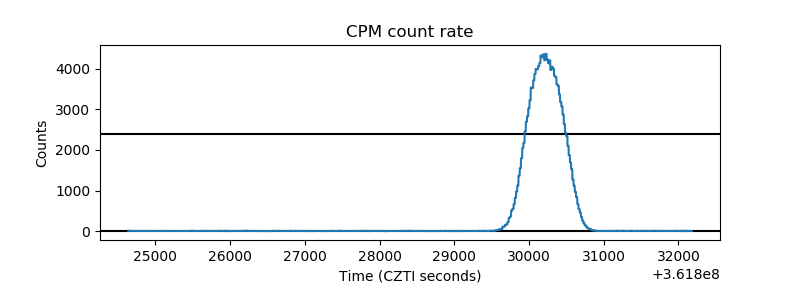 |
| CZT Counter | 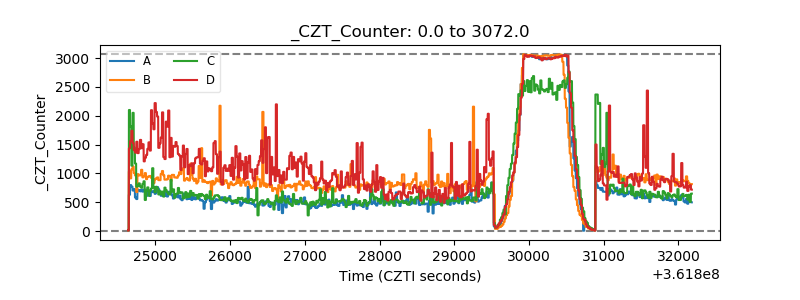 |
| +2.5 Volts monitor |  |
| +5 Volts monitor |  |
| _ROLL_ROT | 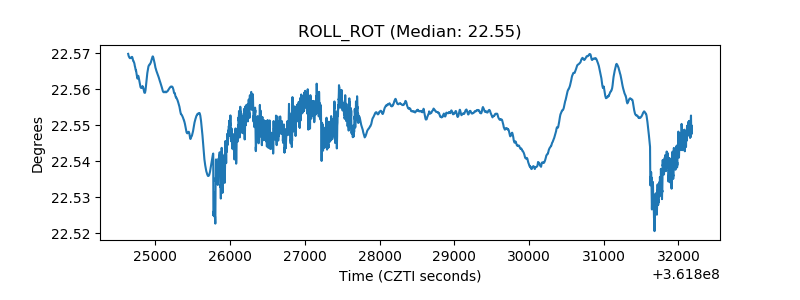 |
| _Roll_DEC | 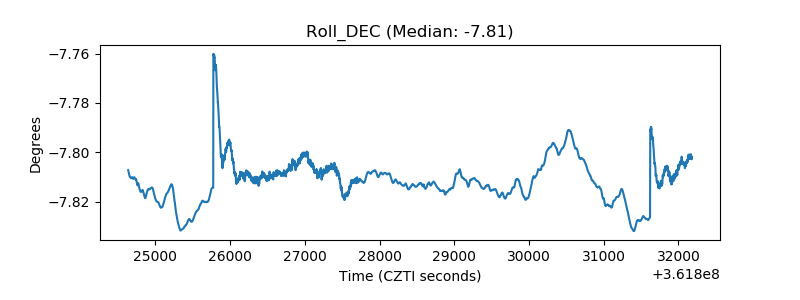 |
| _Roll_RA | 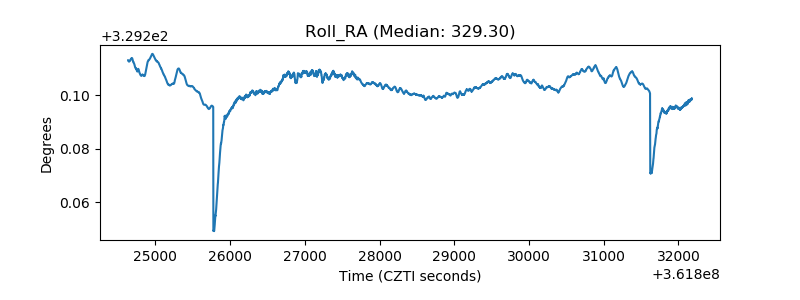 |
| Veto Counter | 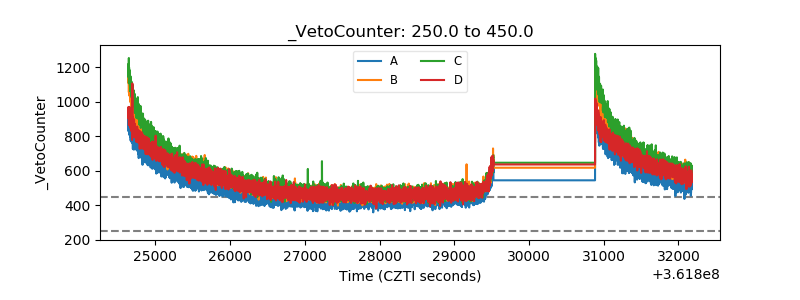 |