| Param | Original file | Final file |
|---|---|---|
| Filename | modeM0/AS1A10_058T11_9000004474_30962cztM0_level2.evt | modeM0/AS1A10_058T11_9000004474_30962cztM0_level2_quad_clean.evt |
| Size (bytes) | 591,880,320 | 116,712,000 |
| Size | 564.5 MB | 111.3 MB |
| Events in quadrant A | 3,272,153 | 789,503 |
| Events in quadrant B | 5,303,945 | 798,756 |
| Events in quadrant C | 3,963,040 | 775,599 |
| Events in quadrant D | 4,975,409 | 746,645 |
| Mode M9 | |||
|---|---|---|---|
| Quadrant | BADHDUFLAG | Total packets | Discarded packets |
| A | 0 | 18 | 0 |
| B | 0 | 19 | 0 |
| C | 0 | 19 | 0 |
| D | 0 | 19 | 0 |
| Mode M0 | |||
|---|---|---|---|
| Quadrant | BADHDUFLAG | Total packets | Discarded packets |
| A | 0 | 13500 | 2 |
| B | 0 | 19602 | 2 |
| C | 0 | 15876 | 2 |
| D | 0 | 19311 | 2 |
| Mode SS | |||
|---|---|---|---|
| Quadrant | BADHDUFLAG | Total packets | Discarded packets |
| A | 0 | 124 | 0 |
| B | 0 | 124 | 0 |
| C | 0 | 124 | 0 |
| D | 0 | 124 | 0 |
| Quadrant | Total seconds | Saturated seconds | Saturation percentage |
|---|---|---|---|
| A | 6076 | 18 | 0.296248% |
| B | 6076 | 166 | 2.732061% |
| C | 6076 | 261 | 4.295589% |
| D | 6076 | 149 | 2.452271% |
Noise dominated data is calculated using 1-second bins in cleaned event files. If a bin has >2000 counts, and if more than 50% of those come from <1% of pixels, then it is considered to be noise-dominated and hence unusable.
| Quadrant | # 1 sec bins | Bins with >0 counts | Bins with >2000 counts | High rate bins dominated by noise | Noise dominated (total time) | Noise dominated (detector-on time) | Marked lightcurve |
|---|---|---|---|---|---|---|---|
| A | 7486 | 6077 | 0 | 0 | 0.00% | 0.00% | 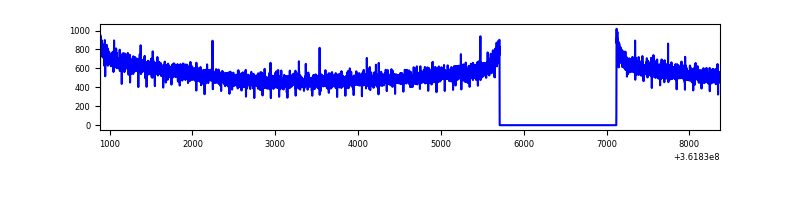 |
| B | 7486 | 6076 | 27 | 27 | 0.36% | 0.44% | 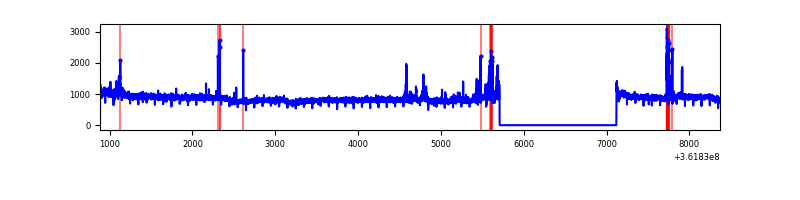 |
| C | 7486 | 6077 | 118 | 118 | 1.58% | 1.94% | 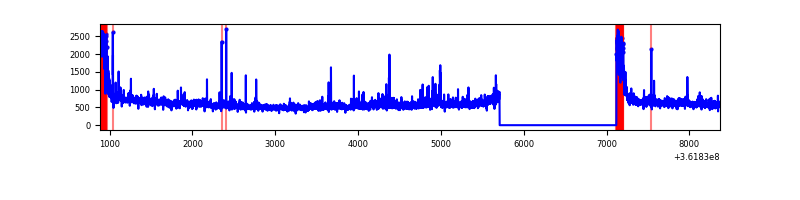 |
| D | 7486 | 6077 | 97 | 97 | 1.30% | 1.60% | 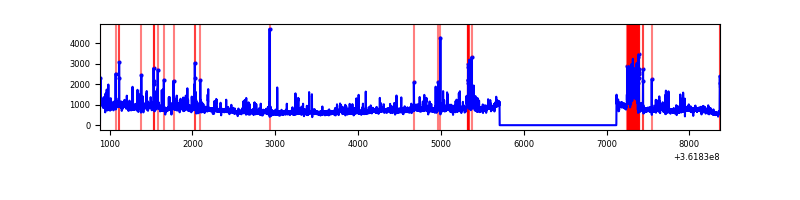 |
Top three noisy pixels from each quadrant. If the there are fewer than three noisy pixels in the level2.evt file, extra rows are filled as -1
| Pixel properties | Quadrant properties | ||||||
|---|---|---|---|---|---|---|---|
| Quadrant | DetID | PixID | Counts | Sigma | Mean | Median | Sigma |
| A | 13 | 254 | 10105 | 55.53 | 848 | 835 | 166.9 |
| A | 3 | 137 | 7622 | 40.66 | 848 | 835 | 166.9 |
| A | 0 | 226 | 6991 | 36.88 | 848 | 835 | 166.9 |
| B | 6 | 159 | 1803906 | 11449.79 | 847 | 828 | 157.5 |
| B | 4 | 80 | 108589 | 684.3 | 847 | 828 | 157.5 |
| B | 0 | 230 | 29461 | 181.82 | 847 | 828 | 157.5 |
| C | 0 | 10 | 474237 | 2480.98 | 825 | 835 | 190.8 |
| C | 14 | 238 | 133978 | 697.77 | 825 | 835 | 190.8 |
| C | 3 | 233 | 118787 | 618.16 | 825 | 835 | 190.8 |
| D | 13 | 174 | 1130676 | 5780.71 | 832 | 813 | 195.5 |
| D | 8 | 195 | 368510 | 1881.25 | 832 | 813 | 195.5 |
| D | 2 | 250 | 295376 | 1507.07 | 832 | 813 | 195.5 |
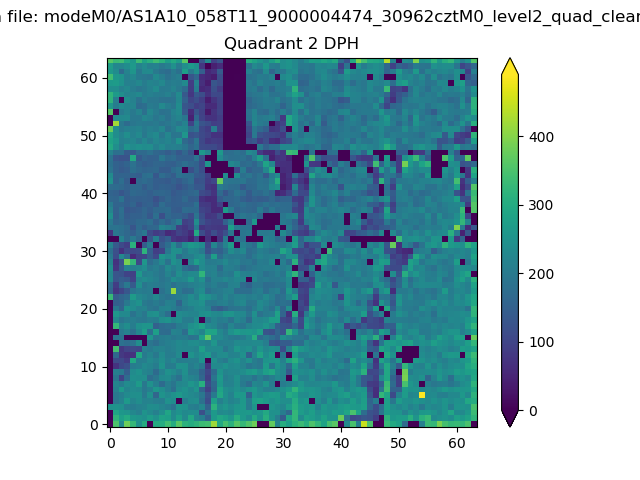
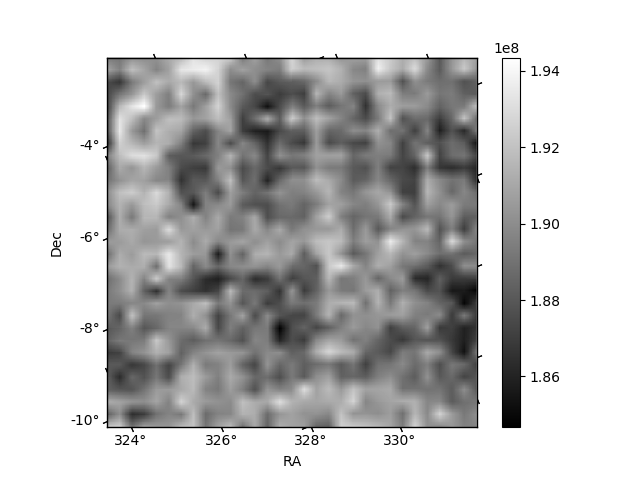
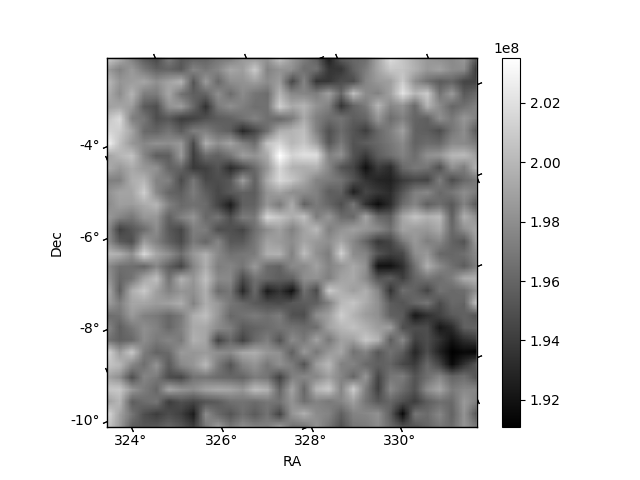
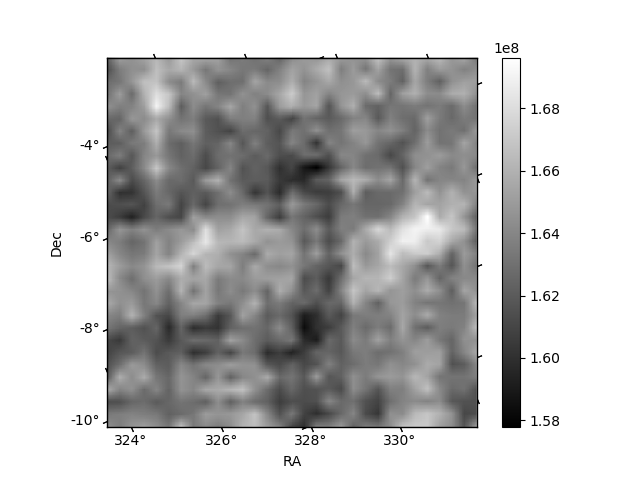
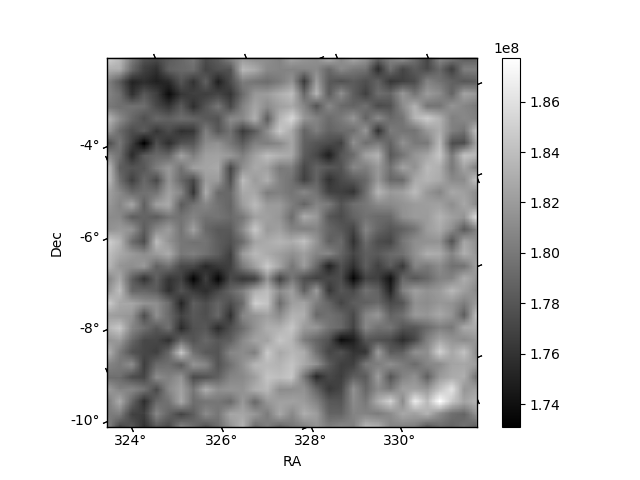
Histogram calculated using DETX and DETY for each event in the final _common_clean file
| Quadrant A | 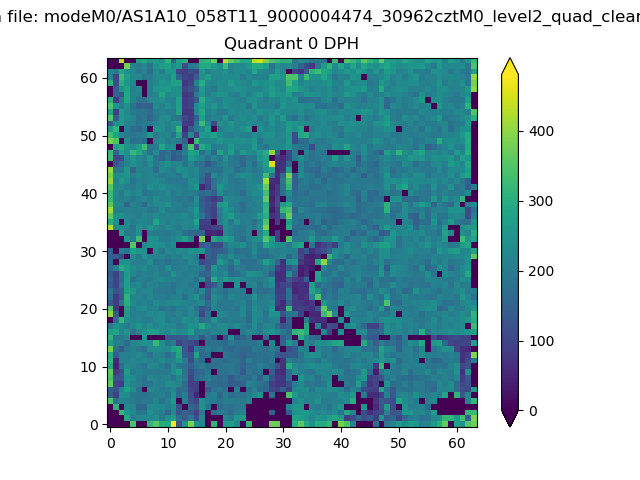 |
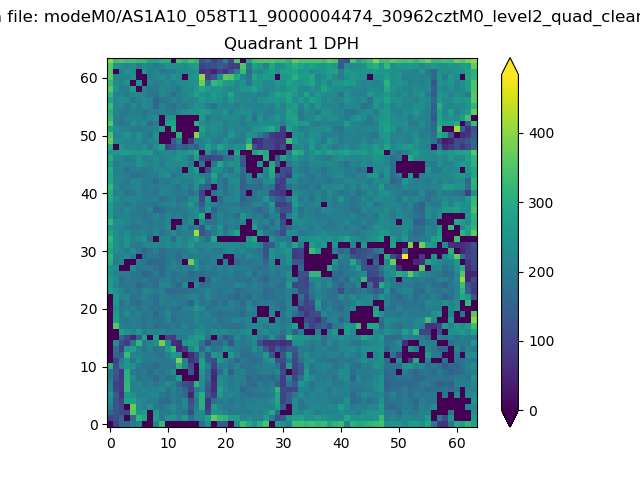 |
Quadrant B |
|---|---|---|---|
| Quadrant D | 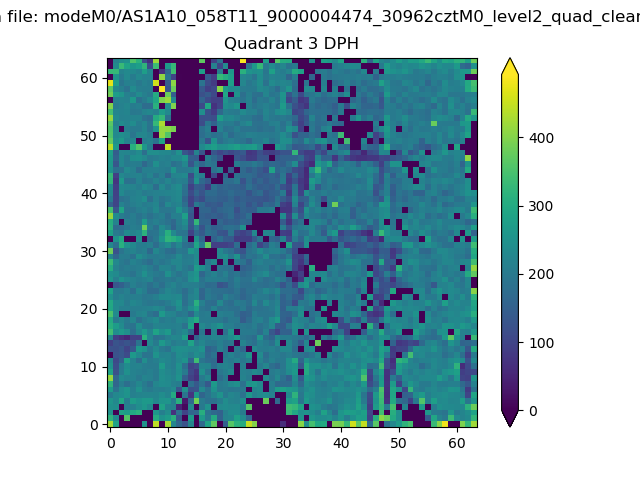 |
 |
Quadrant C |
| Plot type | Count rate plots | Images |
|---|---|---|
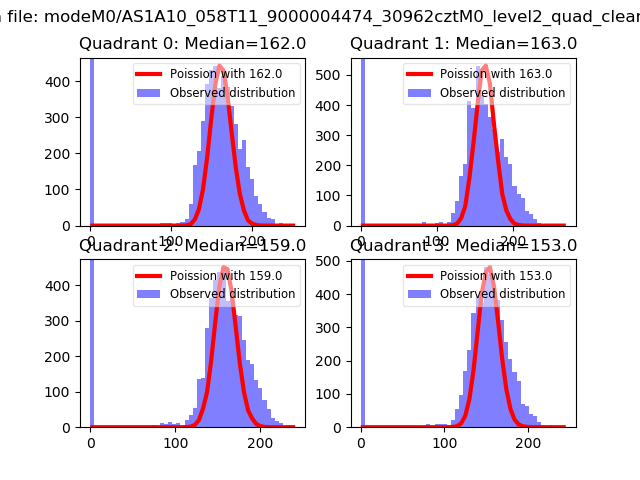
| Comparison with Poisson distribution Blue bars denote a histogram of data divided into 1 sec bins. Red curve is a Poisson curve with rate = median count rate of data. |
 |
 |
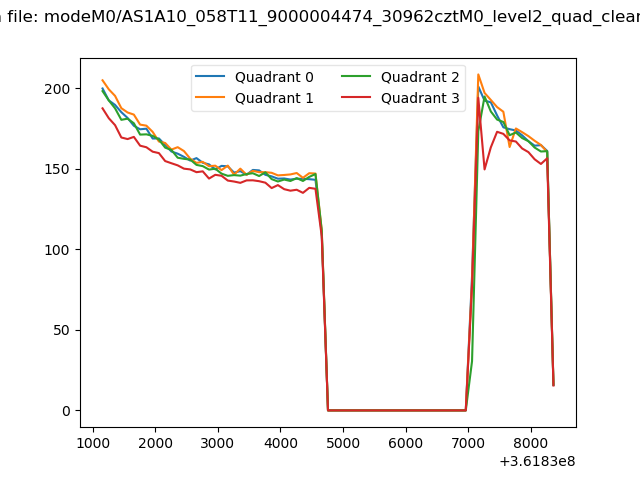
| Quadrant-wise count rates Data is divided into 100 sec bins |
 |
|
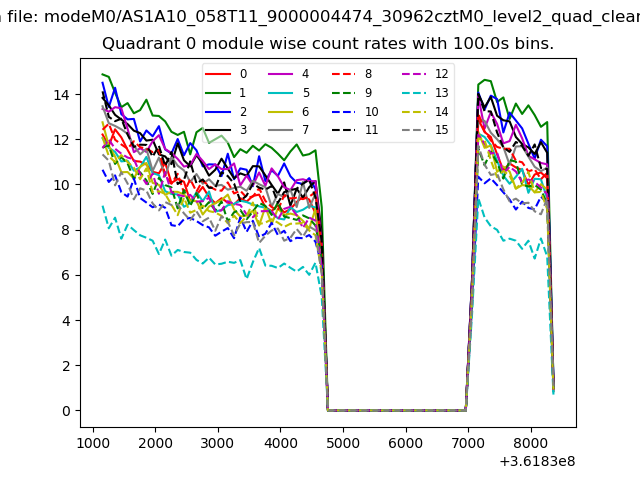
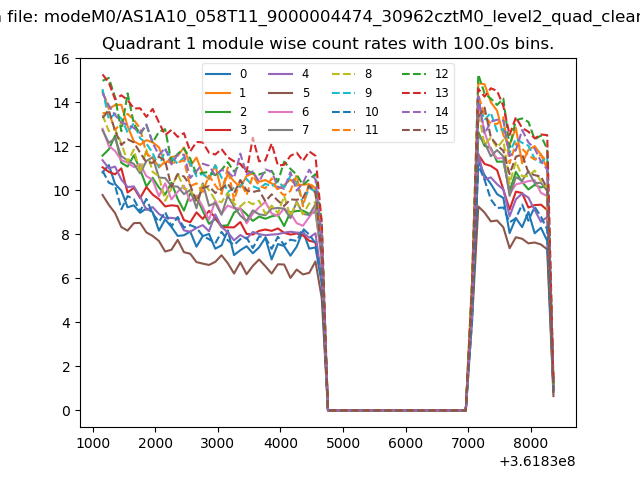
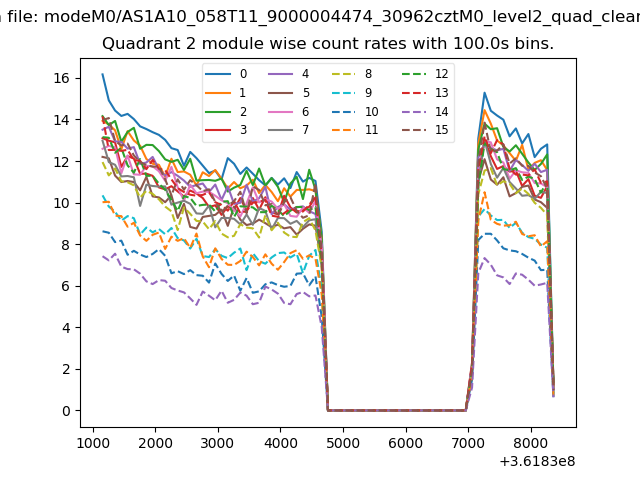
| Module-wise count rates for Quadrant A Data is divided into 100 sec bins |
 |
 |
| Module-wise count rates for Quadrant B Data is divided into 100 sec bins |
 |
 |
| Module-wise count rates for Quadrant C Data is divided into 100 sec bins |
 |
 |
| Module-wise count rates for Quadrant D Data is divided into 100 sec bins |
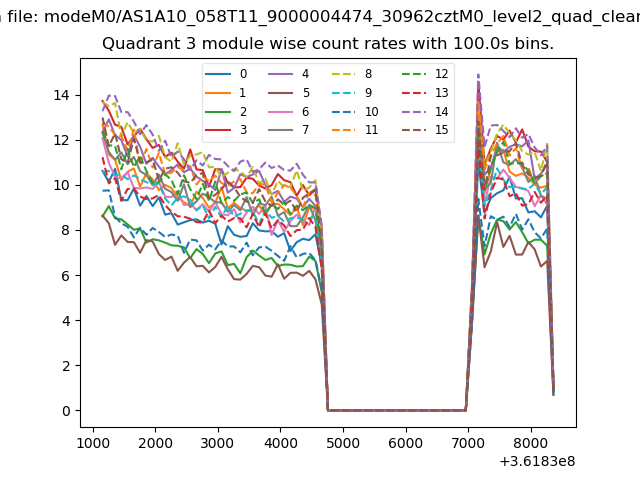 |
 |
| Parameter | Plot |
|---|---|
| CZT HV Monitor | 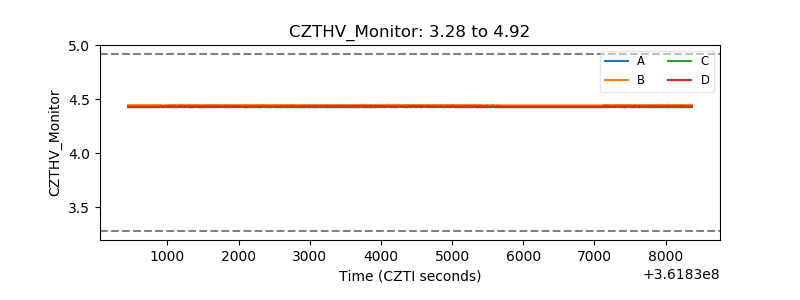 |
| D_VDD | 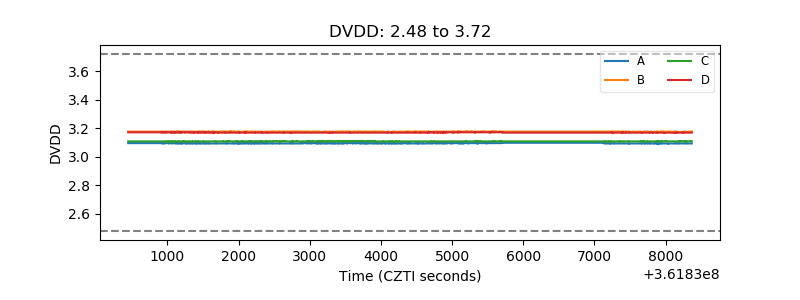 |
| Temperature 1 | 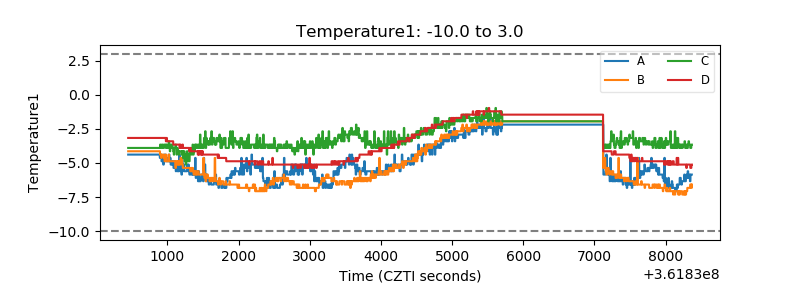 |
| Veto HV Monitor | 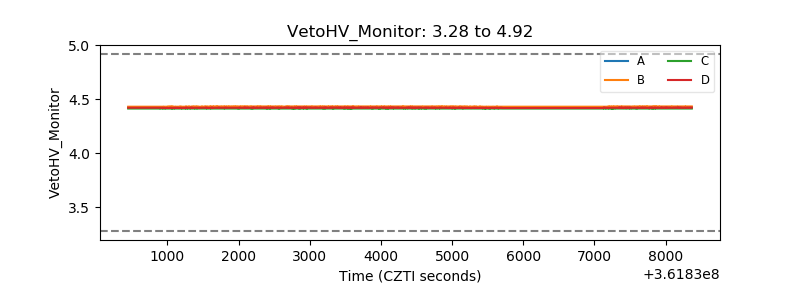 |
| Veto LLD | 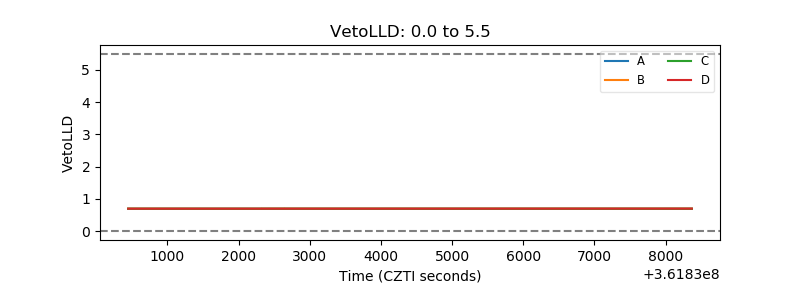 |
| Alpha Counter | 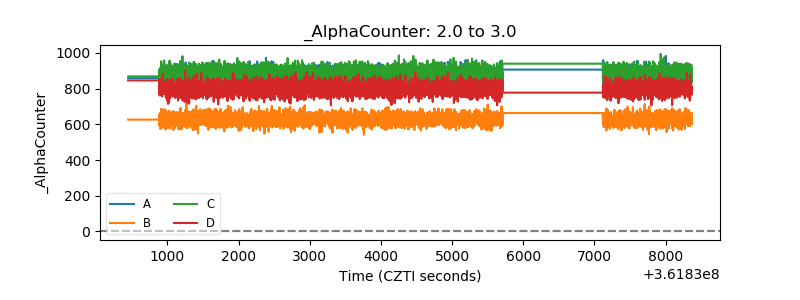 |
| _CPM_Rate | 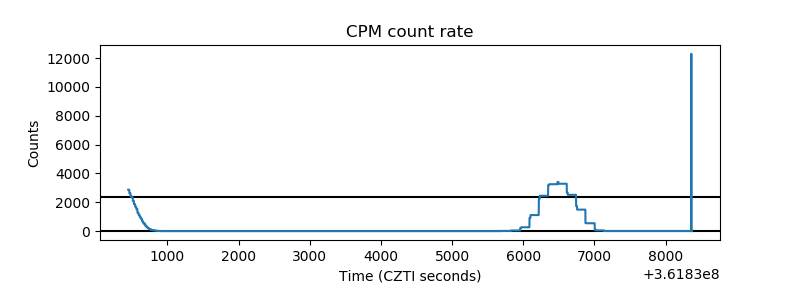 |
| CZT Counter | 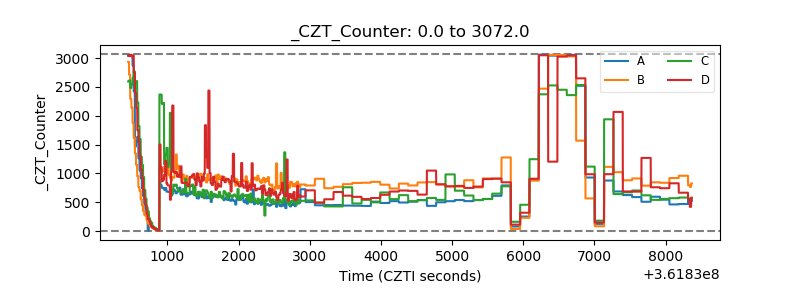 |
| +2.5 Volts monitor | 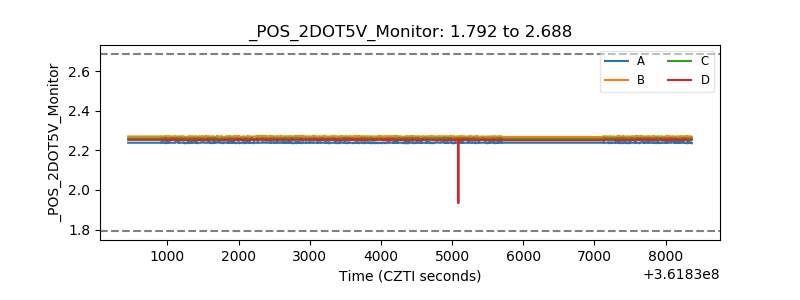 |
| +5 Volts monitor | 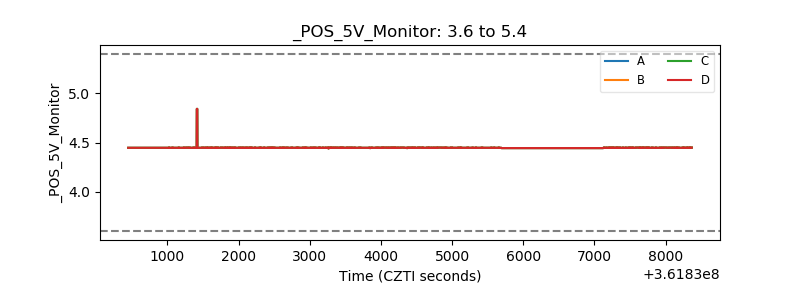 |
| _ROLL_ROT | 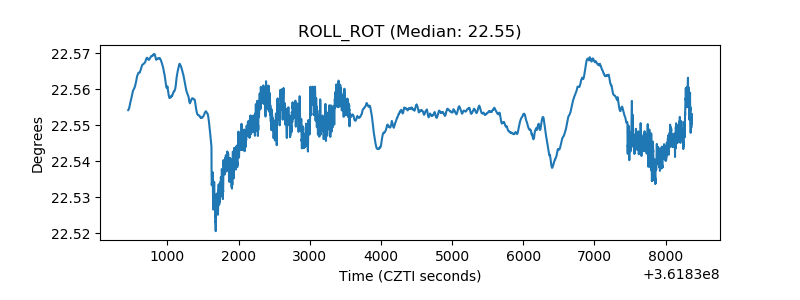 |
| _Roll_DEC | 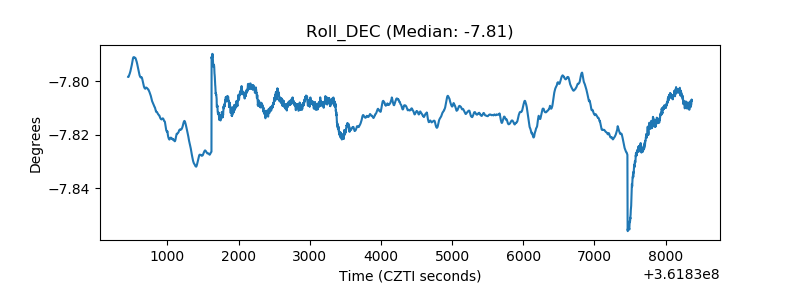 |
| _Roll_RA | 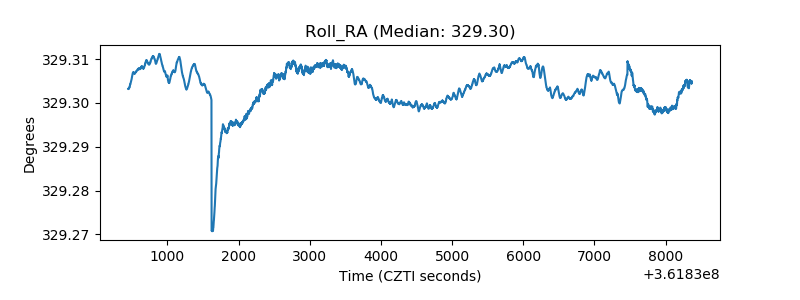 |
| Veto Counter | 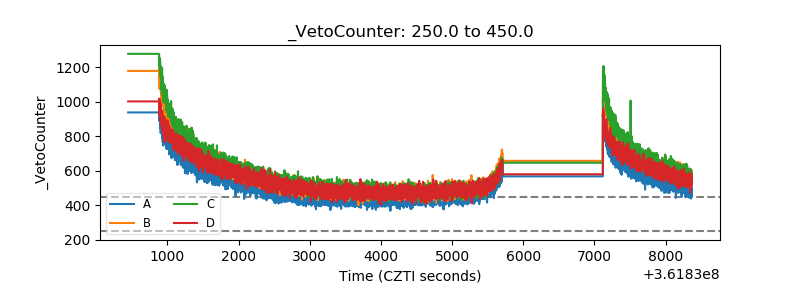 |