| Param | Original file | Final file |
|---|---|---|
| Filename | modeM0/AS1A10_058T11_9000004474_30963cztM0_level2.evt | modeM0/AS1A10_058T11_9000004474_30963cztM0_level2_quad_clean.evt |
| Size (bytes) | 558,455,040 | 113,379,840 |
| Size | 532.6 MB | 108.1 MB |
| Events in quadrant A | 3,274,440 | 760,452 |
| Events in quadrant B | 5,196,841 | 770,887 |
| Events in quadrant C | 3,729,825 | 741,405 |
| Events in quadrant D | 4,288,989 | 725,067 |
| Mode M9 | |||
|---|---|---|---|
| Quadrant | BADHDUFLAG | Total packets | Discarded packets |
| A | 0 | 20 | 0 |
| B | 0 | 21 | 0 |
| C | 0 | 21 | 0 |
| D | 0 | 21 | 0 |
| Mode M0 | |||
|---|---|---|---|
| Quadrant | BADHDUFLAG | Total packets | Discarded packets |
| A | 0 | 13497 | 2 |
| B | 0 | 19491 | 2 |
| C | 0 | 14971 | 2 |
| D | 0 | 16832 | 2 |
| Mode SS | |||
|---|---|---|---|
| Quadrant | BADHDUFLAG | Total packets | Discarded packets |
| A | 0 | 128 | 0 |
| B | 0 | 128 | 0 |
| C | 0 | 128 | 0 |
| D | 0 | 128 | 0 |
| Quadrant | Total seconds | Saturated seconds | Saturation percentage |
|---|---|---|---|
| A | 6243 | 23 | 0.368413% |
| B | 6243 | 140 | 2.242512% |
| C | 6243 | 223 | 3.572001% |
| D | 6243 | 162 | 2.594906% |
Noise dominated data is calculated using 1-second bins in cleaned event files. If a bin has >2000 counts, and if more than 50% of those come from <1% of pixels, then it is considered to be noise-dominated and hence unusable.
| Quadrant | # 1 sec bins | Bins with >0 counts | Bins with >2000 counts | High rate bins dominated by noise | Noise dominated (total time) | Noise dominated (detector-on time) | Marked lightcurve |
|---|---|---|---|---|---|---|---|
| A | 7578 | 6244 | 0 | 0 | 0.00% | 0.00% | 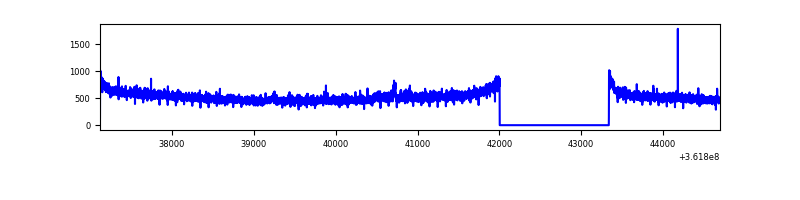 |
| B | 7578 | 6244 | 15 | 15 | 0.20% | 0.24% | 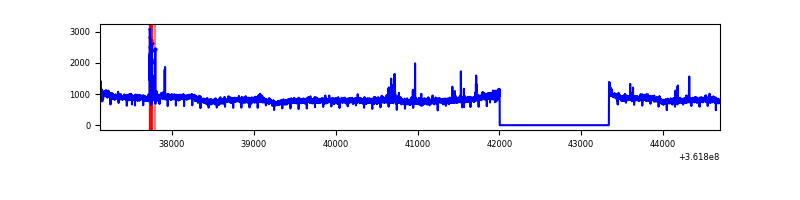 |
| C | 7578 | 6243 | 78 | 78 | 1.03% | 1.25% | 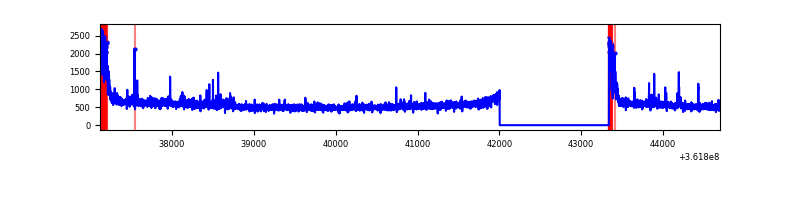 |
| D | 7578 | 6244 | 111 | 111 | 1.46% | 1.78% | 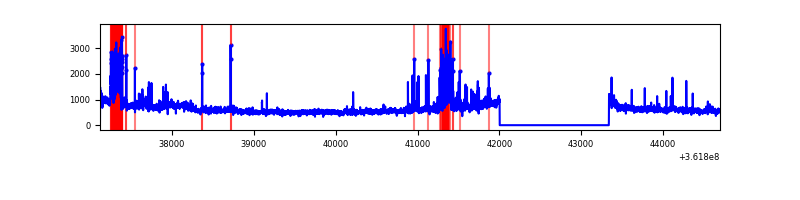 |
Top three noisy pixels from each quadrant. If the there are fewer than three noisy pixels in the level2.evt file, extra rows are filled as -1
| Pixel properties | Quadrant properties | ||||||
|---|---|---|---|---|---|---|---|
| Quadrant | DetID | PixID | Counts | Sigma | Mean | Median | Sigma |
| A | 11 | 47 | 28880 | 169.15 | 841 | 827 | 165.8 |
| A | 13 | 254 | 10194 | 56.48 | 841 | 827 | 165.8 |
| A | 3 | 137 | 7897 | 42.63 | 841 | 827 | 165.8 |
| B | 6 | 159 | 1812087 | 11490.89 | 840 | 822 | 157.6 |
| B | 4 | 80 | 63338 | 396.61 | 840 | 822 | 157.6 |
| B | 12 | 111 | 18662 | 113.18 | 840 | 822 | 157.6 |
| C | 0 | 10 | 357321 | 1865.13 | 822 | 834 | 191.1 |
| C | 14 | 238 | 133202 | 692.55 | 822 | 834 | 191.1 |
| C | 3 | 233 | 18892 | 94.48 | 822 | 834 | 191.1 |
| D | 13 | 174 | 488452 | 2477.84 | 828 | 809 | 196.8 |
| D | 2 | 250 | 395843 | 2007.27 | 828 | 809 | 196.8 |
| D | 8 | 195 | 248825 | 1260.23 | 828 | 809 | 196.8 |
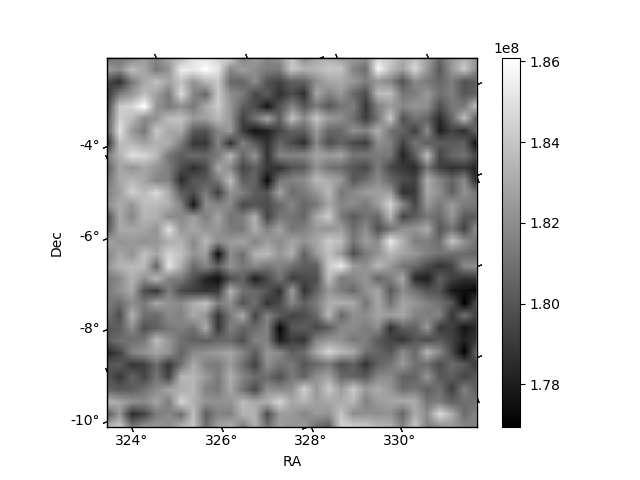
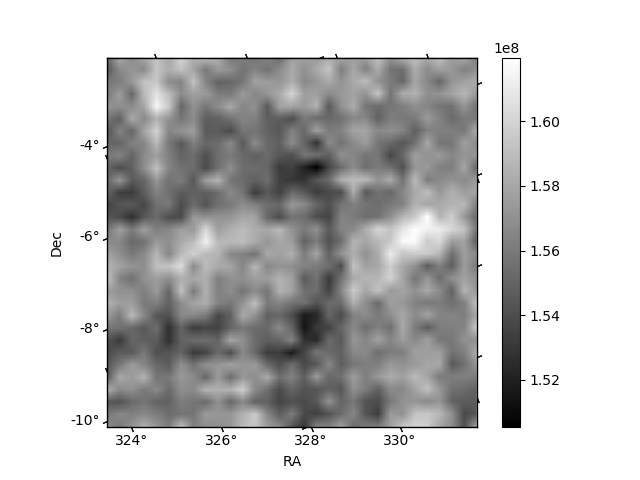
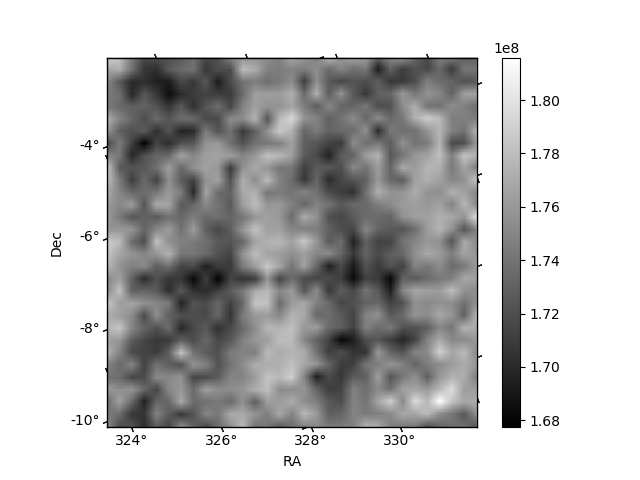
Histogram calculated using DETX and DETY for each event in the final _common_clean file
| Quadrant A | 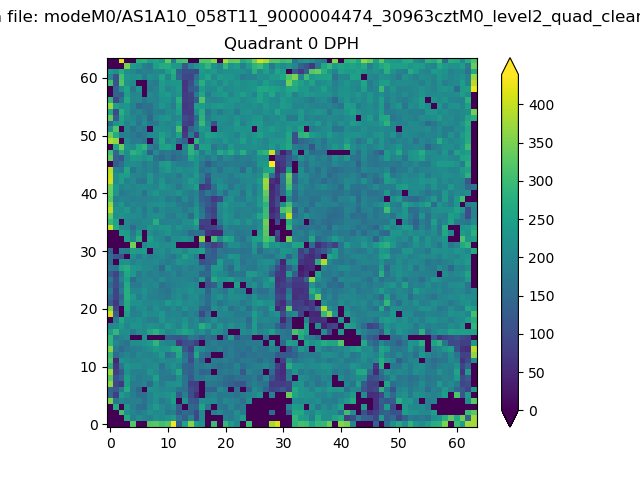 |
 |
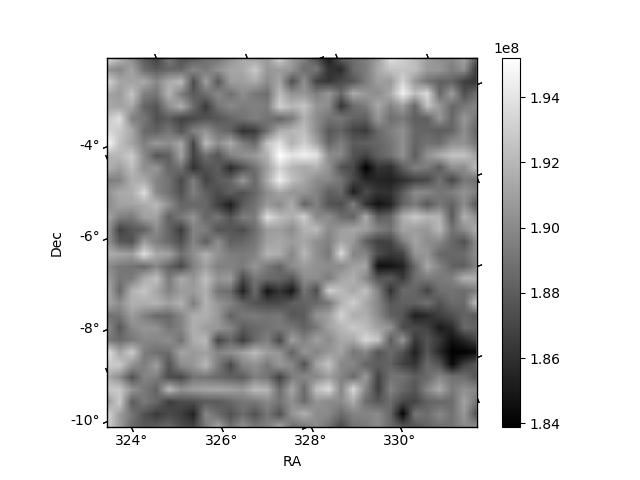
Quadrant B |
|---|---|---|---|
| Quadrant D |  |
 |
Quadrant C |
| Plot type | Count rate plots | Images |
|---|---|---|
| Comparison with Poisson distribution Blue bars denote a histogram of data divided into 1 sec bins. Red curve is a Poisson curve with rate = median count rate of data. |
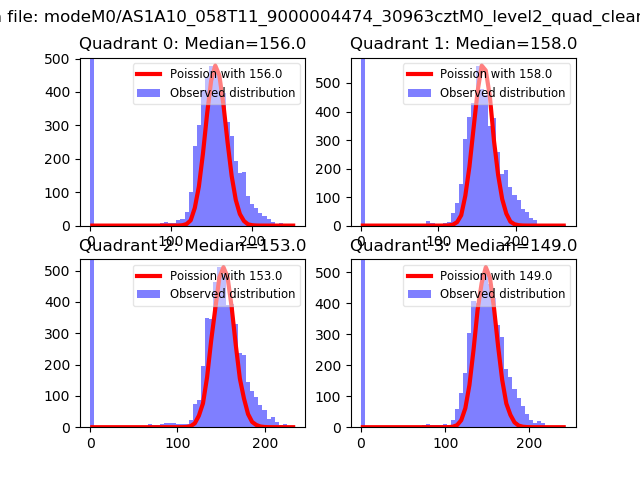 |
 |
| Quadrant-wise count rates Data is divided into 100 sec bins |
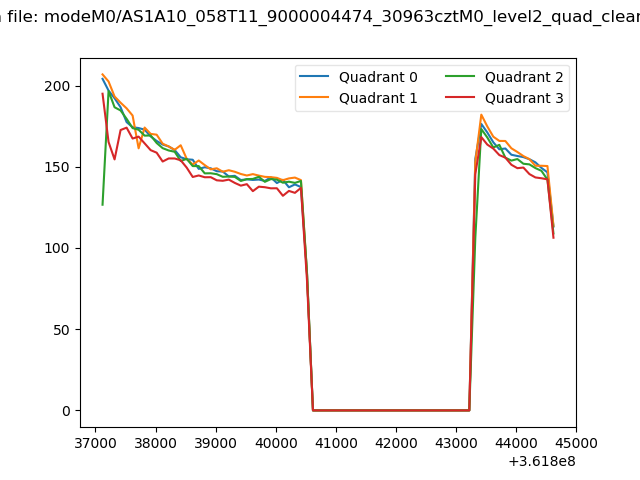 |
|
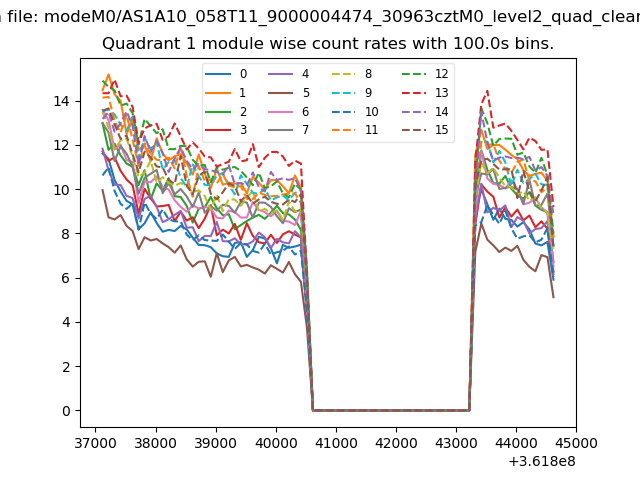
| Module-wise count rates for Quadrant A Data is divided into 100 sec bins |
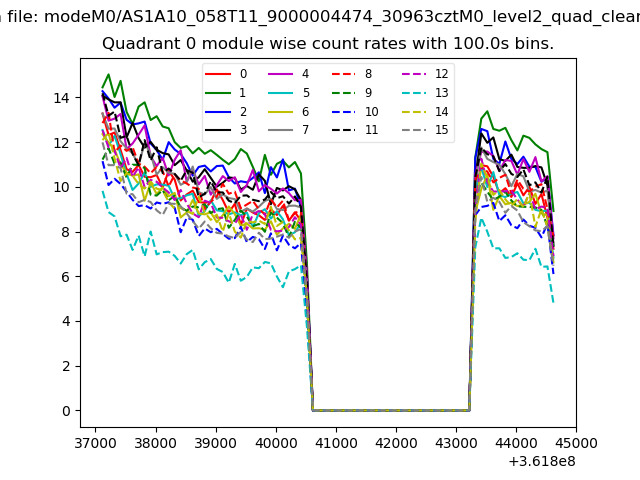 |
 |
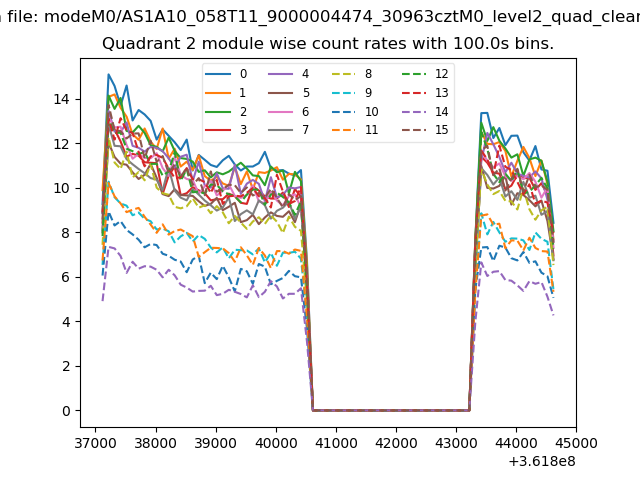
| Module-wise count rates for Quadrant B Data is divided into 100 sec bins |
 |
 |
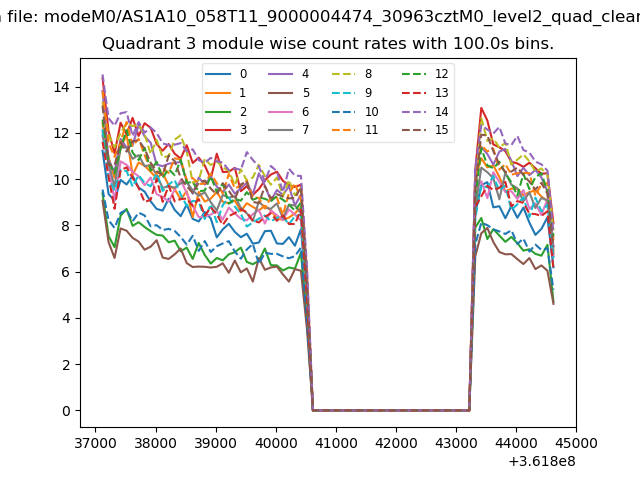
| Module-wise count rates for Quadrant C Data is divided into 100 sec bins |
 |
 |
| Module-wise count rates for Quadrant D Data is divided into 100 sec bins |
 |
 |
| Parameter | Plot |
|---|---|
| CZT HV Monitor | 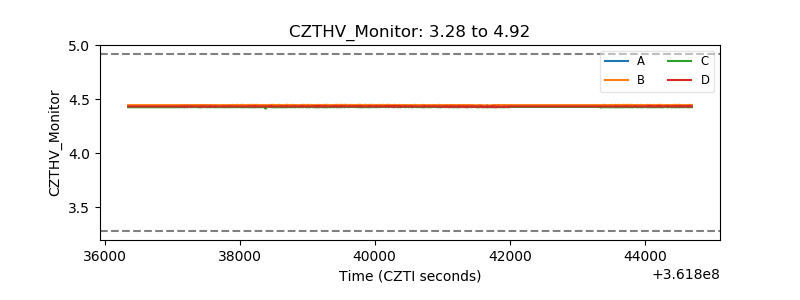 |
| D_VDD | 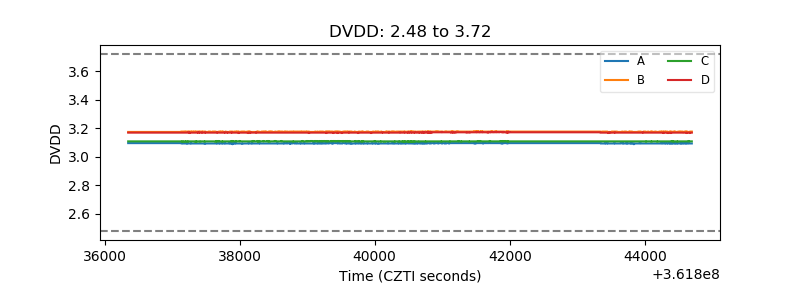 |
| Temperature 1 |  |
| Veto HV Monitor | 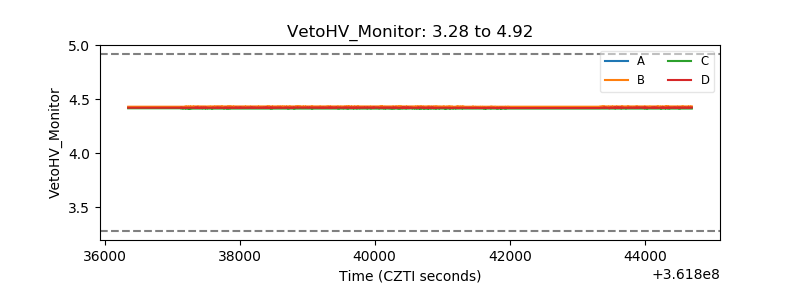 |
| Veto LLD | 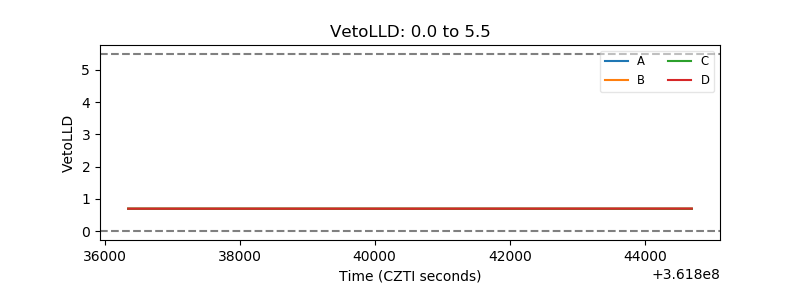 |
| Alpha Counter | 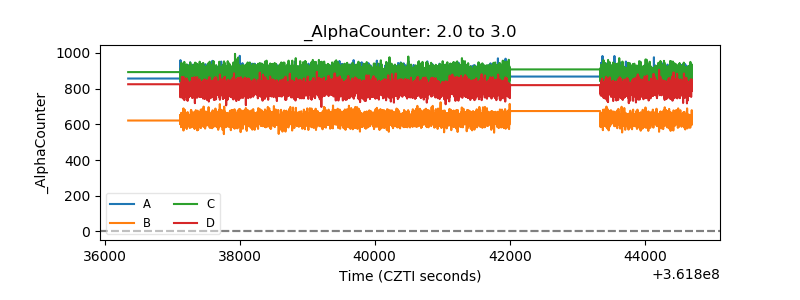 |
| _CPM_Rate | 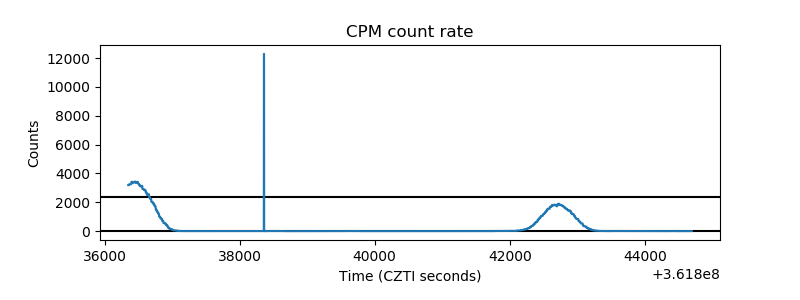 |
| CZT Counter |  |
| +2.5 Volts monitor |  |
| +5 Volts monitor |  |
| _ROLL_ROT | 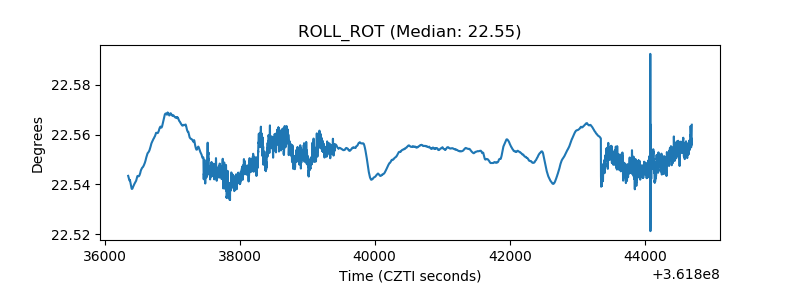 |
| _Roll_DEC | 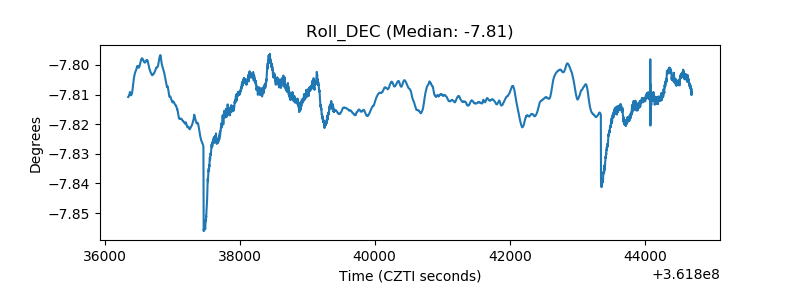 |
| _Roll_RA |  |
| Veto Counter | 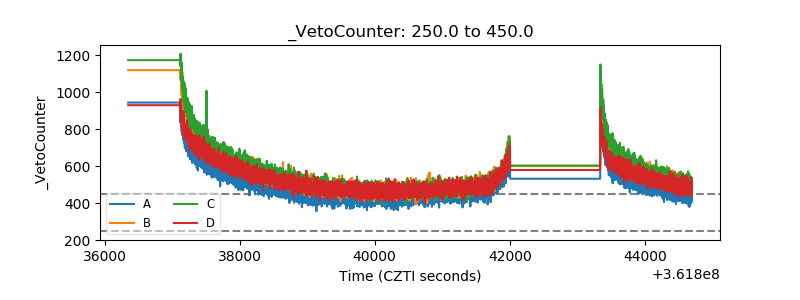 |