| Param | Original file | Final file |
|---|---|---|
| Filename | modeM0/AS1A10_058T11_9000004474_30966cztM0_level2.evt | modeM0/AS1A10_058T11_9000004474_30966cztM0_level2_quad_clean.evt |
| Size (bytes) | 577,866,240 | 99,348,480 |
| Size | 551.1 MB | 94.7 MB |
| Events in quadrant A | 3,406,016 | 639,565 |
| Events in quadrant B | 5,507,794 | 636,847 |
| Events in quadrant C | 3,877,717 | 619,965 |
| Events in quadrant D | 4,225,464 | 615,161 |
| Mode M9 | |||
|---|---|---|---|
| Quadrant | BADHDUFLAG | Total packets | Discarded packets |
| A | 0 | 2 | 0 |
| B | 0 | 2 | 0 |
| C | 0 | 2 | 0 |
| D | 0 | 2 | 0 |
| Mode M0 | |||
|---|---|---|---|
| Quadrant | BADHDUFLAG | Total packets | Discarded packets |
| A | 0 | 14685 | 1 |
| B | 0 | 21724 | 1 |
| C | 0 | 15928 | 1 |
| D | 0 | 17208 | 1 |
| Mode SS | |||
|---|---|---|---|
| Quadrant | BADHDUFLAG | Total packets | Discarded packets |
| A | 0 | 146 | 0 |
| B | 0 | 146 | 0 |
| C | 0 | 146 | 0 |
| D | 0 | 146 | 0 |
| Quadrant | Total seconds | Saturated seconds | Saturation percentage |
|---|---|---|---|
| A | 7140 | 127 | 1.778711% |
| B | 7141 | 224 | 3.136816% |
| C | 7141 | 214 | 2.996779% |
| D | 7141 | 273 | 3.822994% |
Noise dominated data is calculated using 1-second bins in cleaned event files. If a bin has >2000 counts, and if more than 50% of those come from <1% of pixels, then it is considered to be noise-dominated and hence unusable.
| Quadrant | # 1 sec bins | Bins with >0 counts | Bins with >2000 counts | High rate bins dominated by noise | Noise dominated (total time) | Noise dominated (detector-on time) | Marked lightcurve |
|---|---|---|---|---|---|---|---|
| A | 7330 | 7141 | 0 | 0 | 0.00% | 0.00% | 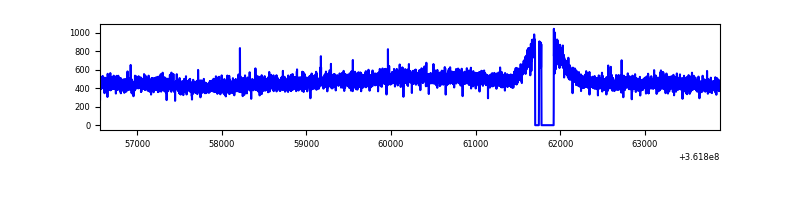 |
| B | 7331 | 7143 | 5 | 5 | 0.07% | 0.07% | 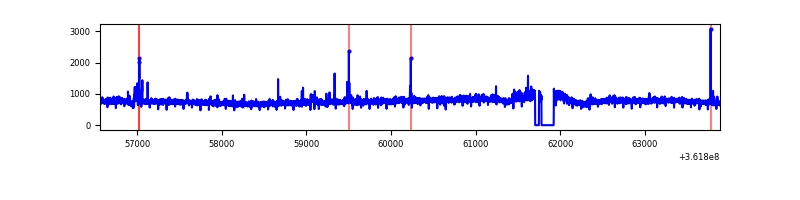 |
| C | 7331 | 7141 | 34 | 34 | 0.46% | 0.48% | 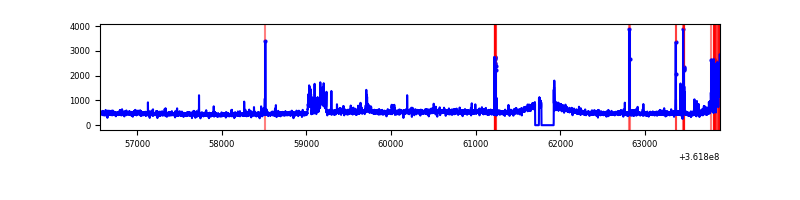 |
| D | 7331 | 7143 | 150 | 150 | 2.05% | 2.10% | 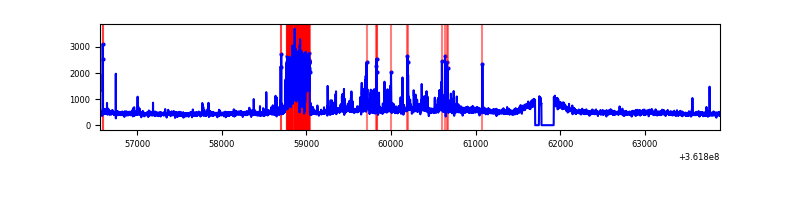 |
Top three noisy pixels from each quadrant. If the there are fewer than three noisy pixels in the level2.evt file, extra rows are filled as -1
| Pixel properties | Quadrant properties | ||||||
|---|---|---|---|---|---|---|---|
| Quadrant | DetID | PixID | Counts | Sigma | Mean | Median | Sigma |
| A | 13 | 254 | 12476 | 64.87 | 882 | 863 | 179.0 |
| A | 3 | 137 | 9253 | 46.86 | 882 | 863 | 179.0 |
| A | 0 | 226 | 7493 | 37.03 | 882 | 863 | 179.0 |
| B | 6 | 159 | 1988650 | 11902.14 | 865 | 844 | 167.0 |
| B | 4 | 80 | 70178 | 415.14 | 865 | 844 | 167.0 |
| B | 0 | 190 | 25450 | 147.33 | 865 | 844 | 167.0 |
| C | 3 | 233 | 260541 | 1301.3 | 845 | 849 | 199.6 |
| C | 0 | 10 | 158867 | 791.82 | 845 | 849 | 199.6 |
| C | 14 | 238 | 137089 | 682.69 | 845 | 849 | 199.6 |
| D | 2 | 250 | 640464 | 3124.39 | 853 | 831 | 204.7 |
| D | 8 | 195 | 354651 | 1728.29 | 853 | 831 | 204.7 |
| D | 2 | 234 | 35656 | 170.11 | 853 | 831 | 204.7 |
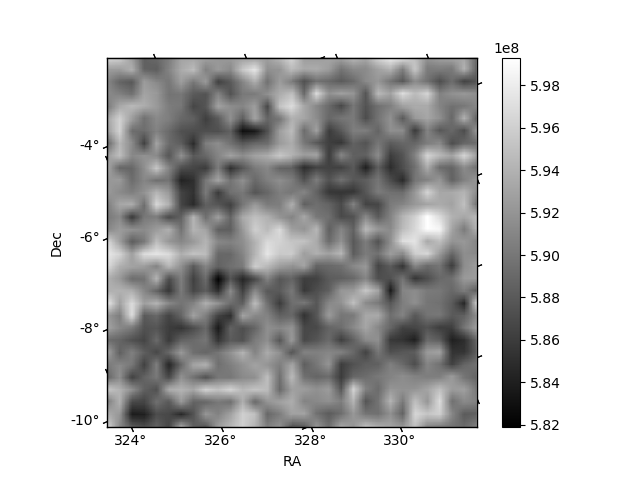
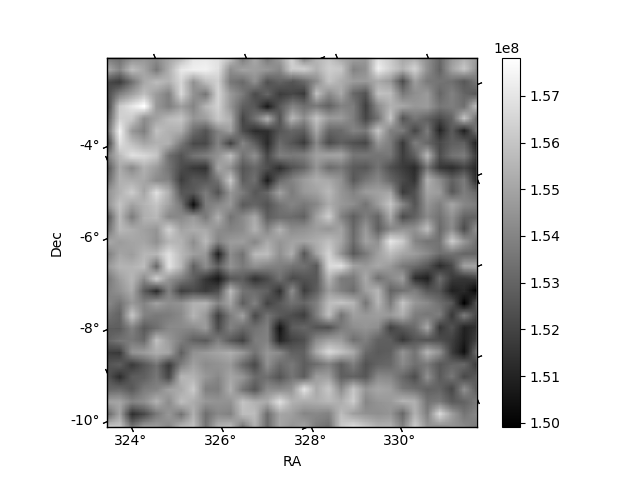
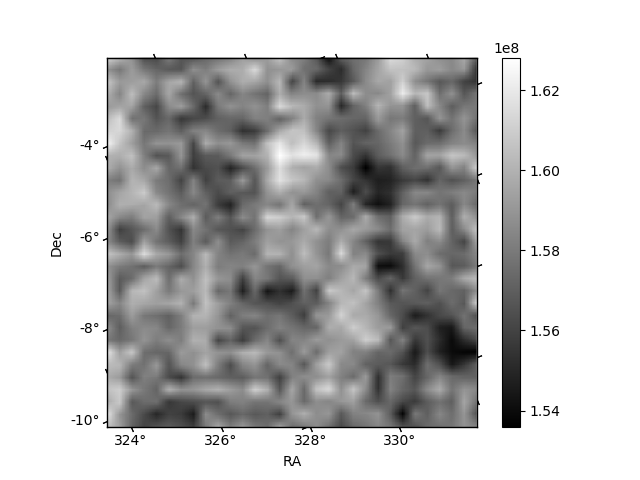
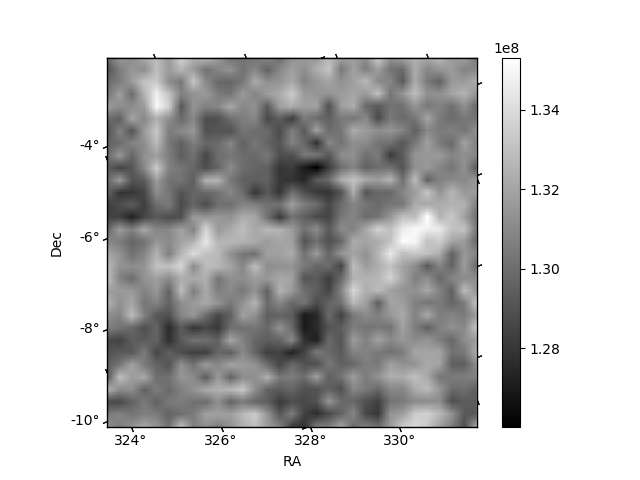
Histogram calculated using DETX and DETY for each event in the final _common_clean file
| Quadrant A | 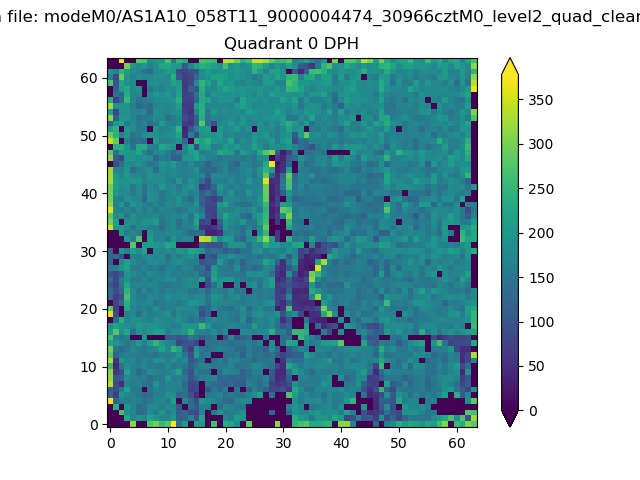 |
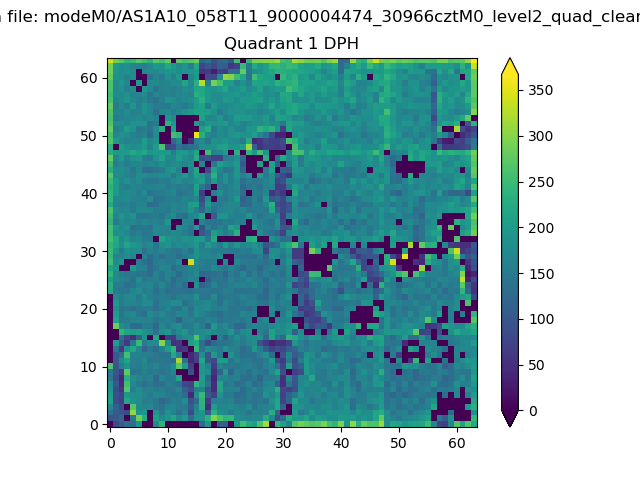 |
Quadrant B |
|---|---|---|---|
| Quadrant D | 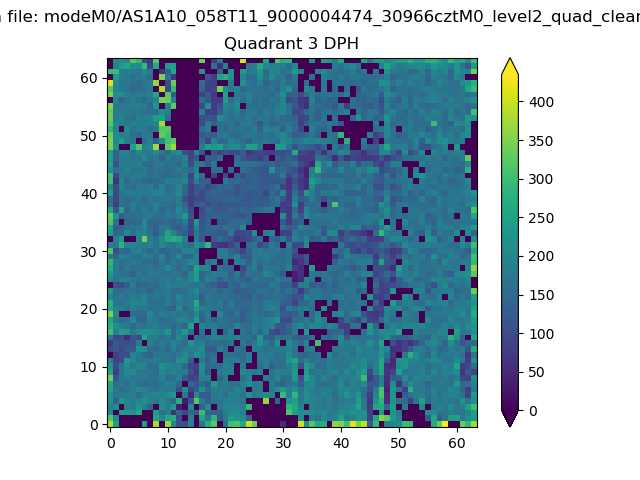 |
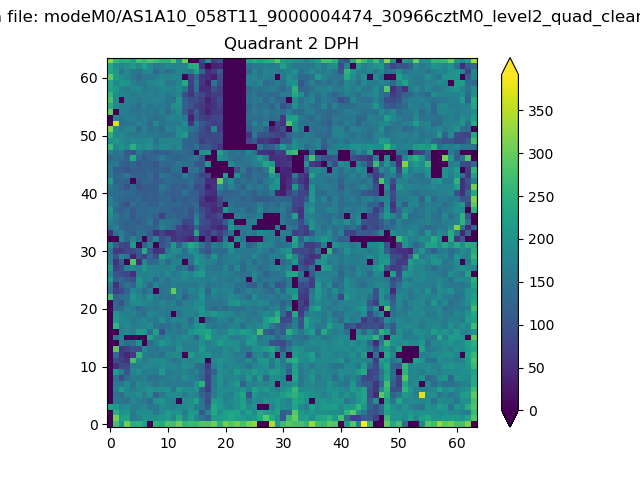 |
Quadrant C |
| Plot type | Count rate plots | Images |
|---|---|---|
| Comparison with Poisson distribution Blue bars denote a histogram of data divided into 1 sec bins. Red curve is a Poisson curve with rate = median count rate of data. |
 |
 |
| Quadrant-wise count rates Data is divided into 100 sec bins |
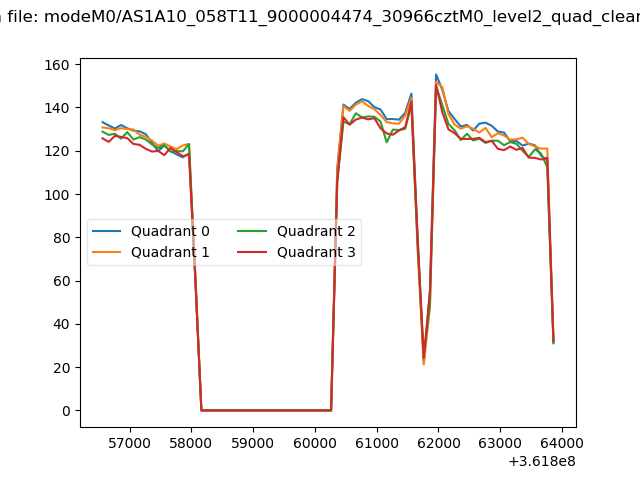 |
|
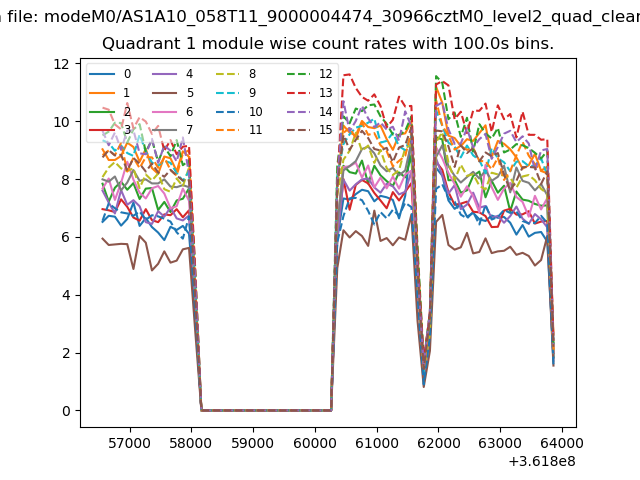
| Module-wise count rates for Quadrant A Data is divided into 100 sec bins |
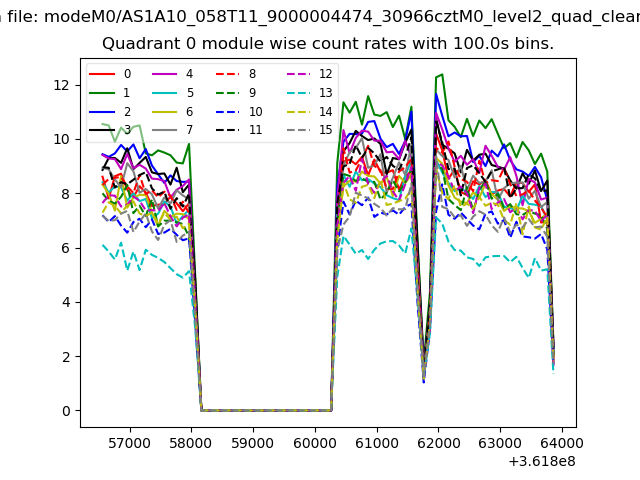 |
 |
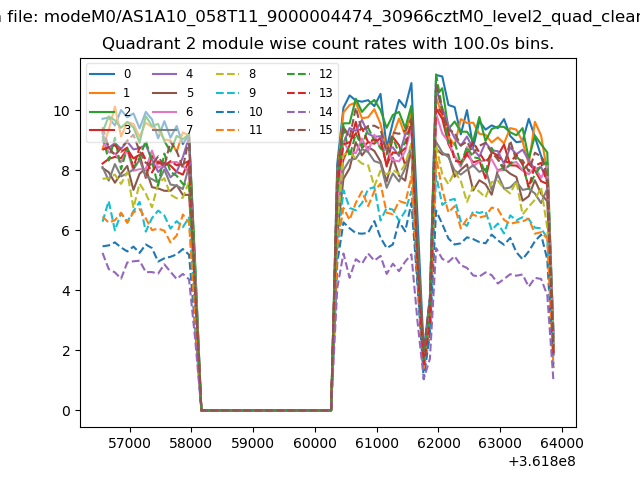
| Module-wise count rates for Quadrant B Data is divided into 100 sec bins |
 |
 |
| Module-wise count rates for Quadrant C Data is divided into 100 sec bins |
 |
 |
| Module-wise count rates for Quadrant D Data is divided into 100 sec bins |
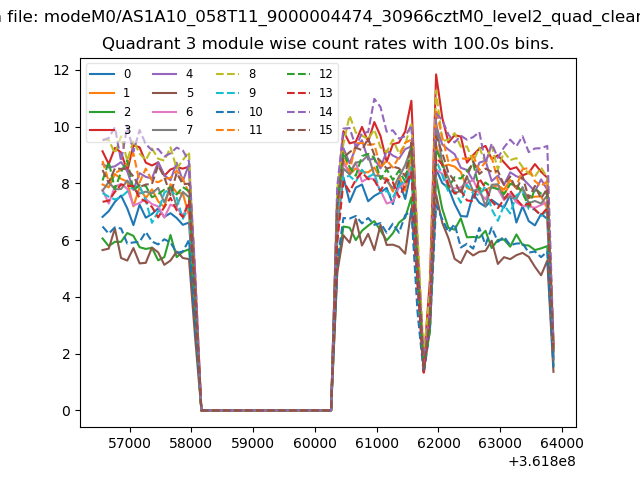 |
 |
| Parameter | Plot |
|---|---|
| CZT HV Monitor | 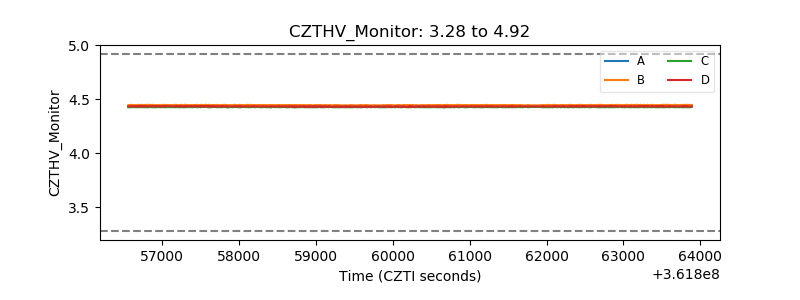 |
| D_VDD | 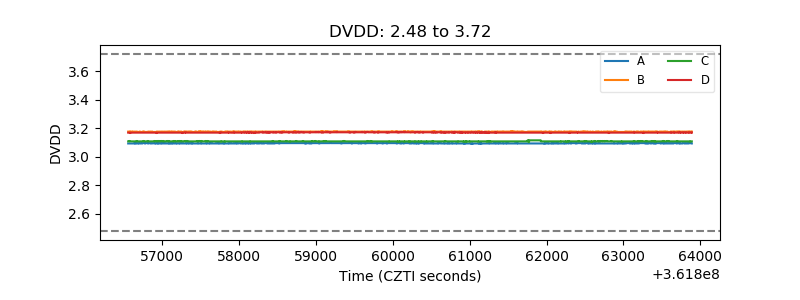 |
| Temperature 1 | 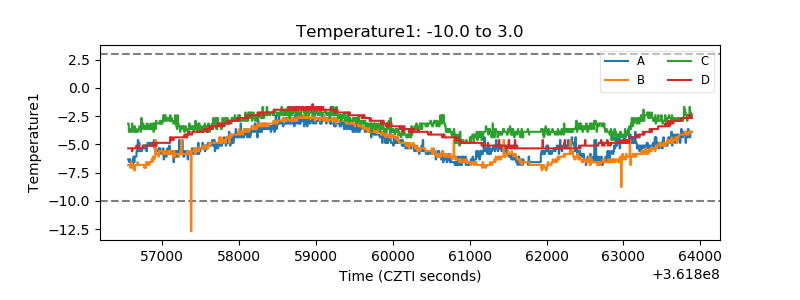 |
| Veto HV Monitor |  |
| Veto LLD | 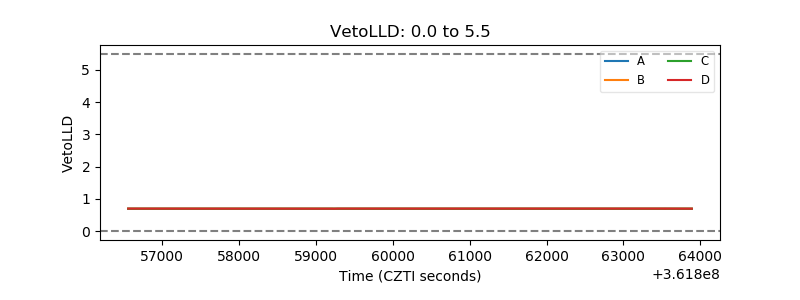 |
| Alpha Counter | 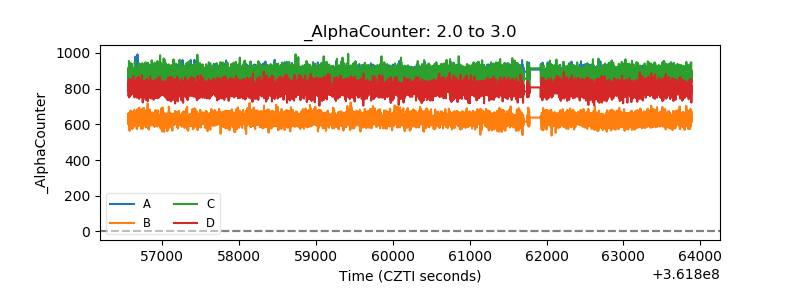 |
| _CPM_Rate | 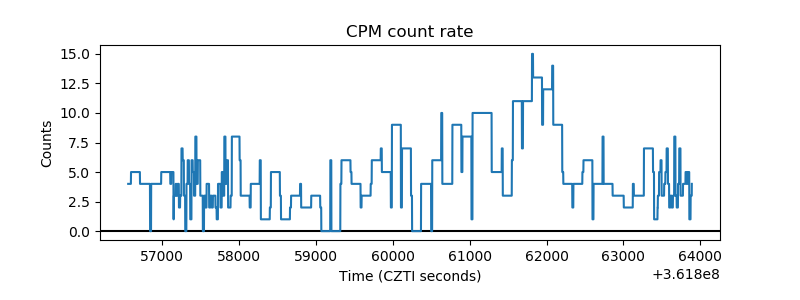 |
| CZT Counter |  |
| +2.5 Volts monitor |  |
| +5 Volts monitor |  |
| _ROLL_ROT | 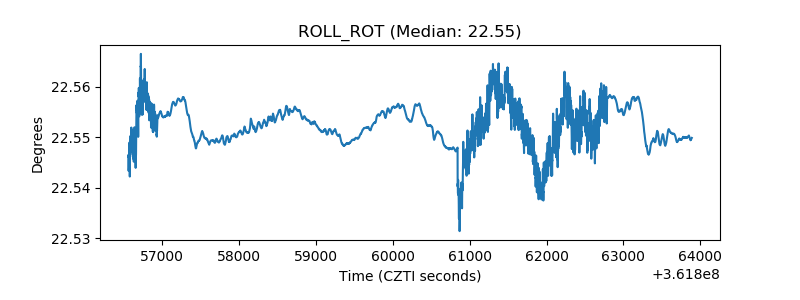 |
| _Roll_DEC |  |
| _Roll_RA | 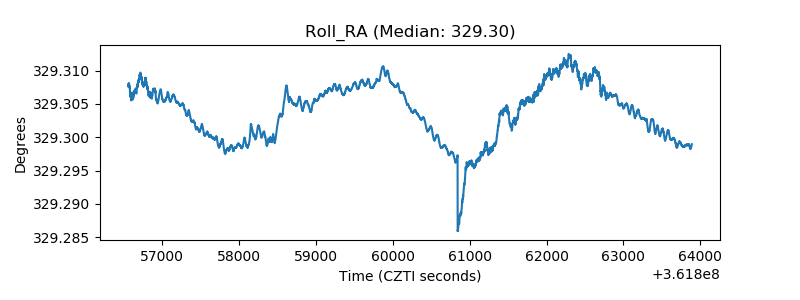 |
| Veto Counter | 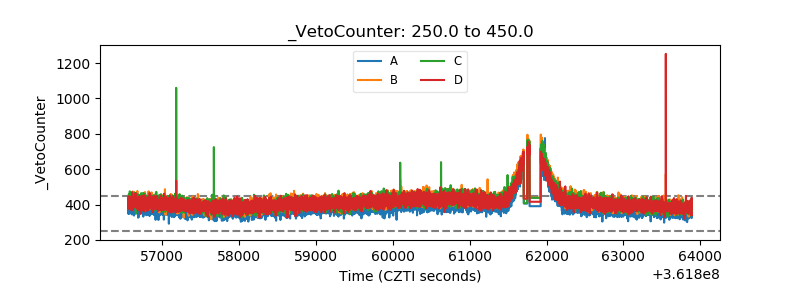 |