| Param | Original file | Final file |
|---|---|---|
| Filename | modeM0/AS1A10_058T11_9000004474_30967cztM0_level2.evt | modeM0/AS1A10_058T11_9000004474_30967cztM0_level2_quad_clean.evt |
| Size (bytes) | 1,564,266,240 | 242,184,960 |
| Size | 1.5 GB | 231.0 MB |
| Events in quadrant A | 9,031,068 | 1,545,536 |
| Events in quadrant B | 14,516,264 | 1,534,435 |
| Events in quadrant C | 11,611,989 | 1,488,709 |
| Events in quadrant D | 10,954,767 | 1,477,985 |
| Mode M9 | |||
|---|---|---|---|
| Quadrant | BADHDUFLAG | Total packets | Discarded packets |
| A | 0 | 9 | 0 |
| B | 0 | 9 | 0 |
| C | 0 | 9 | 0 |
| D | 0 | 9 | 0 |
| Mode M0 | |||
|---|---|---|---|
| Quadrant | BADHDUFLAG | Total packets | Discarded packets |
| A | 0 | 38663 | 3 |
| B | 0 | 57263 | 2 |
| C | 0 | 46441 | 2 |
| D | 0 | 44326 | 2 |
| Mode SS | |||
|---|---|---|---|
| Quadrant | BADHDUFLAG | Total packets | Discarded packets |
| A | 0 | 380 | 0 |
| B | 0 | 380 | 0 |
| C | 0 | 380 | 0 |
| D | 0 | 380 | 0 |
| Quadrant | Total seconds | Saturated seconds | Saturation percentage |
|---|---|---|---|
| A | 18688 | 398 | 2.129709% |
| B | 18688 | 720 | 3.852740% |
| C | 18688 | 899 | 4.810574% |
| D | 18688 | 600 | 3.210616% |
Noise dominated data is calculated using 1-second bins in cleaned event files. If a bin has >2000 counts, and if more than 50% of those come from <1% of pixels, then it is considered to be noise-dominated and hence unusable.
| Quadrant | # 1 sec bins | Bins with >0 counts | Bins with >2000 counts | High rate bins dominated by noise | Noise dominated (total time) | Noise dominated (detector-on time) | Marked lightcurve |
|---|---|---|---|---|---|---|---|
| A | 19598 | 18690 | 0 | 0 | 0.00% | 0.00% | 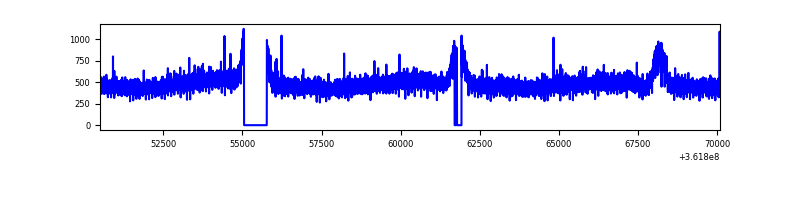 |
| B | 19598 | 18691 | 20 | 20 | 0.10% | 0.11% | 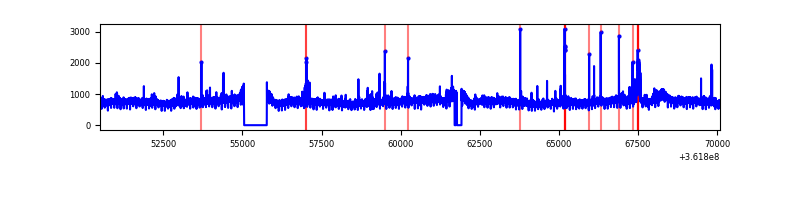 |
| C | 19598 | 18689 | 193 | 193 | 0.98% | 1.03% | 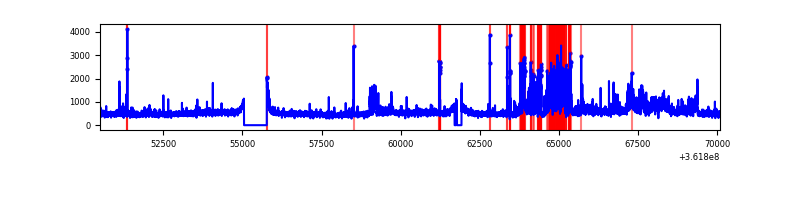 |
| D | 19598 | 18691 | 296 | 296 | 1.51% | 1.58% | 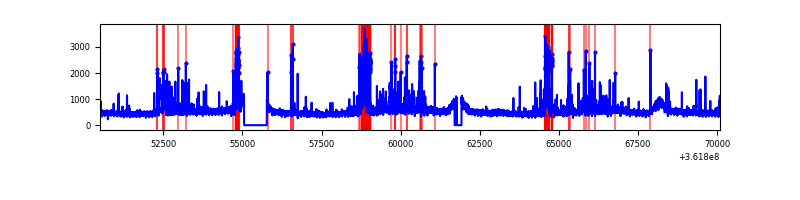 |
Top three noisy pixels from each quadrant. If the there are fewer than three noisy pixels in the level2.evt file, extra rows are filled as -1
| Pixel properties | Quadrant properties | ||||||
|---|---|---|---|---|---|---|---|
| Quadrant | DetID | PixID | Counts | Sigma | Mean | Median | Sigma |
| A | 13 | 254 | 32833 | 65.1 | 2336 | 2282 | 469.3 |
| A | 3 | 137 | 24240 | 46.79 | 2336 | 2282 | 469.3 |
| A | 11 | 47 | 20871 | 39.61 | 2336 | 2282 | 469.3 |
| B | 6 | 159 | 5134124 | 11681.14 | 2291 | 2229 | 439.3 |
| B | 4 | 80 | 239522 | 540.12 | 2291 | 2229 | 439.3 |
| B | 0 | 190 | 78910 | 174.54 | 2291 | 2229 | 439.3 |
| C | 3 | 233 | 2007016 | 3848.36 | 2228 | 2244 | 520.9 |
| C | 0 | 10 | 499267 | 954.09 | 2228 | 2244 | 520.9 |
| C | 14 | 238 | 356990 | 680.97 | 2228 | 2244 | 520.9 |
| D | 2 | 250 | 1213559 | 2248.94 | 2266 | 2204 | 538.6 |
| D | 8 | 195 | 891949 | 1651.86 | 2266 | 2204 | 538.6 |
| D | 13 | 174 | 233700 | 429.78 | 2266 | 2204 | 538.6 |
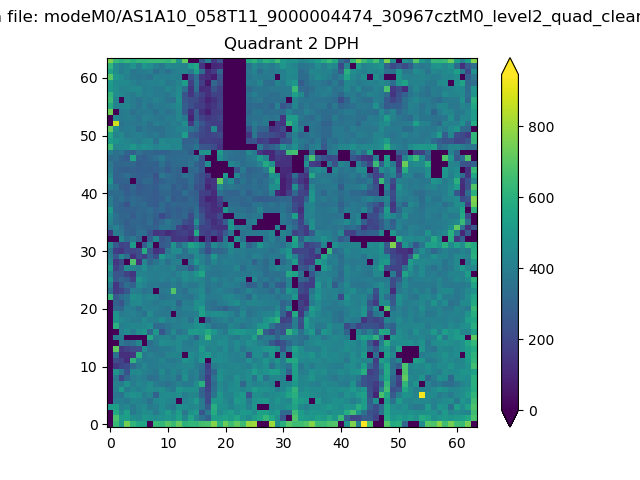
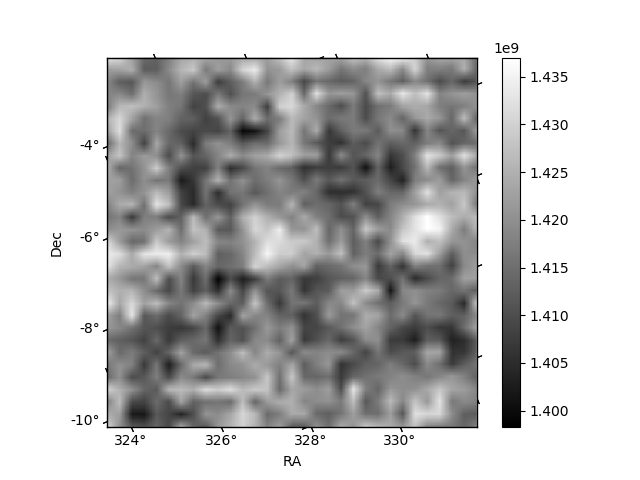
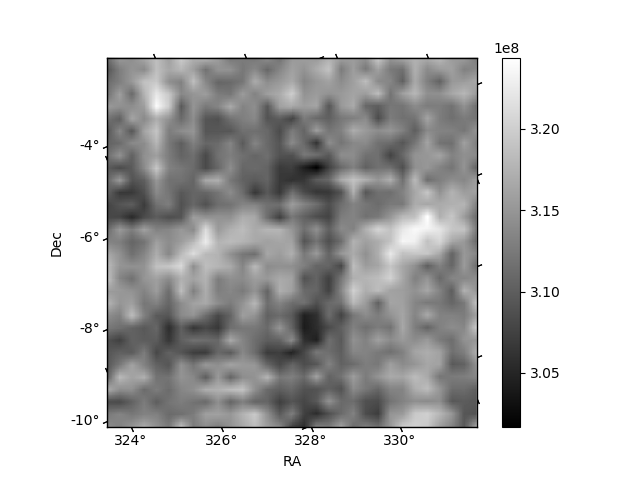
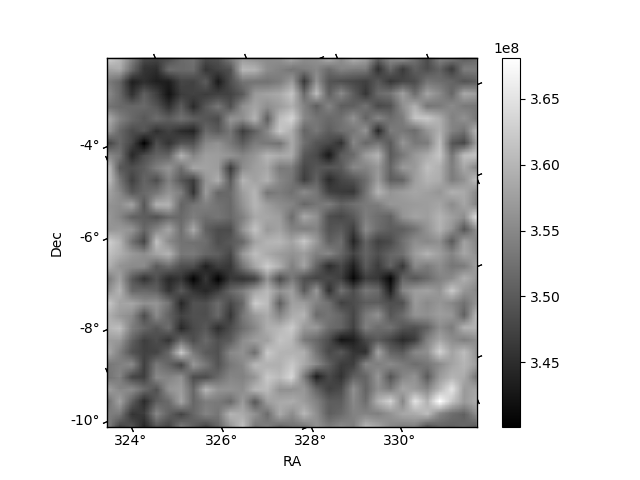
Histogram calculated using DETX and DETY for each event in the final _common_clean file
| Quadrant A | 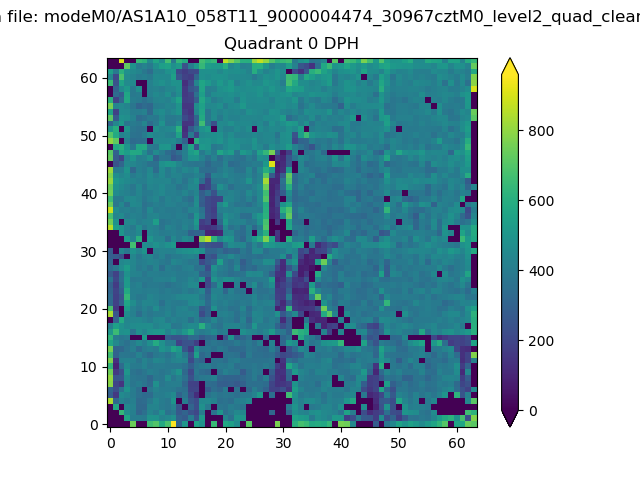 |
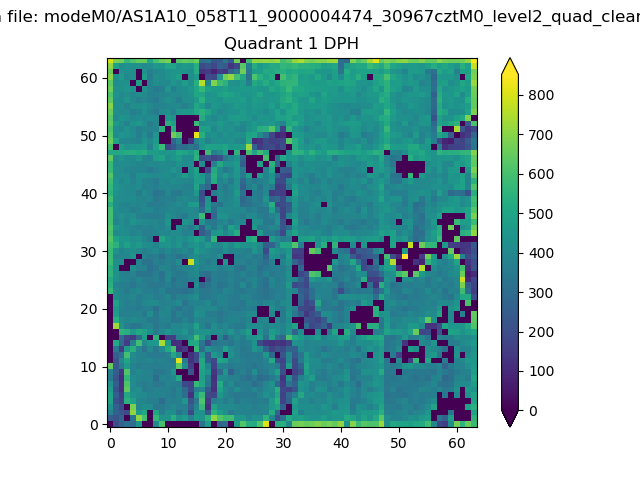 |
Quadrant B |
|---|---|---|---|
| Quadrant D | 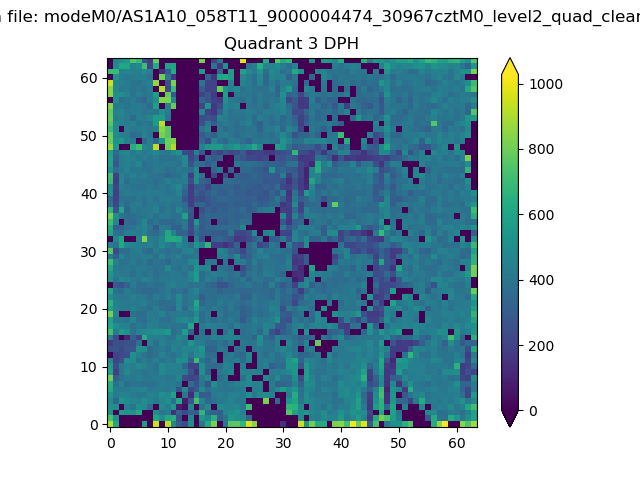 |
 |
Quadrant C |
| Plot type | Count rate plots | Images |
|---|---|---|
| Comparison with Poisson distribution Blue bars denote a histogram of data divided into 1 sec bins. Red curve is a Poisson curve with rate = median count rate of data. |
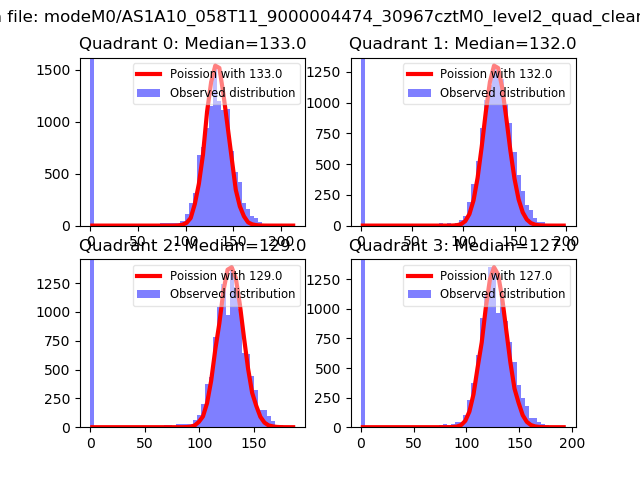 |
 |
| Quadrant-wise count rates Data is divided into 100 sec bins |
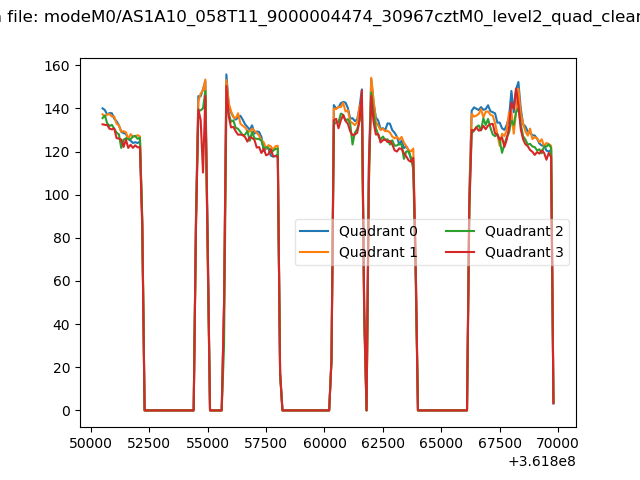 |
|
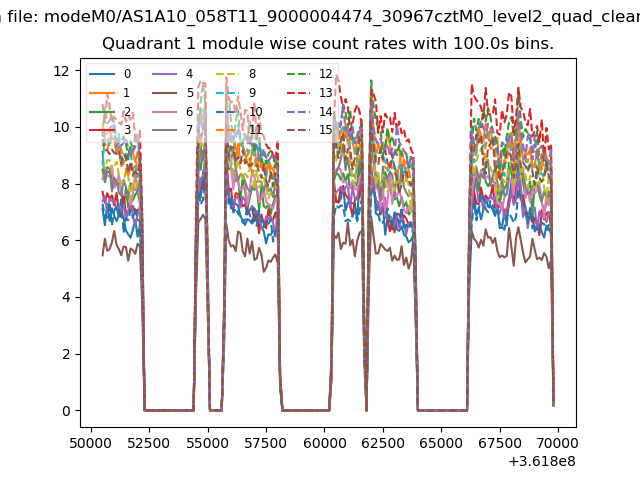
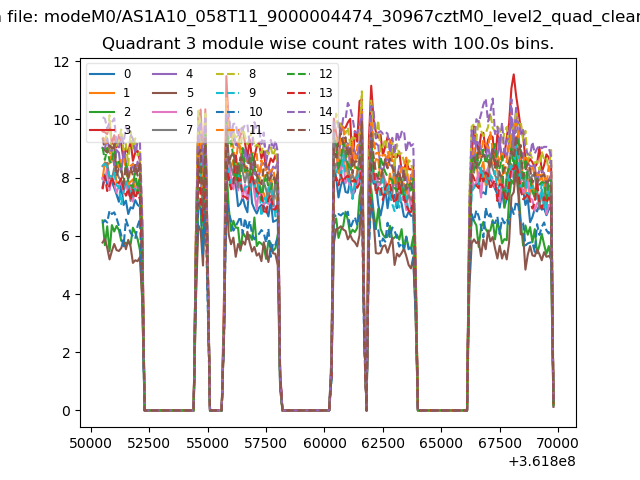
| Module-wise count rates for Quadrant A Data is divided into 100 sec bins |
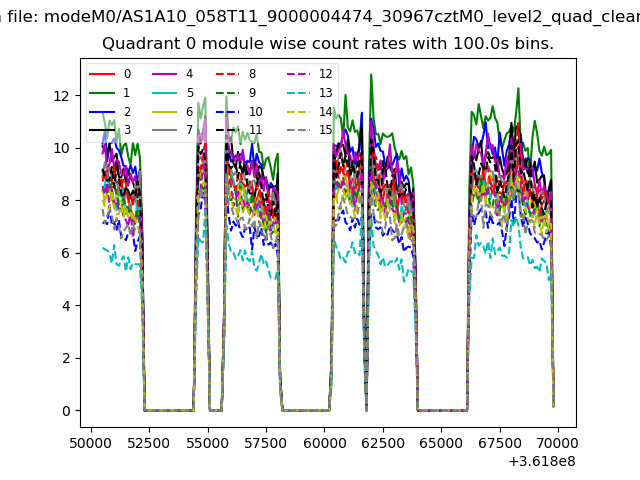 |
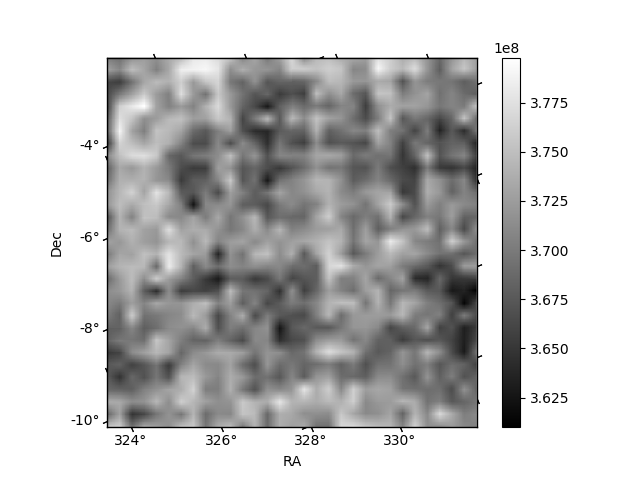 |
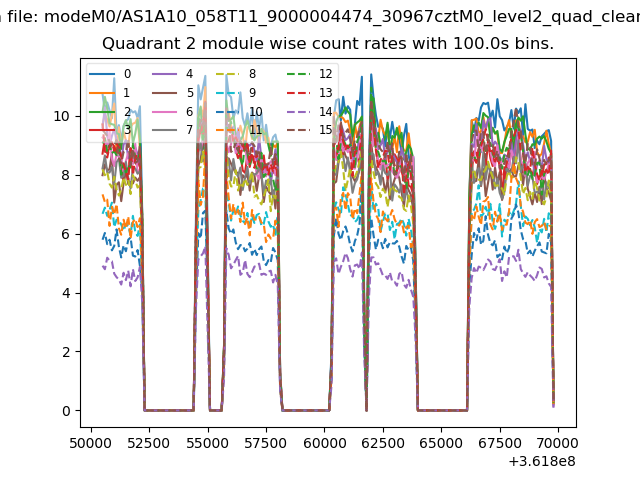
| Module-wise count rates for Quadrant B Data is divided into 100 sec bins |
 |
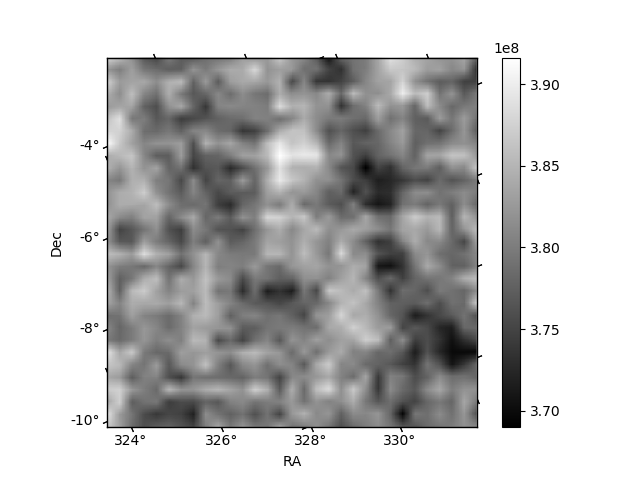 |
| Module-wise count rates for Quadrant C Data is divided into 100 sec bins |
 |
 |
| Module-wise count rates for Quadrant D Data is divided into 100 sec bins |
 |
 |
| Parameter | Plot |
|---|---|
| CZT HV Monitor | 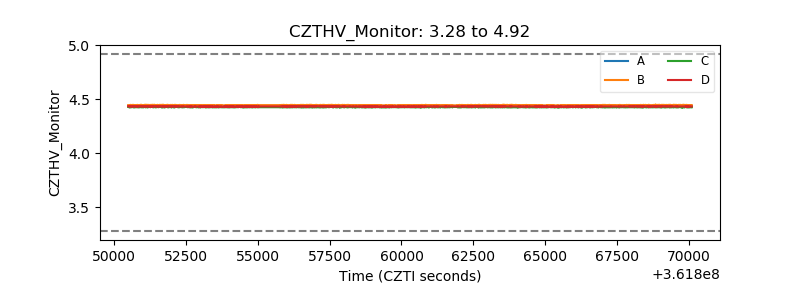 |
| D_VDD | 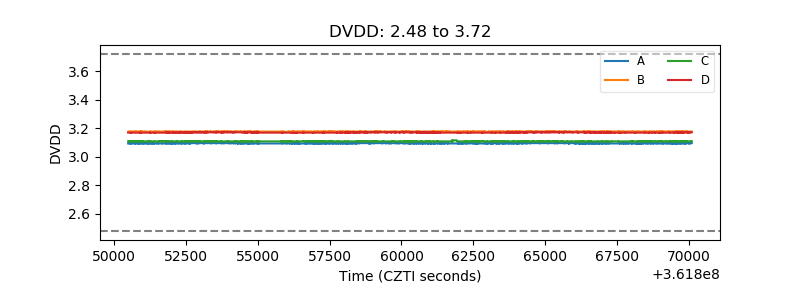 |
| Temperature 1 | 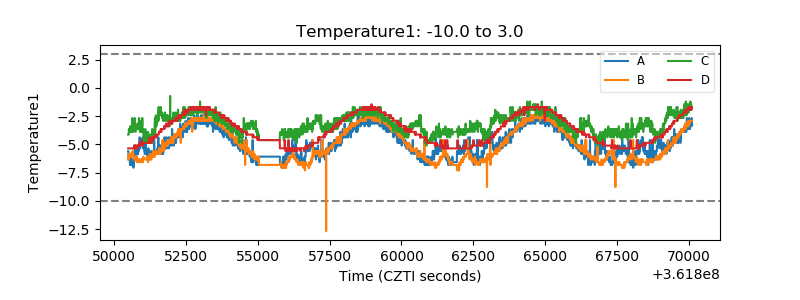 |
| Veto HV Monitor | 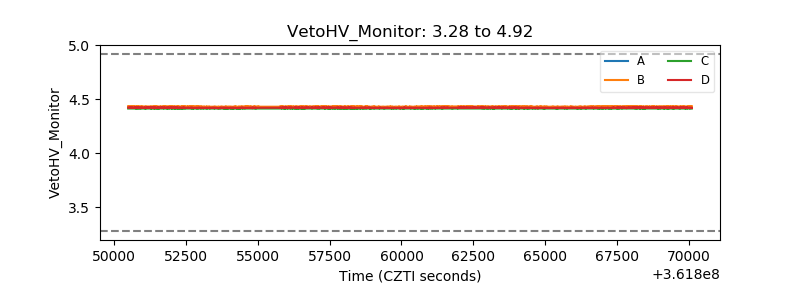 |
| Veto LLD | 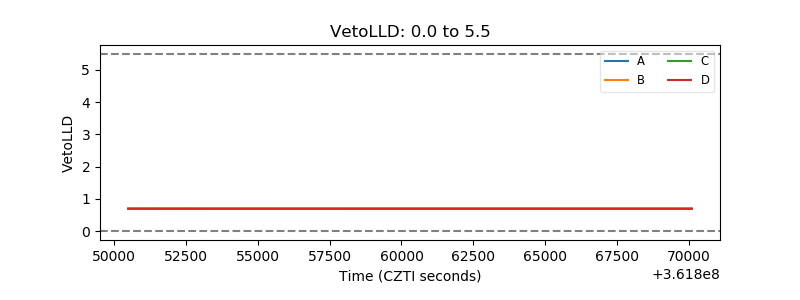 |
| Alpha Counter | 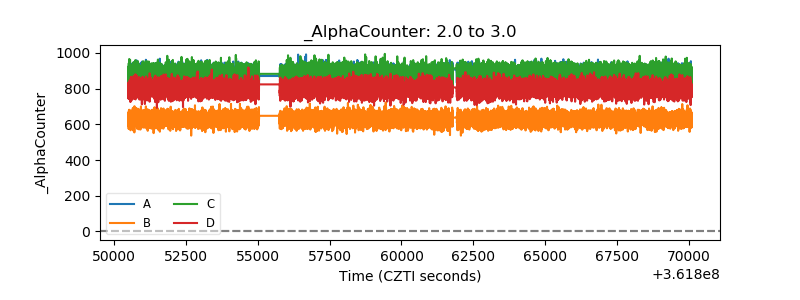 |
| _CPM_Rate | 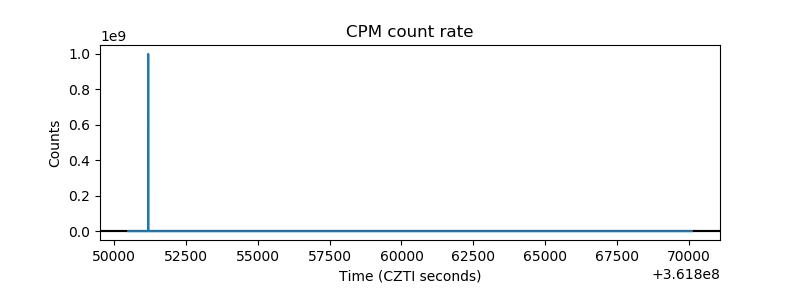 |
| CZT Counter | 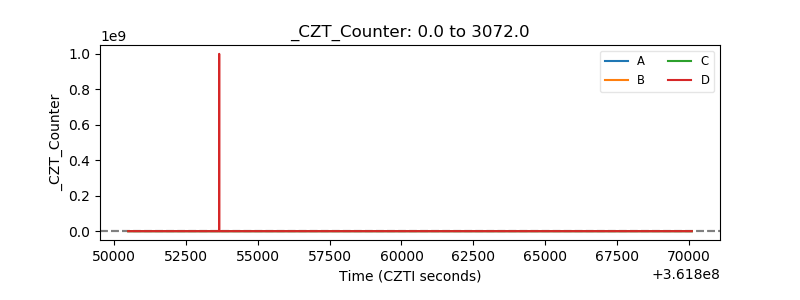 |
| +2.5 Volts monitor | 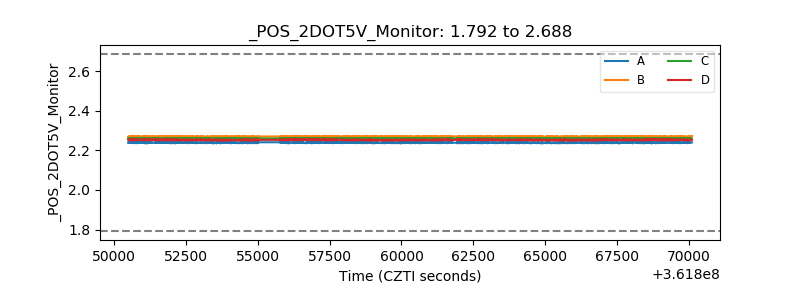 |
| +5 Volts monitor |  |
| _ROLL_ROT | 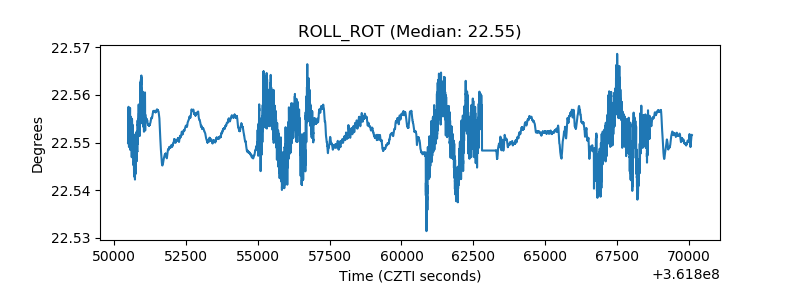 |
| _Roll_DEC | 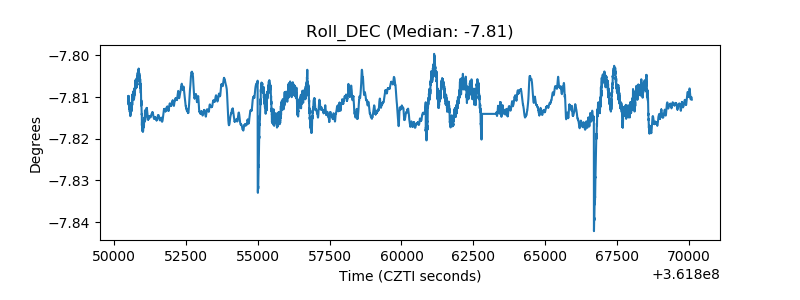 |
| _Roll_RA | 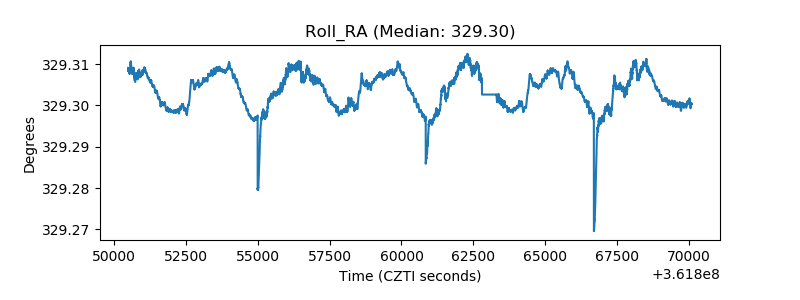 |
| Veto Counter | 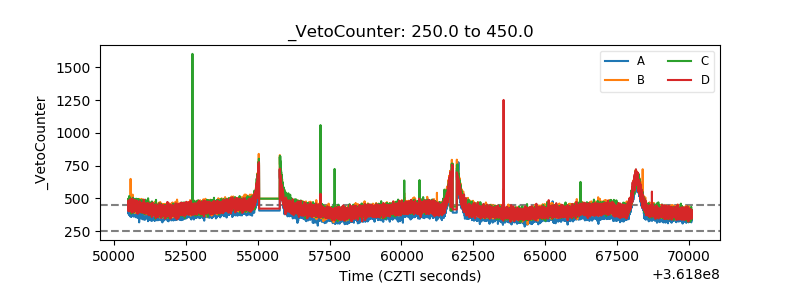 |