| Param | Original file | Final file |
|---|---|---|
| Filename | modeM0/AS1A10_058T11_9000004474_30968cztM0_level2.evt | modeM0/AS1A10_058T11_9000004474_30968cztM0_level2_quad_clean.evt |
| Size (bytes) | 551,632,320 | 85,029,120 |
| Size | 526.1 MB | 81.1 MB |
| Events in quadrant A | 3,314,457 | 532,527 |
| Events in quadrant B | 5,349,718 | 530,733 |
| Events in quadrant C | 3,776,813 | 514,209 |
| Events in quadrant D | 3,789,795 | 508,751 |
| Mode M9 | |||
|---|---|---|---|
| Quadrant | BADHDUFLAG | Total packets | Discarded packets |
| A | 0 | 3 | 0 |
| B | 0 | 3 | 0 |
| C | 0 | 3 | 0 |
| D | 0 | 3 | 0 |
| Mode M0 | |||
|---|---|---|---|
| Quadrant | BADHDUFLAG | Total packets | Discarded packets |
| A | 0 | 14345 | 1 |
| B | 0 | 21330 | 1 |
| C | 0 | 15313 | 1 |
| D | 0 | 15429 | 1 |
| Mode SS | |||
|---|---|---|---|
| Quadrant | BADHDUFLAG | Total packets | Discarded packets |
| A | 0 | 142 | 0 |
| B | 0 | 142 | 0 |
| C | 0 | 142 | 0 |
| D | 0 | 142 | 0 |
| Quadrant | Total seconds | Saturated seconds | Saturation percentage |
|---|---|---|---|
| A | 7013 | 127 | 1.810923% |
| B | 7014 | 199 | 2.837183% |
| C | 7014 | 171 | 2.437981% |
| D | 7014 | 173 | 2.466496% |
Noise dominated data is calculated using 1-second bins in cleaned event files. If a bin has >2000 counts, and if more than 50% of those come from <1% of pixels, then it is considered to be noise-dominated and hence unusable.
| Quadrant | # 1 sec bins | Bins with >0 counts | Bins with >2000 counts | High rate bins dominated by noise | Noise dominated (total time) | Noise dominated (detector-on time) | Marked lightcurve |
|---|---|---|---|---|---|---|---|
| A | 7298 | 7013 | 0 | 0 | 0.00% | 0.00% | 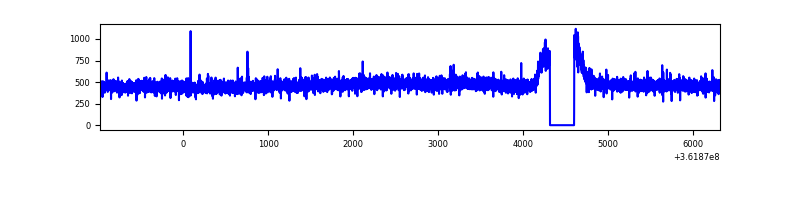 |
| B | 7299 | 7014 | 7 | 7 | 0.10% | 0.10% | 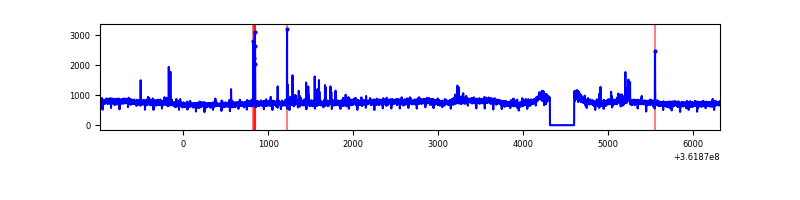 |
| C | 7299 | 7014 | 4 | 4 | 0.05% | 0.06% | 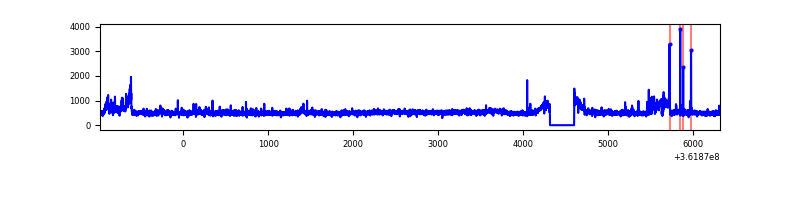 |
| D | 7298 | 7013 | 66 | 66 | 0.90% | 0.94% | 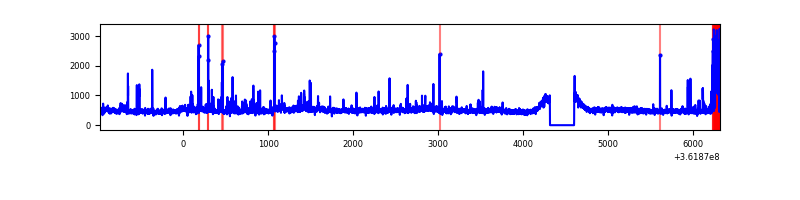 |
Top three noisy pixels from each quadrant. If the there are fewer than three noisy pixels in the level2.evt file, extra rows are filled as -1
| Pixel properties | Quadrant properties | ||||||
|---|---|---|---|---|---|---|---|
| Quadrant | DetID | PixID | Counts | Sigma | Mean | Median | Sigma |
| A | 13 | 254 | 11363 | 60.54 | 859 | 840 | 173.8 |
| A | 3 | 137 | 9045 | 47.2 | 859 | 840 | 173.8 |
| A | 0 | 226 | 7284 | 37.07 | 859 | 840 | 173.8 |
| B | 6 | 159 | 1900272 | 11468.89 | 843 | 820 | 165.6 |
| B | 0 | 190 | 56213 | 334.46 | 843 | 820 | 165.6 |
| B | 4 | 80 | 33027 | 194.47 | 843 | 820 | 165.6 |
| C | 3 | 233 | 310684 | 1603.78 | 821 | 827 | 193.2 |
| C | 14 | 238 | 128616 | 661.42 | 821 | 827 | 193.2 |
| C | 0 | 10 | 105182 | 540.13 | 821 | 827 | 193.2 |
| D | 8 | 195 | 330561 | 1668.27 | 833 | 812 | 197.7 |
| D | 2 | 250 | 252104 | 1271.34 | 833 | 812 | 197.7 |
| D | 2 | 234 | 34600 | 170.94 | 833 | 812 | 197.7 |
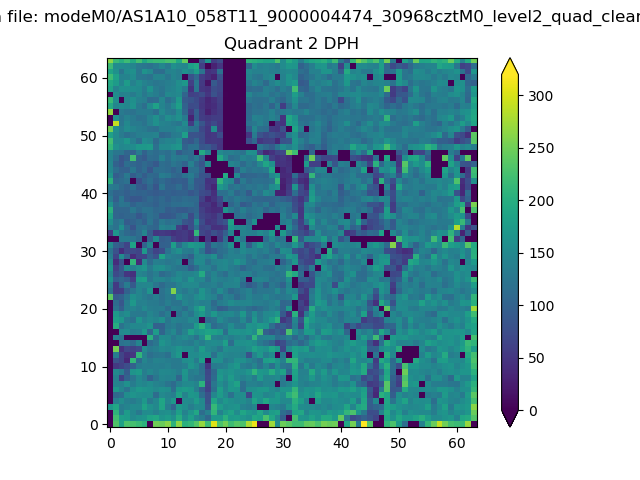
Histogram calculated using DETX and DETY for each event in the final _common_clean file
| Quadrant A | 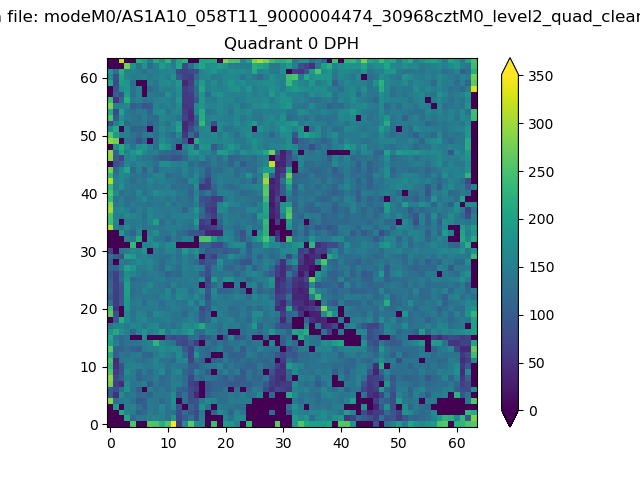 |
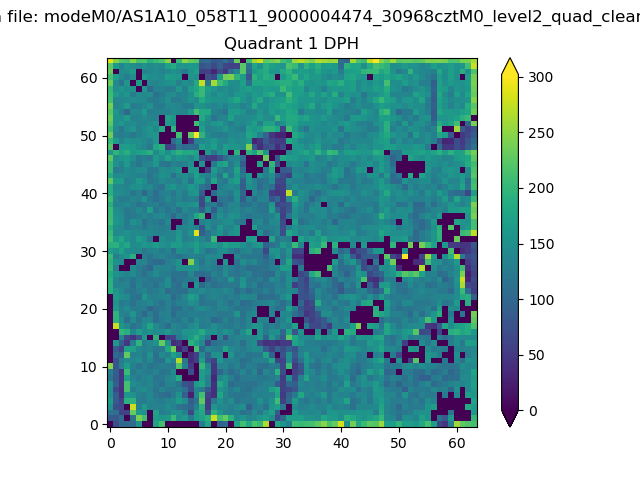 |
Quadrant B |
|---|---|---|---|
| Quadrant D | 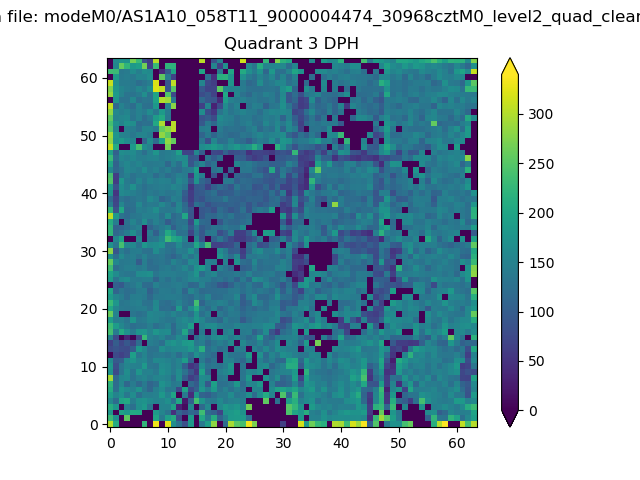 |
 |
Quadrant C |
| Plot type | Count rate plots | Images |
|---|---|---|
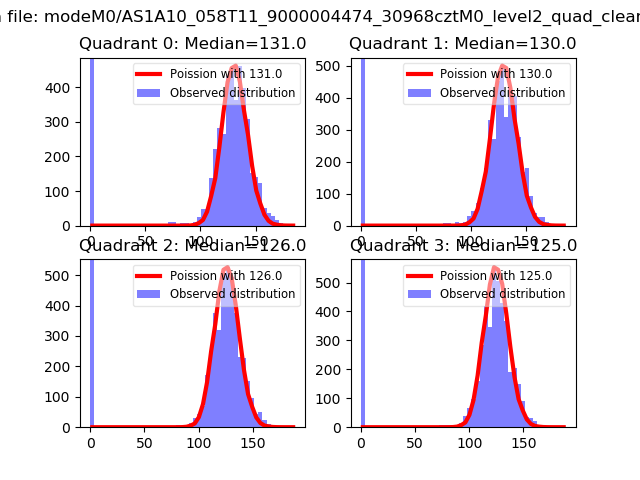
| Comparison with Poisson distribution Blue bars denote a histogram of data divided into 1 sec bins. Red curve is a Poisson curve with rate = median count rate of data. |
 |
 |
| Quadrant-wise count rates Data is divided into 100 sec bins |
 |
|
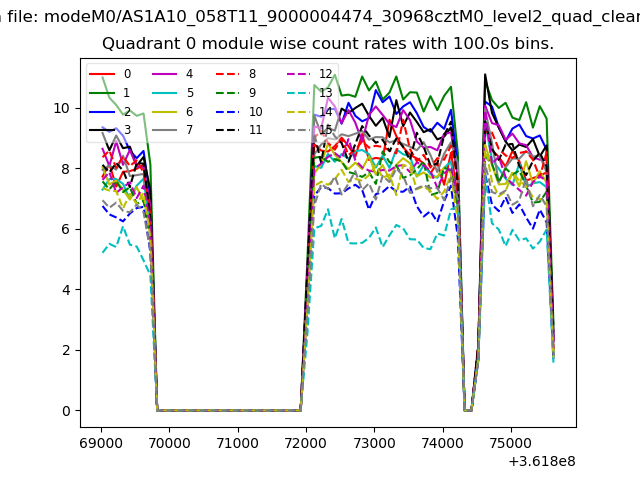
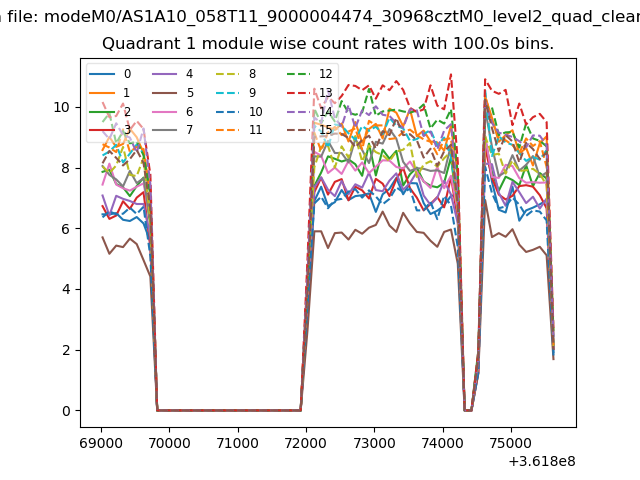
| Module-wise count rates for Quadrant A Data is divided into 100 sec bins |
 |
 |
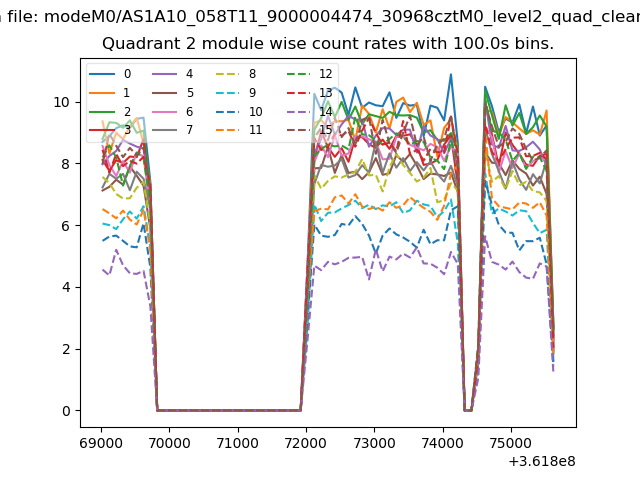
| Module-wise count rates for Quadrant B Data is divided into 100 sec bins |
 |
 |
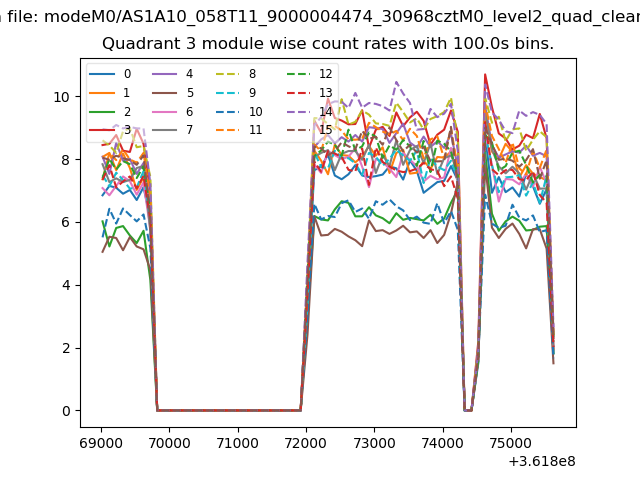
| Module-wise count rates for Quadrant C Data is divided into 100 sec bins |
 |
 |
| Module-wise count rates for Quadrant D Data is divided into 100 sec bins |
 |
 |
| Parameter | Plot |
|---|---|
| CZT HV Monitor | 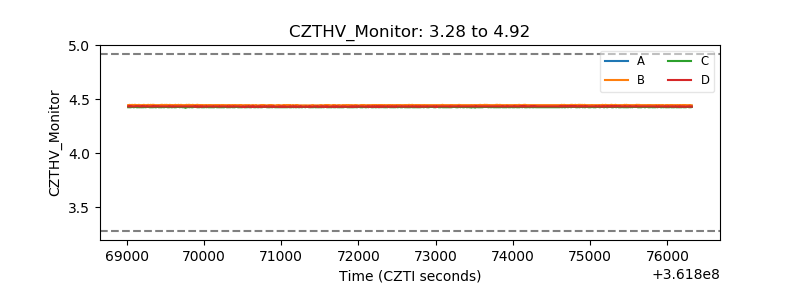 |
| D_VDD | 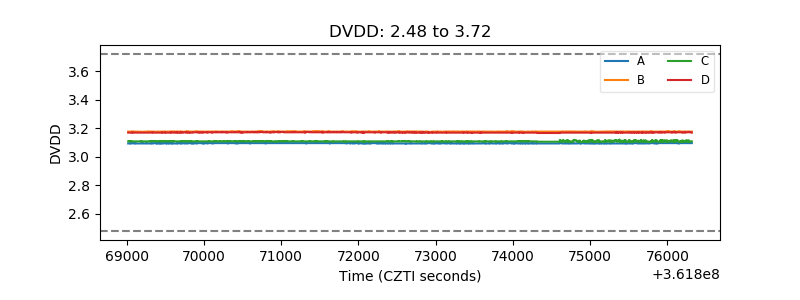 |
| Temperature 1 |  |
| Veto HV Monitor | 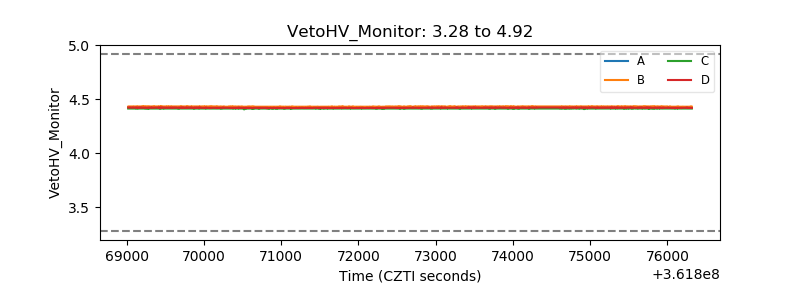 |
| Veto LLD | 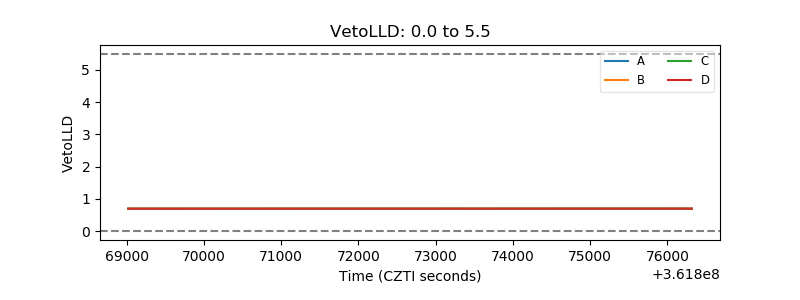 |
| Alpha Counter | 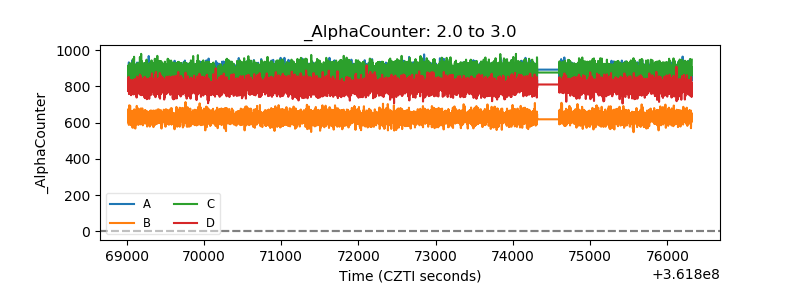 |
| _CPM_Rate | 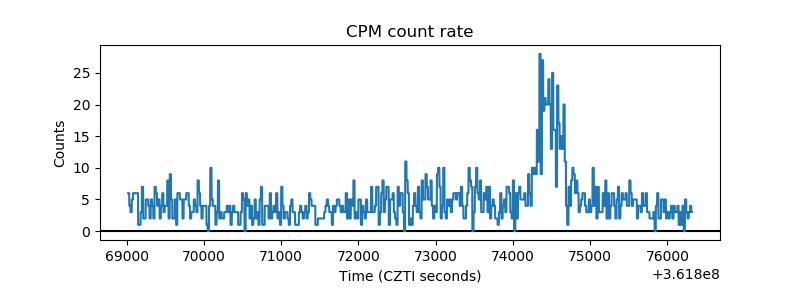 |
| CZT Counter | 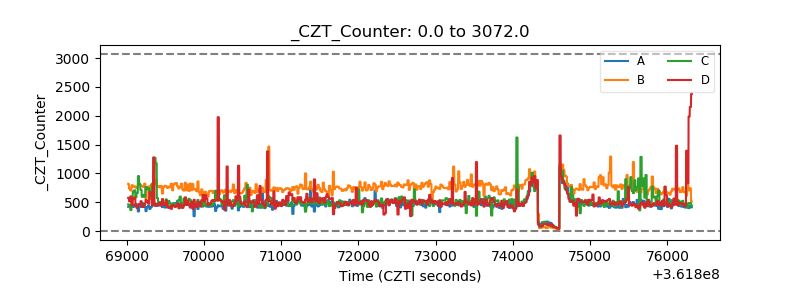 |
| +2.5 Volts monitor |  |
| +5 Volts monitor |  |
| _ROLL_ROT | 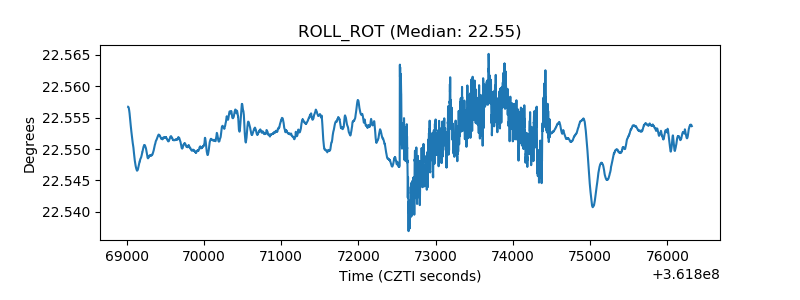 |
| _Roll_DEC | 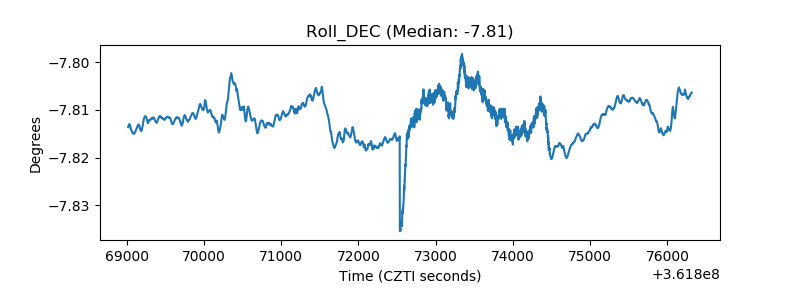 |
| _Roll_RA | 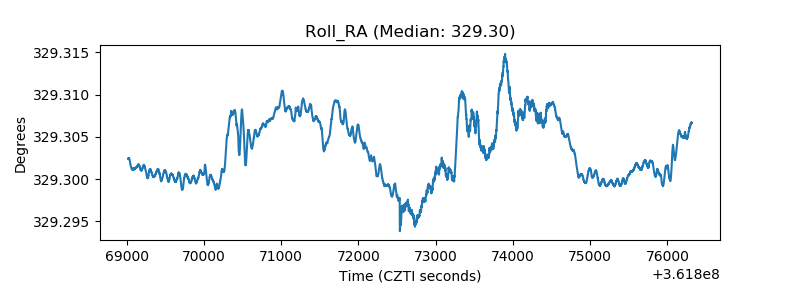 |
| Veto Counter | 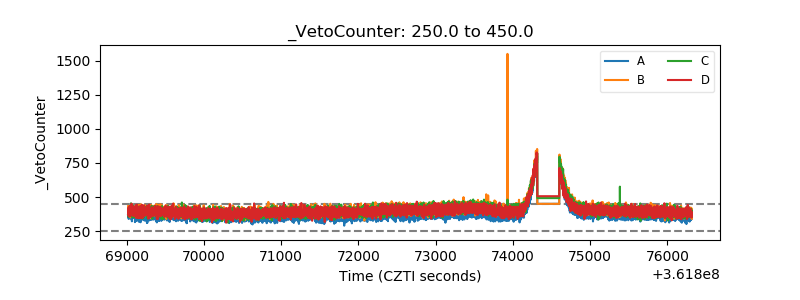 |