| Param | Original file | Final file |
|---|---|---|
| Filename | modeM0/AS1A10_058T11_9000004474_30971cztM0_level2.evt | modeM0/AS1A10_058T11_9000004474_30971cztM0_level2_quad_clean.evt |
| Size (bytes) | 293,270,400 | 33,099,840 |
| Size | 279.7 MB | 31.6 MB |
| Events in quadrant A | 1,776,533 | 192,241 |
| Events in quadrant B | 2,898,256 | 186,588 |
| Events in quadrant C | 1,916,617 | 178,866 |
| Events in quadrant D | 2,035,415 | 179,946 |
| Mode M9 | |||
|---|---|---|---|
| Quadrant | BADHDUFLAG | Total packets | Discarded packets |
| A | 0 | 5 | 0 |
| B | 0 | 6 | 0 |
| C | 0 | 6 | 0 |
| D | 0 | 6 | 0 |
| Mode M0 | |||
|---|---|---|---|
| Quadrant | BADHDUFLAG | Total packets | Discarded packets |
| A | 0 | 7636 | 1 |
| B | 0 | 11469 | 1 |
| C | 0 | 7920 | 1 |
| D | 0 | 8354 | 1 |
| Mode SS | |||
|---|---|---|---|
| Quadrant | BADHDUFLAG | Total packets | Discarded packets |
| A | 0 | 74 | 0 |
| B | 0 | 74 | 0 |
| C | 0 | 74 | 0 |
| D | 0 | 74 | 0 |
| Quadrant | Total seconds | Saturated seconds | Saturation percentage |
|---|---|---|---|
| A | 3737 | 31 | 0.829542% |
| B | 3737 | 70 | 1.873160% |
| C | 3737 | 65 | 1.739363% |
| D | 3737 | 27 | 0.722505% |
Noise dominated data is calculated using 1-second bins in cleaned event files. If a bin has >2000 counts, and if more than 50% of those come from <1% of pixels, then it is considered to be noise-dominated and hence unusable.
| Quadrant | # 1 sec bins | Bins with >0 counts | Bins with >2000 counts | High rate bins dominated by noise | Noise dominated (total time) | Noise dominated (detector-on time) | Marked lightcurve |
|---|---|---|---|---|---|---|---|
| A | 3737 | 3737 | 0 | 0 | 0.00% | 0.00% | 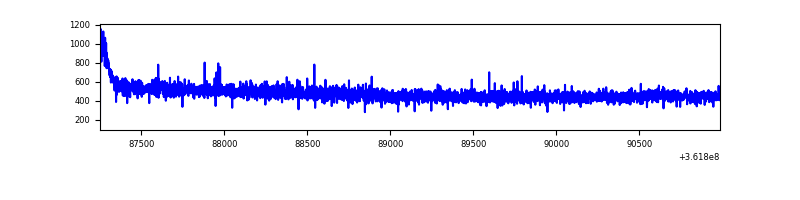 |
| B | 3737 | 3737 | 8 | 8 | 0.21% | 0.21% | 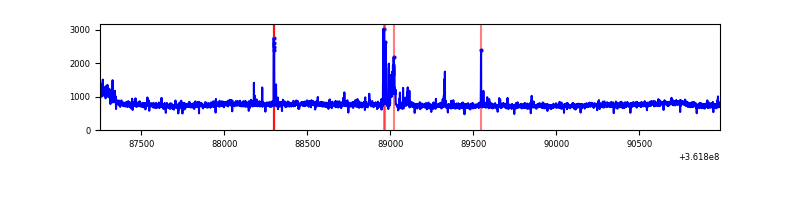 |
| C | 3737 | 3737 | 3 | 3 | 0.08% | 0.08% | 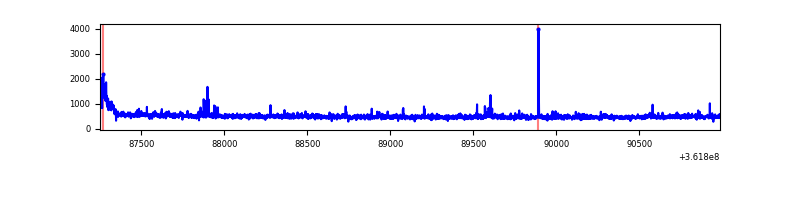 |
| D | 3737 | 3737 | 7 | 7 | 0.19% | 0.19% | 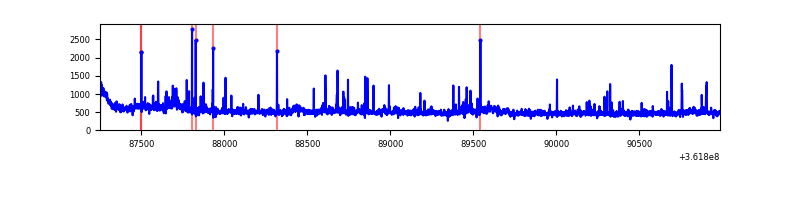 |
Top three noisy pixels from each quadrant. If the there are fewer than three noisy pixels in the level2.evt file, extra rows are filled as -1
| Pixel properties | Quadrant properties | ||||||
|---|---|---|---|---|---|---|---|
| Quadrant | DetID | PixID | Counts | Sigma | Mean | Median | Sigma |
| A | 13 | 254 | 5798 | 56.68 | 460 | 450 | 94.4 |
| A | 3 | 137 | 4581 | 43.78 | 460 | 450 | 94.4 |
| A | 0 | 226 | 3806 | 35.57 | 460 | 450 | 94.4 |
| B | 6 | 159 | 1012149 | 11378.53 | 451 | 440 | 88.9 |
| B | 15 | 32 | 30694 | 340.26 | 451 | 440 | 88.9 |
| B | 5 | 172 | 15850 | 173.31 | 451 | 440 | 88.9 |
| C | 0 | 10 | 123706 | 1185.78 | 436 | 440 | 104.0 |
| C | 14 | 238 | 71546 | 684.02 | 436 | 440 | 104.0 |
| C | 2 | 114 | 8661 | 79.08 | 436 | 440 | 104.0 |
| D | 8 | 195 | 240706 | 2213.21 | 446 | 434 | 108.6 |
| D | 2 | 250 | 70132 | 642.01 | 446 | 434 | 108.6 |
| D | 2 | 234 | 20807 | 187.66 | 446 | 434 | 108.6 |
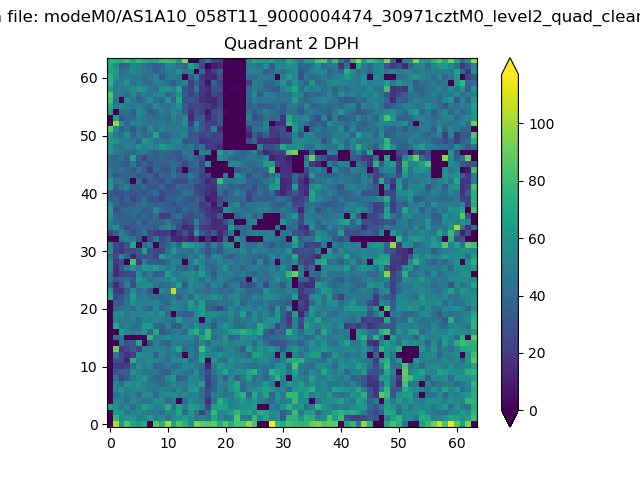
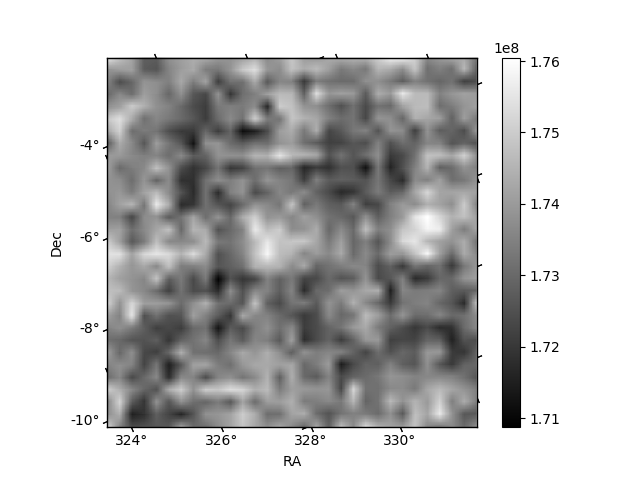
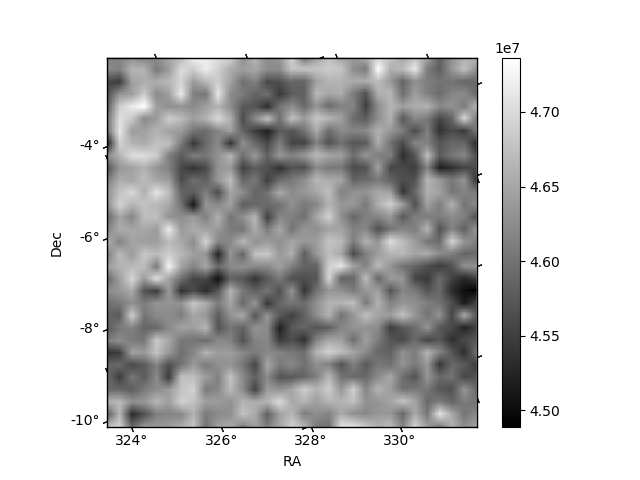
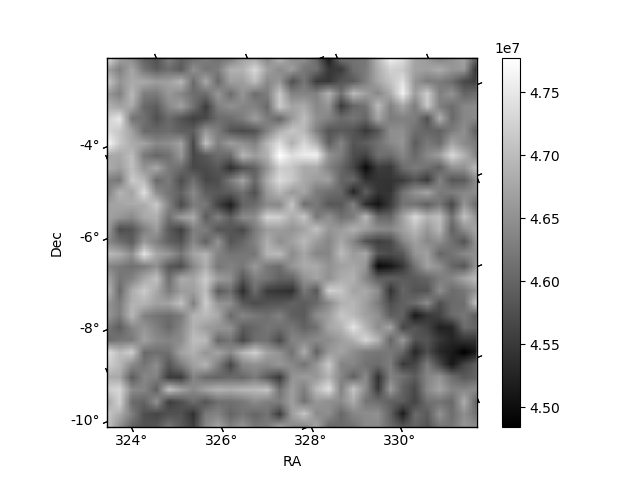
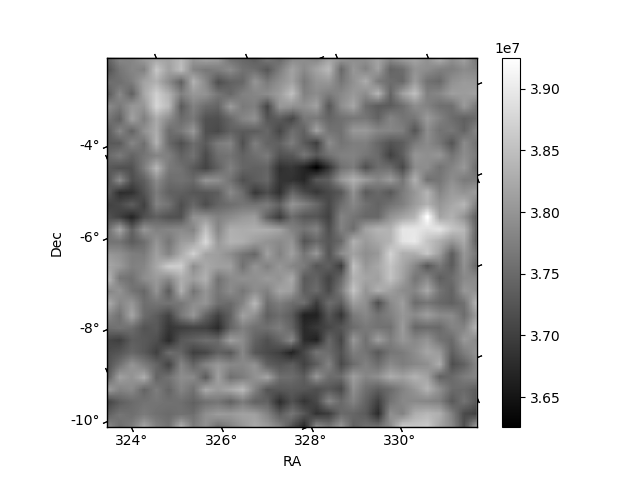
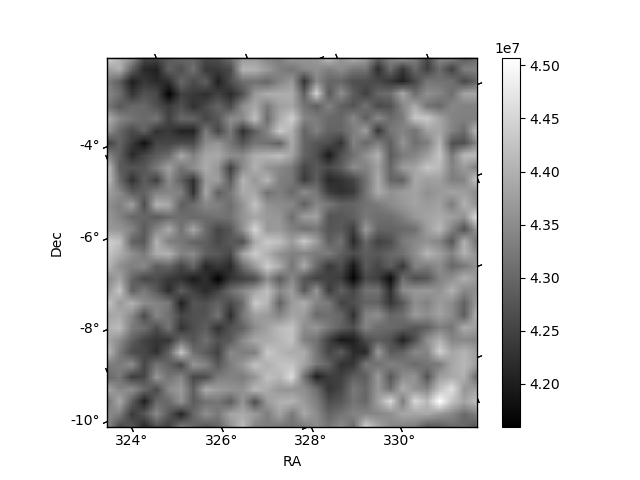
Histogram calculated using DETX and DETY for each event in the final _common_clean file
| Quadrant A | 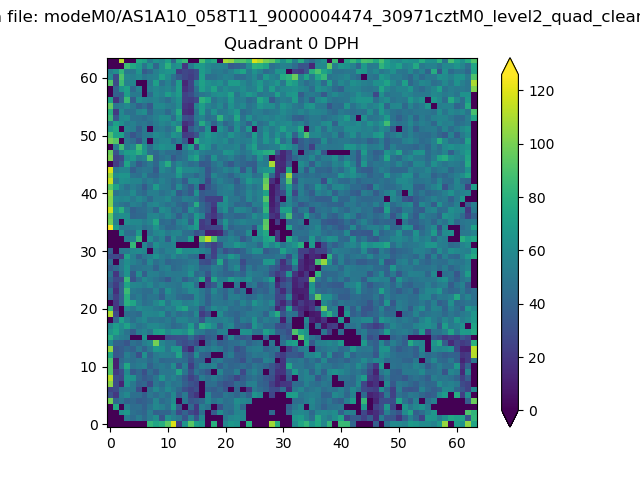 |
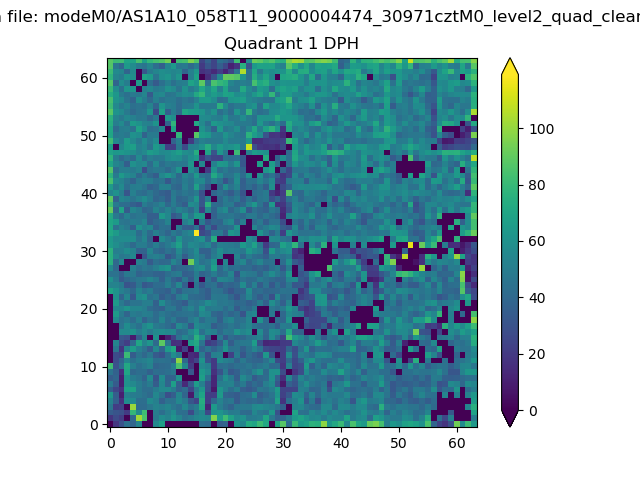 |
Quadrant B |
|---|---|---|---|
| Quadrant D | 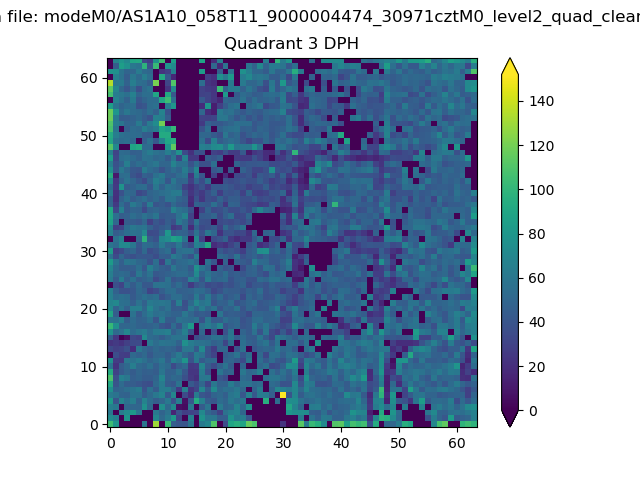 |
 |
Quadrant C |
| Plot type | Count rate plots | Images |
|---|---|---|
| Comparison with Poisson distribution Blue bars denote a histogram of data divided into 1 sec bins. Red curve is a Poisson curve with rate = median count rate of data. |
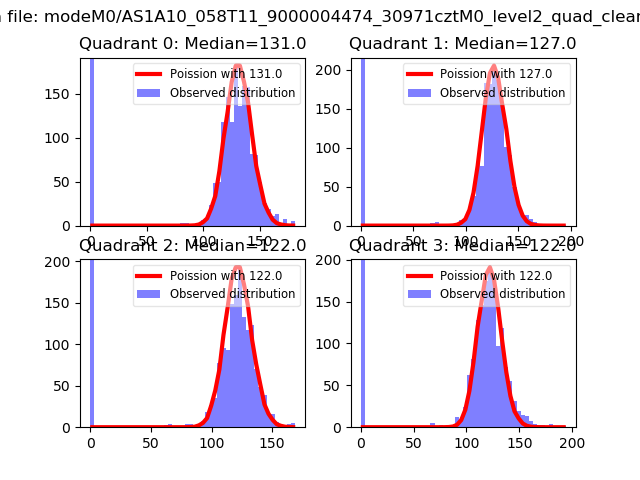 |
 |
| Quadrant-wise count rates Data is divided into 100 sec bins |
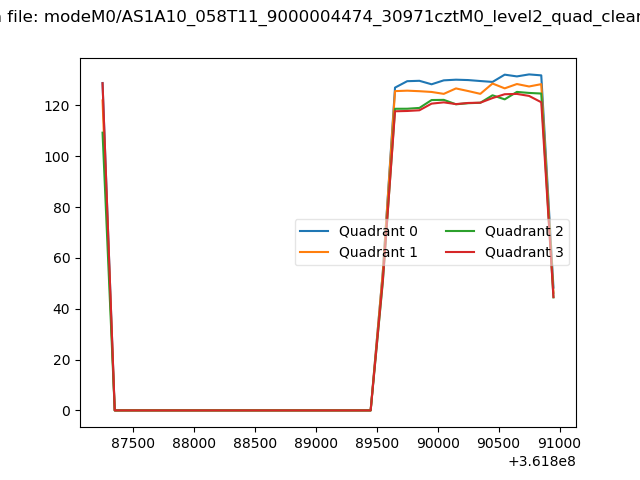 |
|
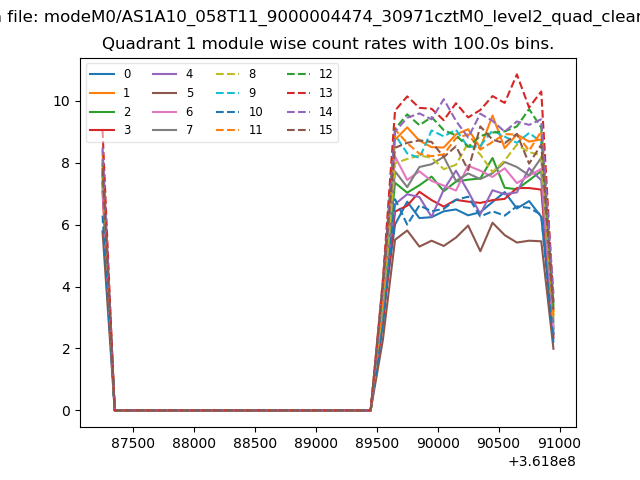
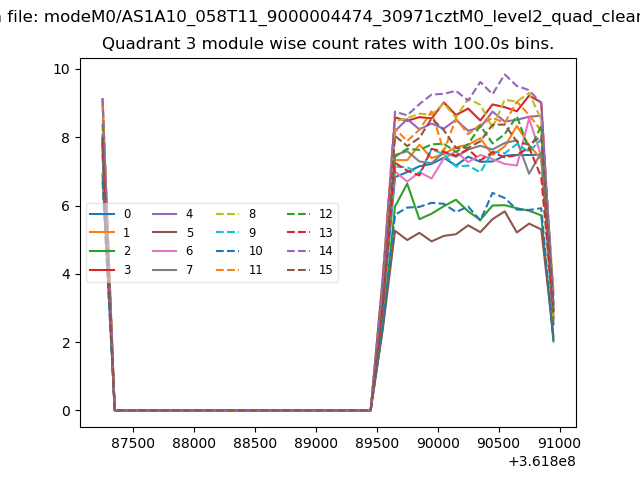
| Module-wise count rates for Quadrant A Data is divided into 100 sec bins |
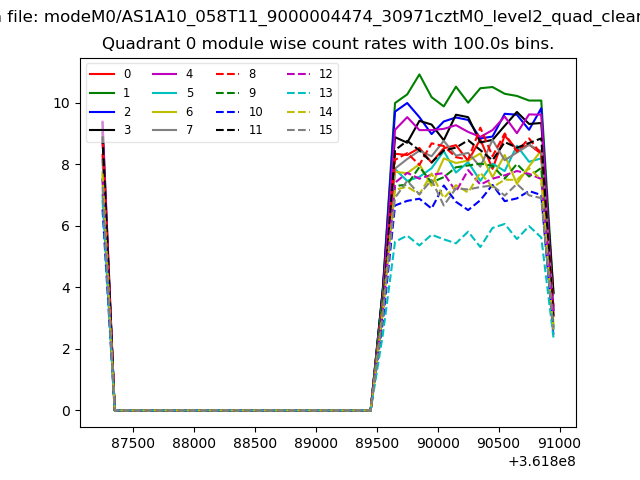 |
 |
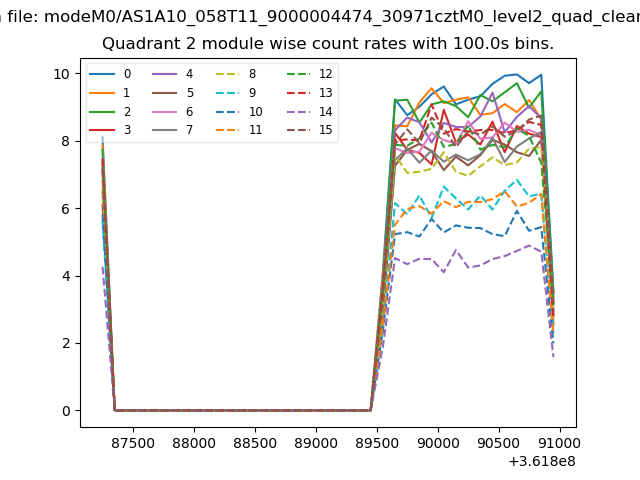
| Module-wise count rates for Quadrant B Data is divided into 100 sec bins |
 |
 |
| Module-wise count rates for Quadrant C Data is divided into 100 sec bins |
 |
 |
| Module-wise count rates for Quadrant D Data is divided into 100 sec bins |
 |
 |
| Parameter | Plot |
|---|---|
| CZT HV Monitor | 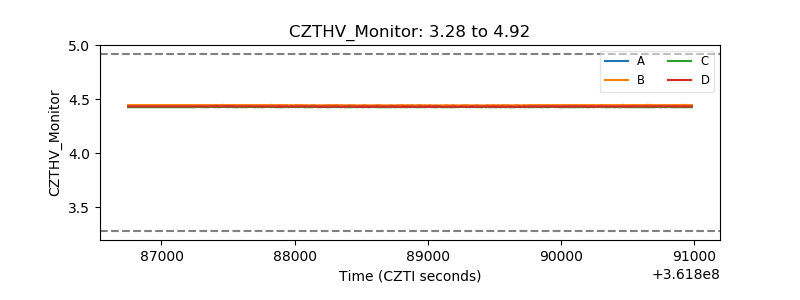 |
| D_VDD | 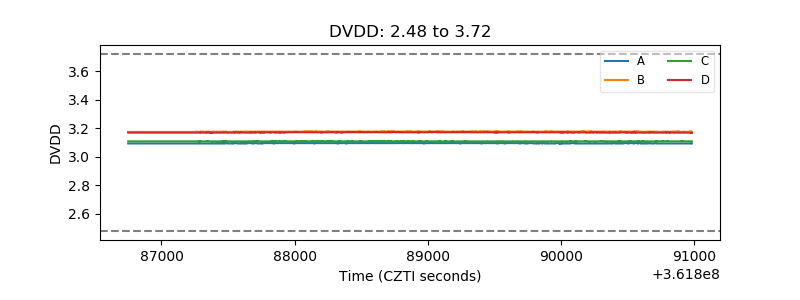 |
| Temperature 1 | 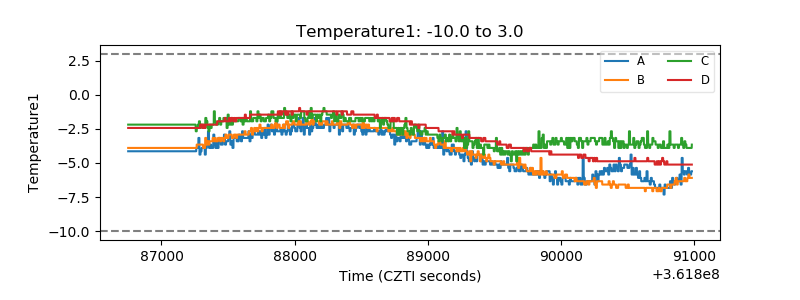 |
| Veto HV Monitor | 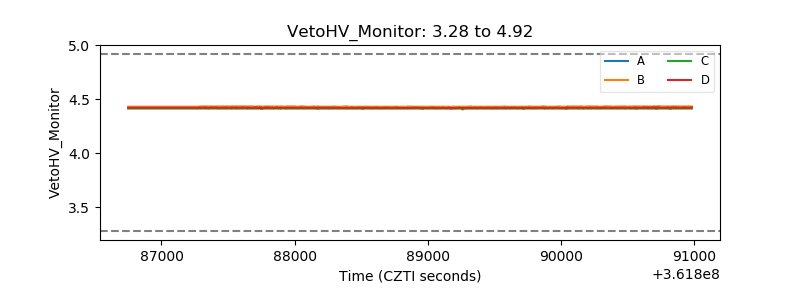 |
| Veto LLD | 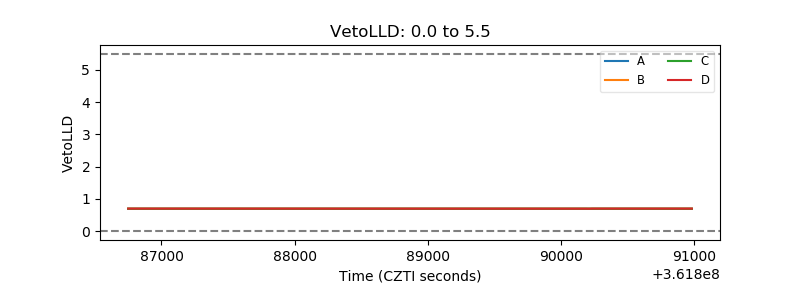 |
| Alpha Counter | 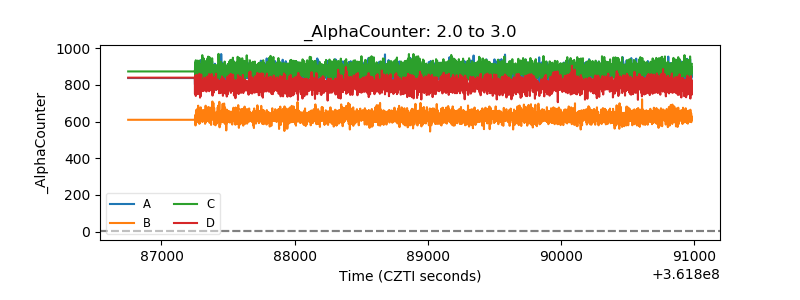 |
| _CPM_Rate | 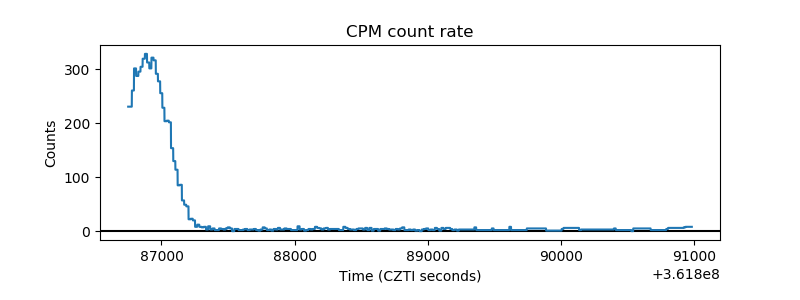 |
| CZT Counter | 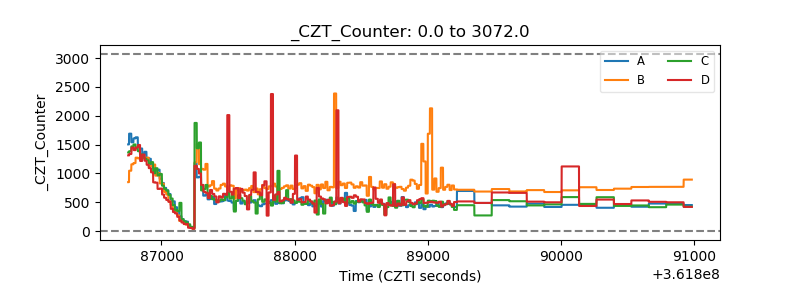 |
| +2.5 Volts monitor |  |
| +5 Volts monitor |  |
| _ROLL_ROT | 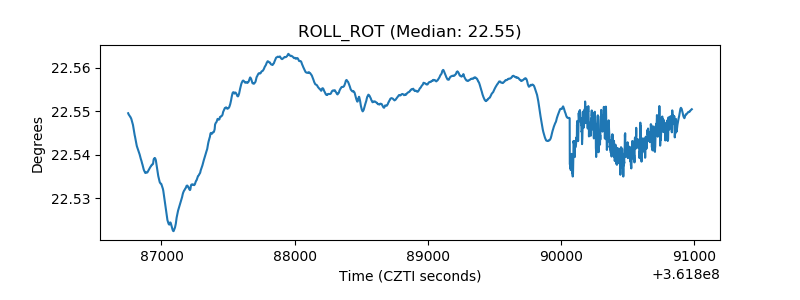 |
| _Roll_DEC | 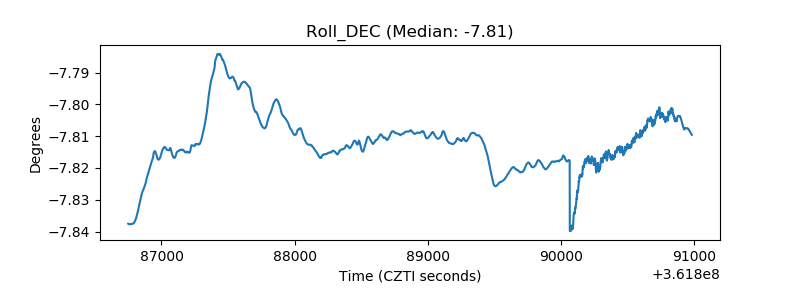 |
| _Roll_RA | 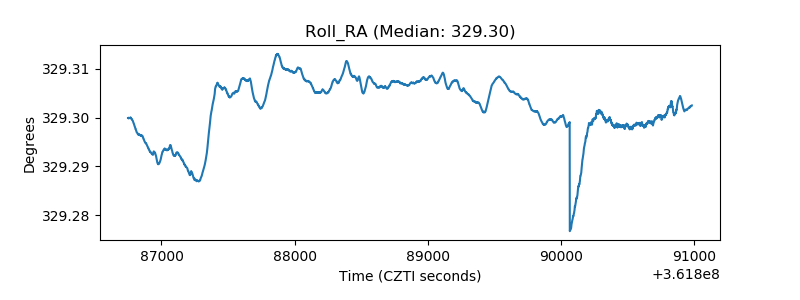 |
| Veto Counter | 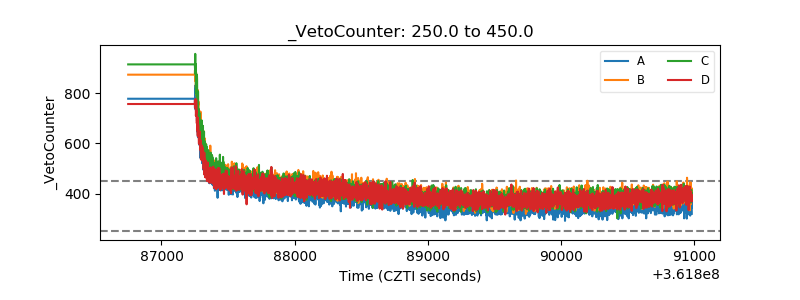 |