| Param | Original file | Final file |
|---|---|---|
| Filename | modeM0/AS1A10_071T42_9000004476cztM0_level2.fits | modeM0/AS1A10_071T42_9000004476cztM0_level2_quad_clean.evt |
| Size (bytes) | 781,099,200 | 521,153,280 |
| Size | 744.9 MB | 497.0 MB |
| Events in quadrant A | 4,909,582 | 2,750,891 |
| Events in quadrant B | 4,577,308 | 2,709,118 |
| Events in quadrant C | 4,662,970 | 2,573,466 |
| Events in quadrant D | 4,150,732 | 2,392,550 |
| Mode SS | |||
|---|---|---|---|
| Quadrant | BADHDUFLAG | Total packets | Discarded packets |
| A | 0 | 1592 | 0 |
| B | 0 | 1592 | 0 |
| C | 0 | 1592 | 0 |
| D | 0 | 1592 | 0 |
| Mode M0 | |||
|---|---|---|---|
| Quadrant | BADHDUFLAG | Total packets | Discarded packets |
| A | 0 | 162655 | 0 |
| B | 0 | 242117 | 0 |
| C | 0 | 180018 | 0 |
| D | 0 | 178724 | 0 |
| Mode M9 | |||
|---|---|---|---|
| Quadrant | BADHDUFLAG | Total packets | Discarded packets |
| A | 0 | 128 | 0 |
| B | 0 | 128 | 0 |
| C | 0 | 128 | 0 |
| D | 0 | 128 | 0 |
| Quadrant | Total seconds | Saturated seconds | Saturation percentage |
|---|---|---|---|
| A | 78083 | 1128 | 1.444617% |
| B | 78083 | 2488 | 3.186353% |
| C | 78083 | 2602 | 3.332351% |
| D | 78083 | 1391 | 1.781438% |
Noise dominated data is calculated using 1-second bins in cleaned event files. If a bin has >2000 counts, and if more than 50% of those come from <1% of pixels, then it is considered to be noise-dominated and hence unusable.
| Quadrant | # 1 sec bins | Bins with >0 counts | Bins with >2000 counts | High rate bins dominated by noise | Noise dominated (total time) | Noise dominated (detector-on time) | Marked lightcurve |
|---|---|---|---|---|---|---|---|
| A | 91009 | 78073 | 0 | 0 | 0.00% | 0.00% |  |
| B | 91009 | 78057 | 0 | 0 | 0.00% | 0.00% | 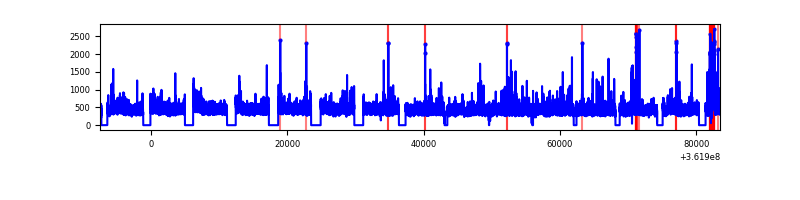 |
| C | 91009 | 78074 | 0 | 0 | 0.00% | 0.00% | 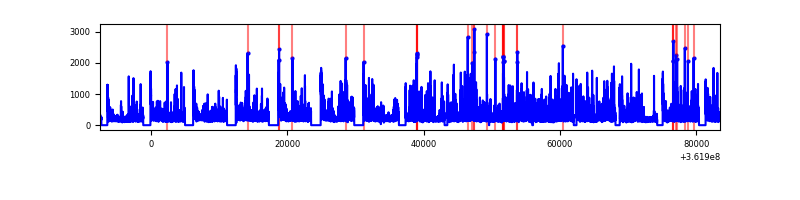 |
| D | 91009 | 78065 | 0 | 0 | 0.00% | 0.00% |  |
Top three noisy pixels from each quadrant. If the there are fewer than three noisy pixels in the level2.evt file, extra rows are filled as -1
| Pixel properties | Quadrant properties | ||||||
|---|---|---|---|---|---|---|---|
| Quadrant | DetID | PixID | Counts | Sigma | Mean | Median | Sigma |
| A | 0 | 29 | 4887 | 11.87 | 1277 | 1197 | 310.8 |
| A | 7 | 110 | 3788 | 8.34 | 1277 | 1197 | 310.8 |
| A | 0 | 30 | 3715 | 8.1 | 1277 | 1197 | 310.8 |
| B | 2 | 9 | 3600 | 10.27 | 1211 | 1158 | 237.8 |
| B | 5 | 232 | 3096 | 8.15 | 1211 | 1158 | 237.8 |
| B | 3 | 80 | 3077 | 8.07 | 1211 | 1158 | 237.8 |
| C | 1 | 81 | 3680 | 8.12 | 1232 | 1156 | 310.8 |
| C | 1 | 80 | 3629 | 7.96 | 1232 | 1156 | 310.8 |
| C | 12 | 241 | 3300 | 6.9 | 1232 | 1156 | 310.8 |
| D | 6 | 67 | 2947 | 5.91 | 1186 | 1079 | 315.9 |
| D | 7 | 3 | 2940 | 5.89 | 1186 | 1079 | 315.9 |
| D | 15 | 47 | 2900 | 5.76 | 1186 | 1079 | 315.9 |
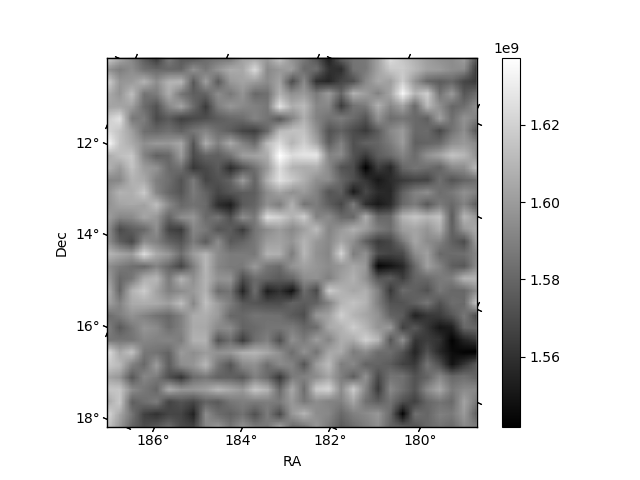
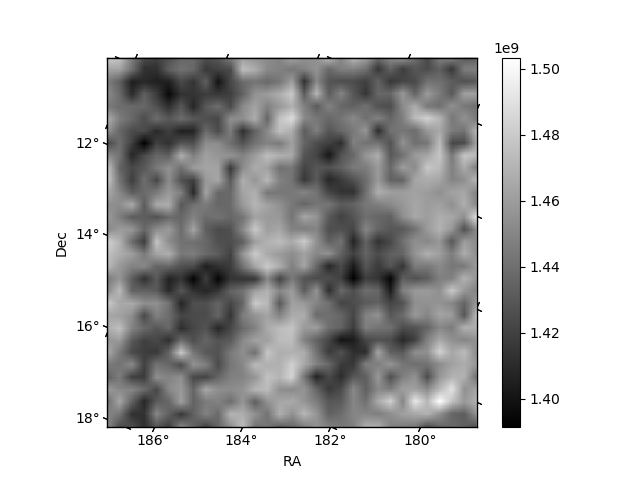
Histogram calculated using DETX and DETY for each event in the final _common_clean file
| Quadrant A | 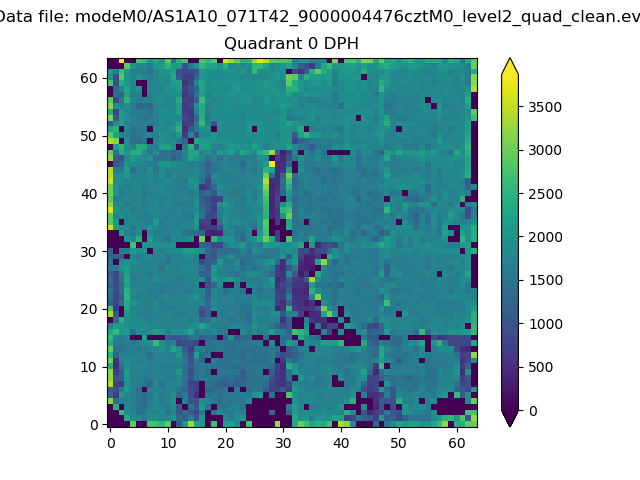 |
 |
Quadrant B |
|---|---|---|---|
| Quadrant D | 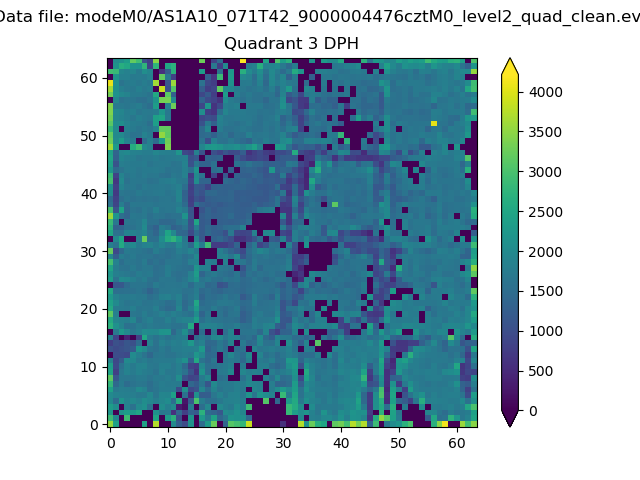 |
 |
Quadrant C |
| Plot type | Count rate plots | Images |
|---|---|---|
| Comparison with Poisson distribution Blue bars denote a histogram of data divided into 1 sec bins. Red curve is a Poisson curve with rate = median count rate of data. |
 |
 |
| Quadrant-wise count rates Data is divided into 100 sec bins |
 |
|
| Module-wise count rates for Quadrant A Data is divided into 100 sec bins |
 |
 |
| Module-wise count rates for Quadrant B Data is divided into 100 sec bins |
 |
 |
| Module-wise count rates for Quadrant C Data is divided into 100 sec bins |
 |
 |
| Module-wise count rates for Quadrant D Data is divided into 100 sec bins |
 |
 |
| Parameter | Plot |
|---|---|
| CZT HV Monitor |  |
| D_VDD | 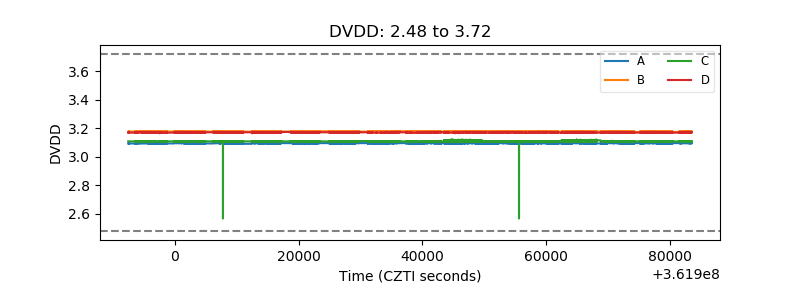 |
| Temperature 1 | 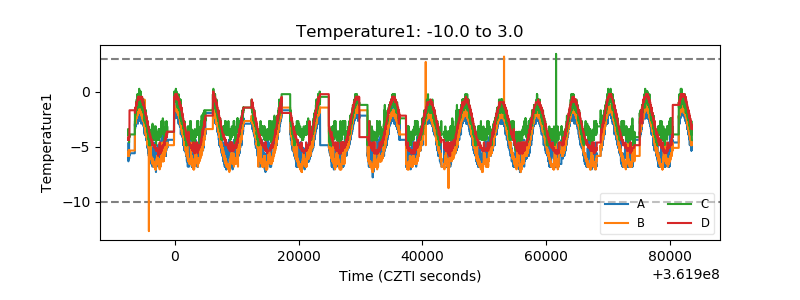 |
| Veto HV Monitor |  |
| Veto LLD | 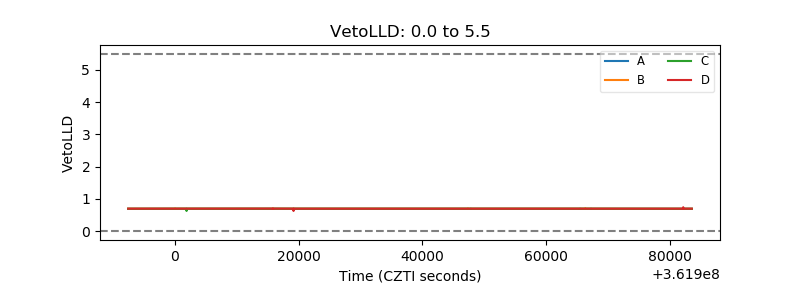 |
| Alpha Counter |  |
| _CPM_Rate |  |
| CZT Counter | 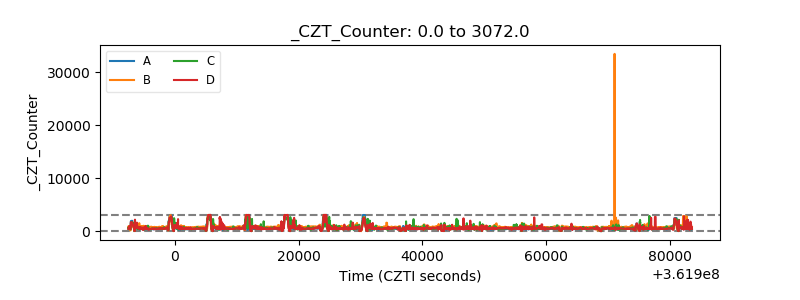 |
| +2.5 Volts monitor |  |
| +5 Volts monitor |  |
| _ROLL_ROT | 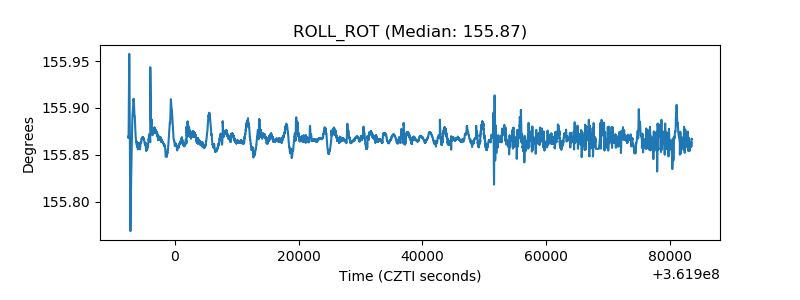 |
| _Roll_DEC |  |
| _Roll_RA |  |
| Veto Counter |  |