| Param | Original file | Final file |
|---|---|---|
| Filename | modeM0/AS1A10_071T42_9000004476_30974cztM0_level2.evt | modeM0/AS1A10_071T42_9000004476_30974cztM0_level2_quad_clean.evt |
| Size (bytes) | 518,123,520 | 89,809,920 |
| Size | 494.1 MB | 85.6 MB |
| Events in quadrant A | 3,055,466 | 592,313 |
| Events in quadrant B | 5,126,688 | 590,714 |
| Events in quadrant C | 3,427,474 | 560,408 |
| Events in quadrant D | 3,663,366 | 545,379 |
| Mode SS | |||
|---|---|---|---|
| Quadrant | BADHDUFLAG | Total packets | Discarded packets |
| A | 0 | 126 | 0 |
| B | 0 | 126 | 0 |
| C | 0 | 126 | 0 |
| D | 0 | 126 | 0 |
| Mode M0 | |||
|---|---|---|---|
| Quadrant | BADHDUFLAG | Total packets | Discarded packets |
| A | 0 | 13049 | 1 |
| B | 0 | 19435 | 1 |
| C | 0 | 14027 | 1 |
| D | 0 | 14938 | 4 |
| Mode M9 | |||
|---|---|---|---|
| Quadrant | BADHDUFLAG | Total packets | Discarded packets |
| A | 0 | 12 | 0 |
| B | 0 | 12 | 0 |
| C | 0 | 12 | 0 |
| D | 0 | 12 | 0 |
| Quadrant | Total seconds | Saturated seconds | Saturation percentage |
|---|---|---|---|
| A | 6171 | 34 | 0.550964% |
| B | 6172 | 97 | 1.571614% |
| C | 6172 | 161 | 2.608555% |
| D | 6171 | 144 | 2.333495% |
Noise dominated data is calculated using 1-second bins in cleaned event files. If a bin has >2000 counts, and if more than 50% of those come from <1% of pixels, then it is considered to be noise-dominated and hence unusable.
| Quadrant | # 1 sec bins | Bins with >0 counts | Bins with >2000 counts | High rate bins dominated by noise | Noise dominated (total time) | Noise dominated (detector-on time) | Marked lightcurve |
|---|---|---|---|---|---|---|---|
| A | 7371 | 6171 | 0 | 0 | 0.00% | 0.00% | 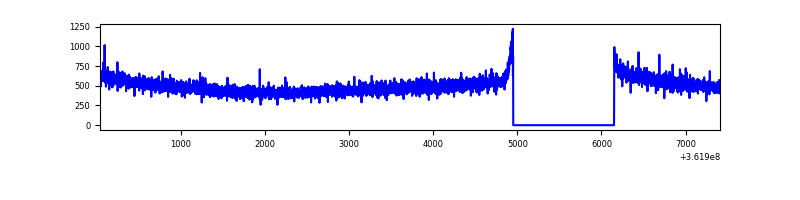 |
| B | 7372 | 6172 | 4 | 4 | 0.05% | 0.06% | 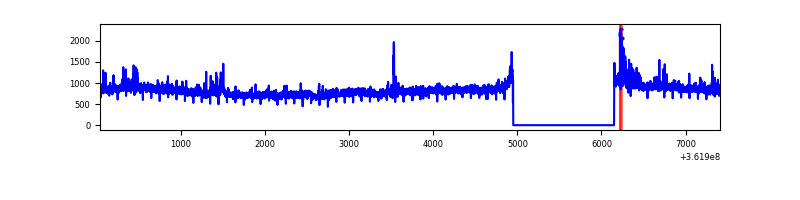 |
| C | 7372 | 6172 | 61 | 61 | 0.83% | 0.99% | 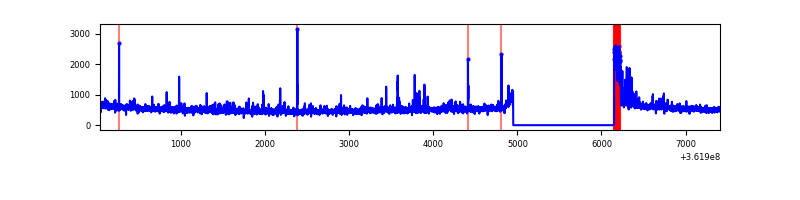 |
| D | 7370 | 6171 | 104 | 104 | 1.41% | 1.69% | 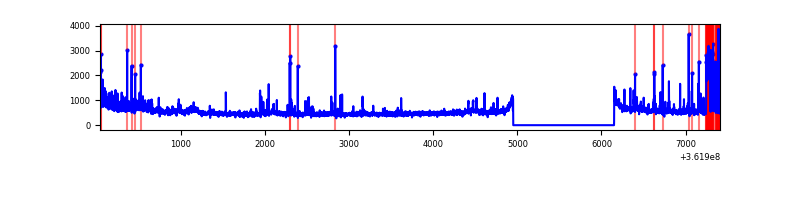 |
Top three noisy pixels from each quadrant. If the there are fewer than three noisy pixels in the level2.evt file, extra rows are filled as -1
| Pixel properties | Quadrant properties | ||||||
|---|---|---|---|---|---|---|---|
| Quadrant | DetID | PixID | Counts | Sigma | Mean | Median | Sigma |
| A | 13 | 254 | 10910 | 64.08 | 792 | 777 | 158.1 |
| A | 3 | 137 | 7618 | 43.26 | 792 | 777 | 158.1 |
| A | 0 | 226 | 6794 | 38.05 | 792 | 777 | 158.1 |
| B | 6 | 159 | 1828874 | 12302.52 | 785 | 766 | 148.6 |
| B | 0 | 155 | 94981 | 634.03 | 785 | 766 | 148.6 |
| B | 0 | 190 | 43599 | 288.25 | 785 | 766 | 148.6 |
| C | 0 | 10 | 301971 | 1701.21 | 754 | 758 | 177.1 |
| C | 14 | 238 | 122041 | 684.99 | 754 | 758 | 177.1 |
| C | 3 | 233 | 25330 | 138.78 | 754 | 758 | 177.1 |
| D | 8 | 195 | 349675 | 1925.44 | 762 | 742 | 181.2 |
| D | 13 | 249 | 275886 | 1518.27 | 762 | 742 | 181.2 |
| D | 2 | 250 | 63329 | 345.36 | 762 | 742 | 181.2 |
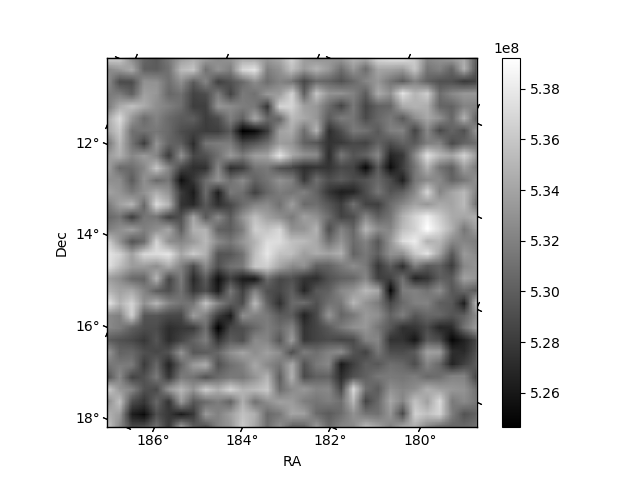
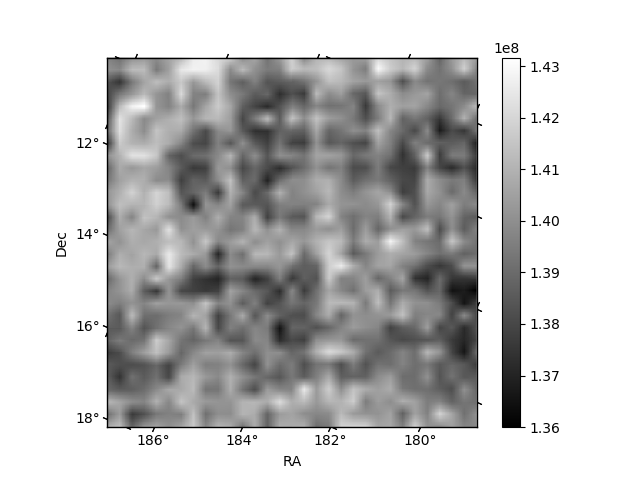
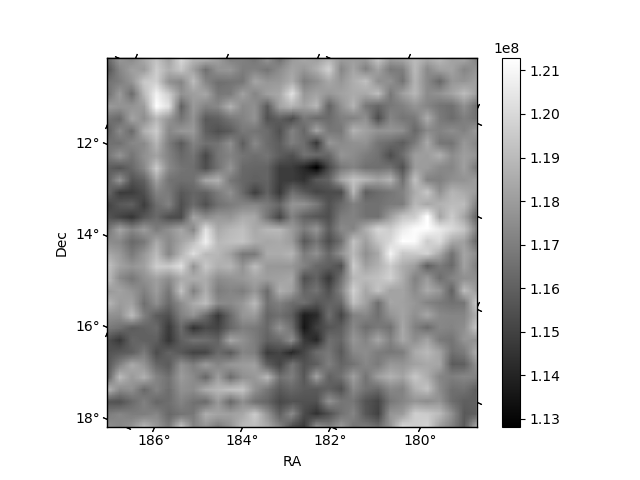
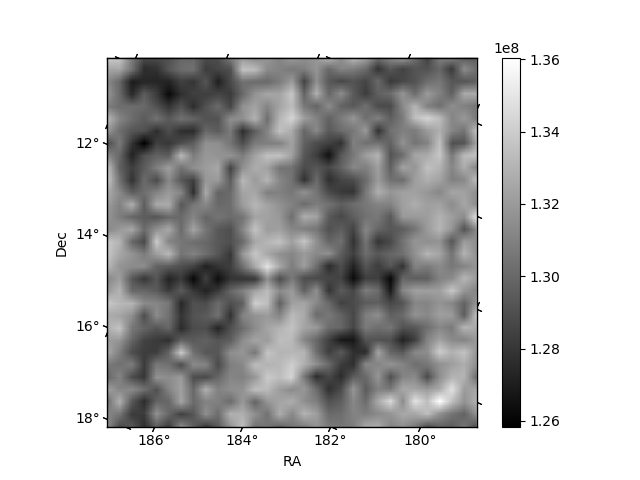
Histogram calculated using DETX and DETY for each event in the final _common_clean file
| Quadrant A | 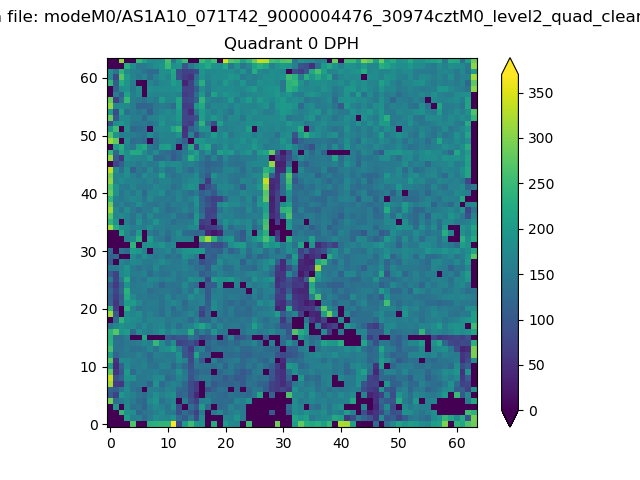 |
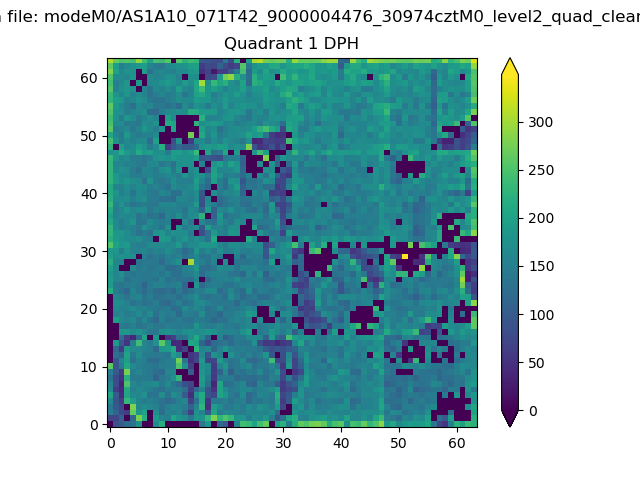 |
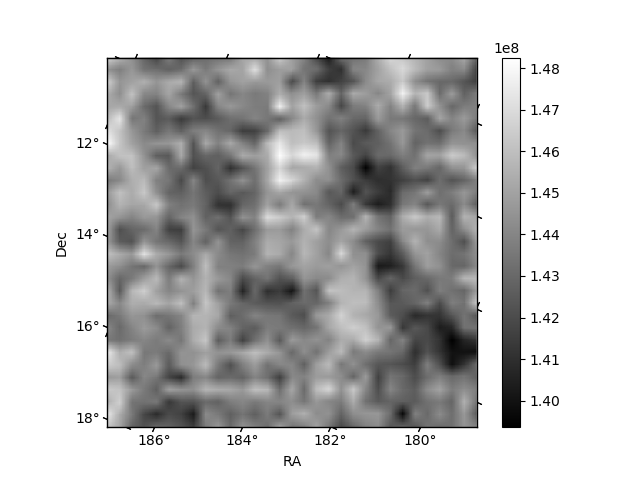
Quadrant B |
|---|---|---|---|
| Quadrant D | 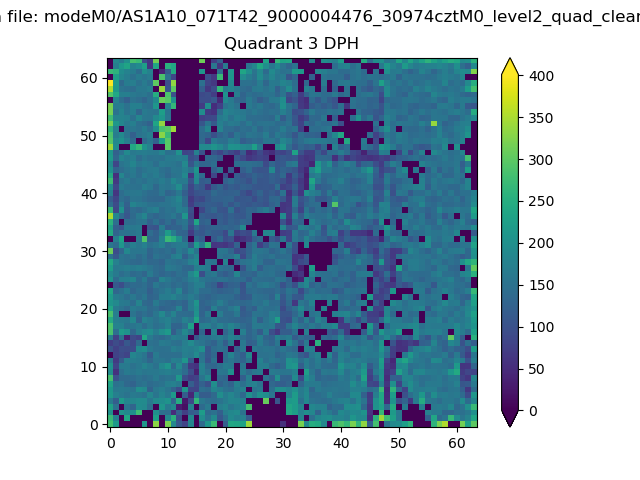 |
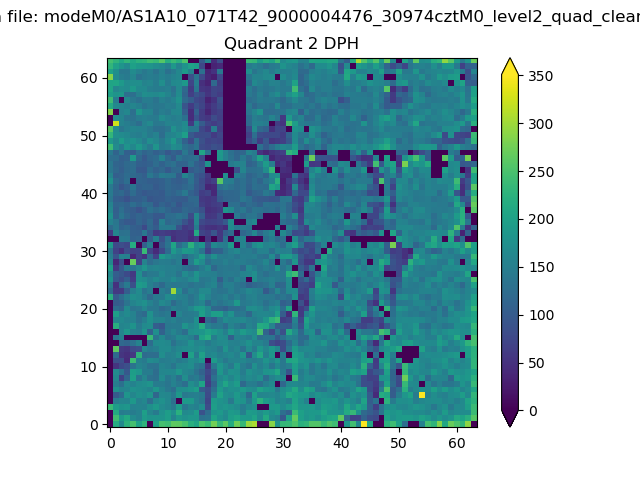 |
Quadrant C |
| Plot type | Count rate plots | Images |
|---|---|---|
| Comparison with Poisson distribution Blue bars denote a histogram of data divided into 1 sec bins. Red curve is a Poisson curve with rate = median count rate of data. |
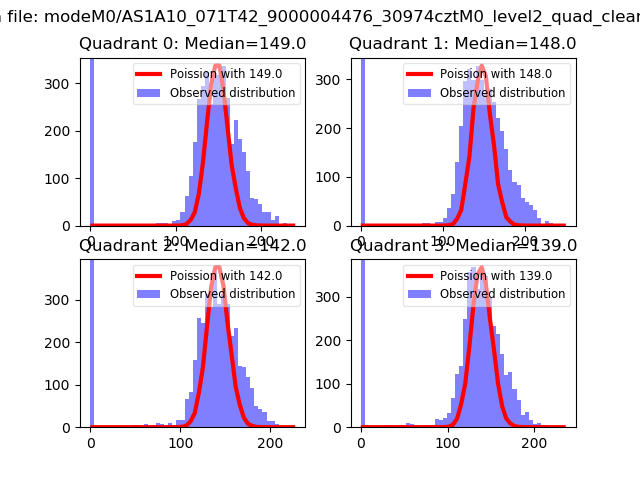 |
 |
| Quadrant-wise count rates Data is divided into 100 sec bins |
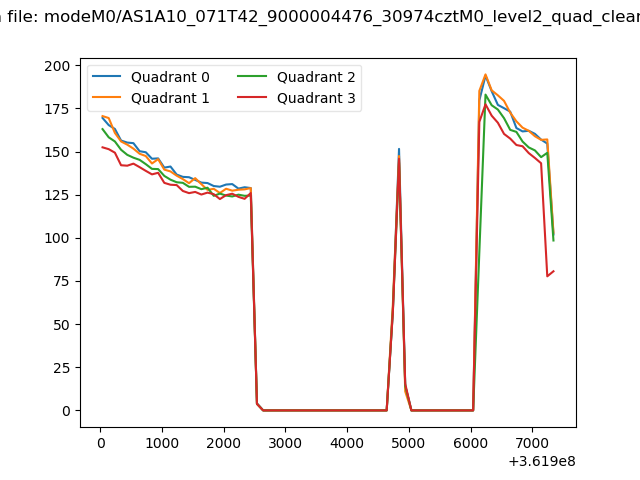 |
|
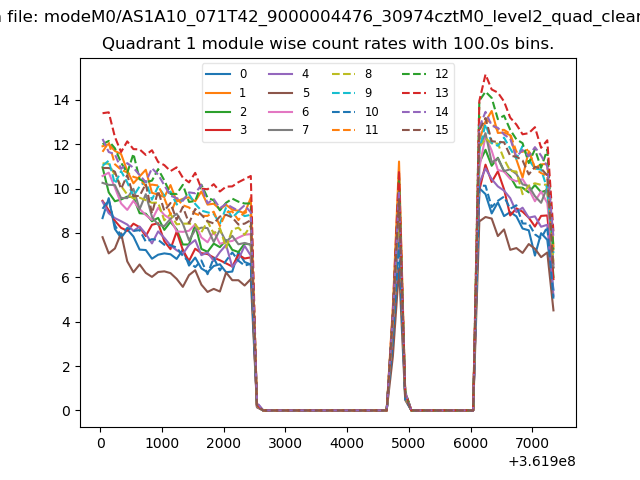
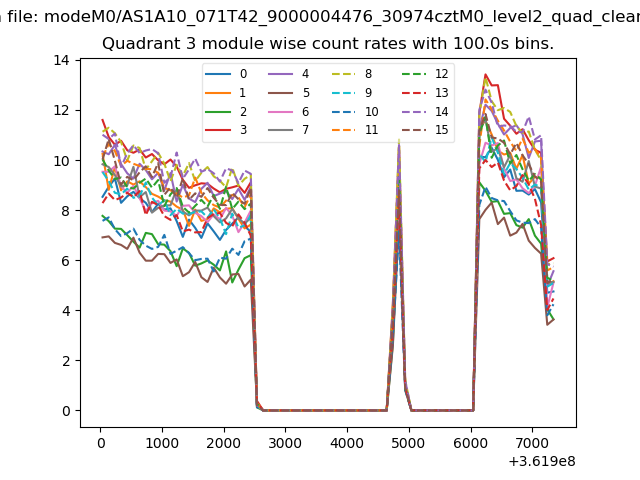
| Module-wise count rates for Quadrant A Data is divided into 100 sec bins |
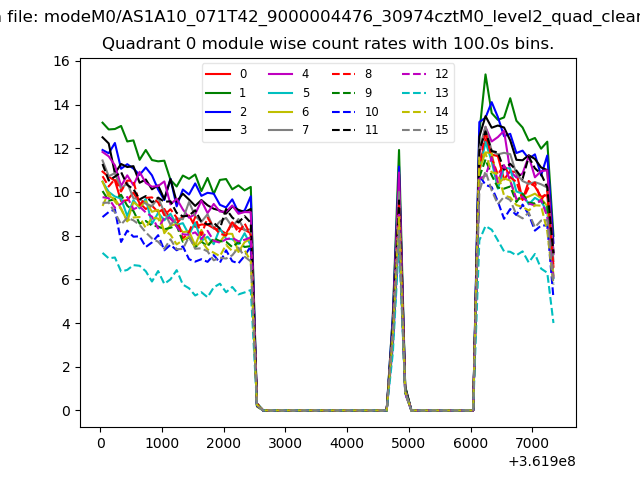 |
 |
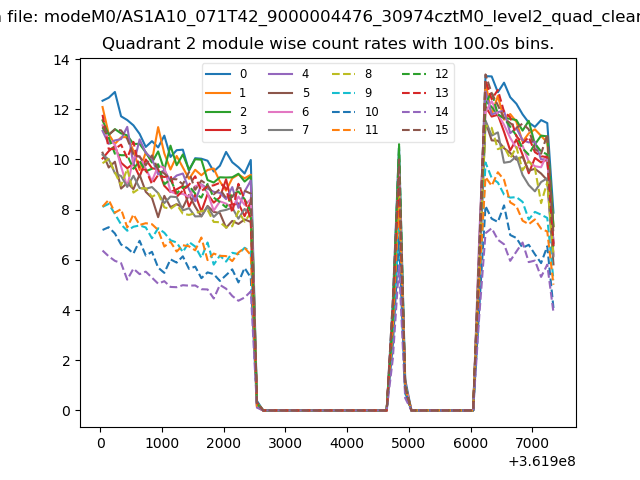
| Module-wise count rates for Quadrant B Data is divided into 100 sec bins |
 |
 |
| Module-wise count rates for Quadrant C Data is divided into 100 sec bins |
 |
 |
| Module-wise count rates for Quadrant D Data is divided into 100 sec bins |
 |
 |
| Parameter | Plot |
|---|---|
| CZT HV Monitor |  |
| D_VDD | 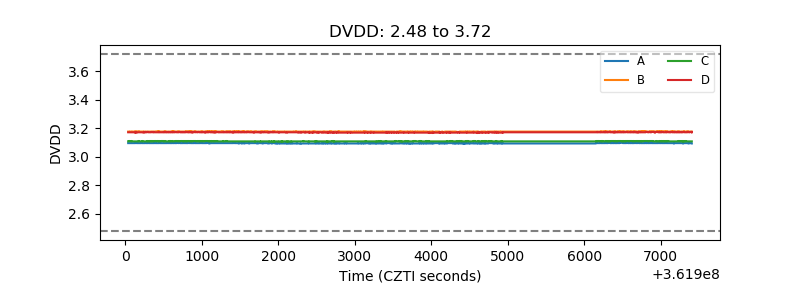 |
| Temperature 1 | 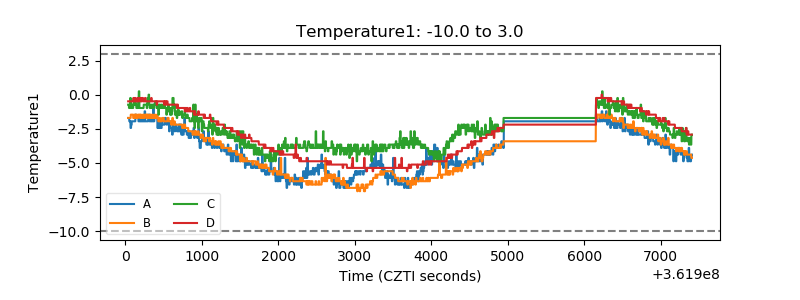 |
| Veto HV Monitor | 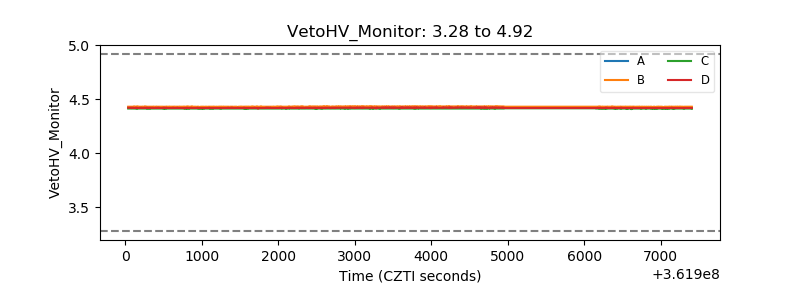 |
| Veto LLD |  |
| Alpha Counter | 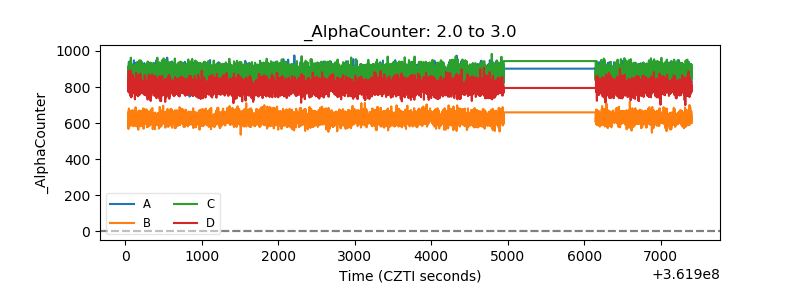 |
| _CPM_Rate | 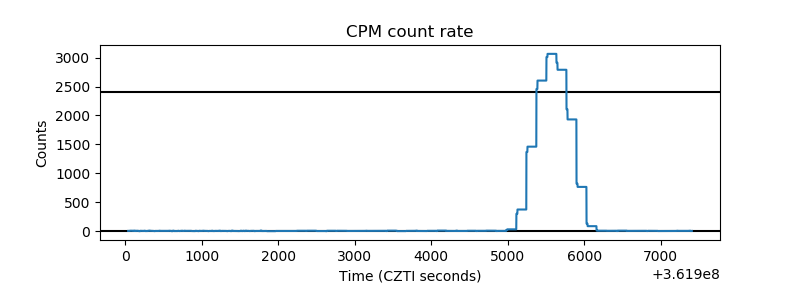 |
| CZT Counter | 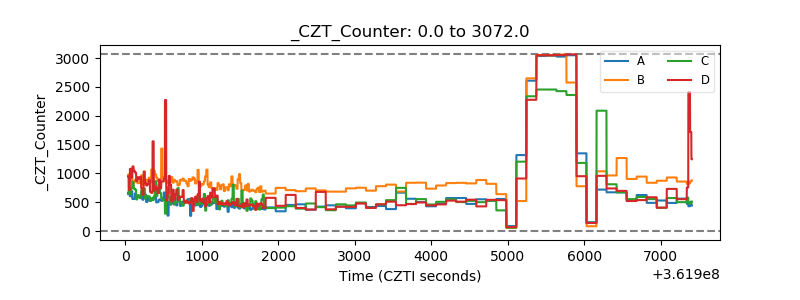 |
| +2.5 Volts monitor |  |
| +5 Volts monitor | 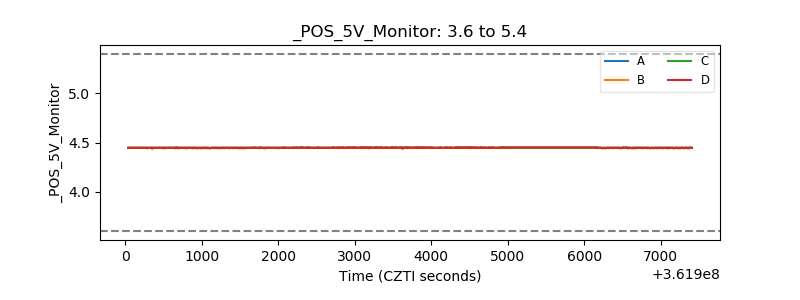 |
| _ROLL_ROT | 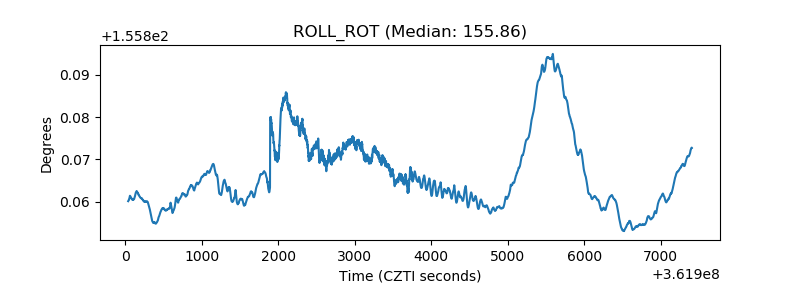 |
| _Roll_DEC | 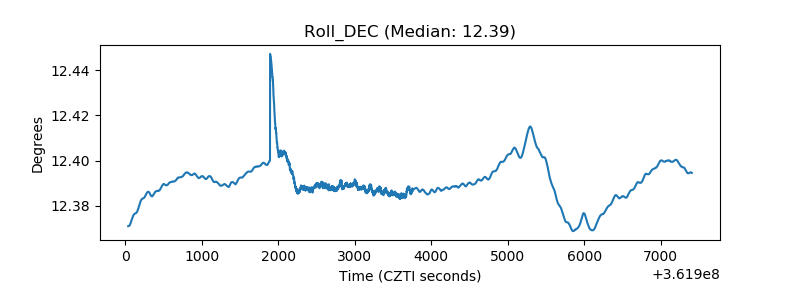 |
| _Roll_RA | 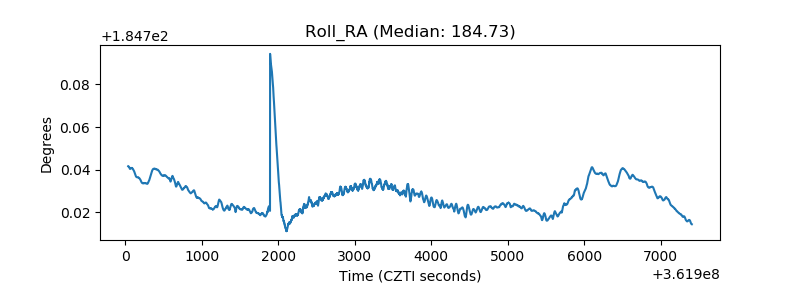 |
| Veto Counter | 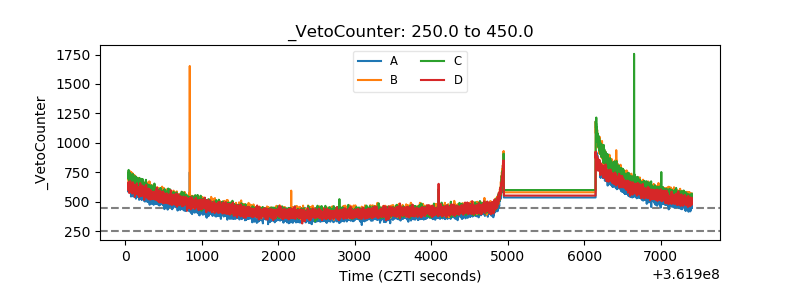 |