| Param | Original file | Final file |
|---|---|---|
| Filename | modeM0/AS1A10_071T42_9000004476_30975cztM0_level2.evt | modeM0/AS1A10_071T42_9000004476_30975cztM0_level2_quad_clean.evt |
| Size (bytes) | 538,493,760 | 95,800,320 |
| Size | 513.5 MB | 91.4 MB |
| Events in quadrant A | 3,205,571 | 640,804 |
| Events in quadrant B | 5,222,619 | 649,400 |
| Events in quadrant C | 3,709,743 | 596,626 |
| Events in quadrant D | 3,752,159 | 583,133 |
| Mode SS | |||
|---|---|---|---|
| Quadrant | BADHDUFLAG | Total packets | Discarded packets |
| A | 0 | 124 | 0 |
| B | 0 | 124 | 0 |
| C | 0 | 124 | 0 |
| D | 0 | 124 | 0 |
| Mode M0 | |||
|---|---|---|---|
| Quadrant | BADHDUFLAG | Total packets | Discarded packets |
| A | 0 | 13393 | 2 |
| B | 0 | 19486 | 3 |
| C | 0 | 14863 | 2 |
| D | 0 | 15228 | 2 |
| Mode M9 | |||
|---|---|---|---|
| Quadrant | BADHDUFLAG | Total packets | Discarded packets |
| A | 0 | 14 | 0 |
| B | 0 | 15 | 0 |
| C | 0 | 15 | 0 |
| D | 0 | 15 | 0 |
| Quadrant | Total seconds | Saturated seconds | Saturation percentage |
|---|---|---|---|
| A | 6182 | 62 | 1.002912% |
| B | 6181 | 135 | 2.184113% |
| C | 6181 | 264 | 4.271154% |
| D | 6181 | 185 | 2.993043% |
Noise dominated data is calculated using 1-second bins in cleaned event files. If a bin has >2000 counts, and if more than 50% of those come from <1% of pixels, then it is considered to be noise-dominated and hence unusable.
| Quadrant | # 1 sec bins | Bins with >0 counts | Bins with >2000 counts | High rate bins dominated by noise | Noise dominated (total time) | Noise dominated (detector-on time) | Marked lightcurve |
|---|---|---|---|---|---|---|---|
| A | 7467 | 6182 | 0 | 0 | 0.00% | 0.00% | 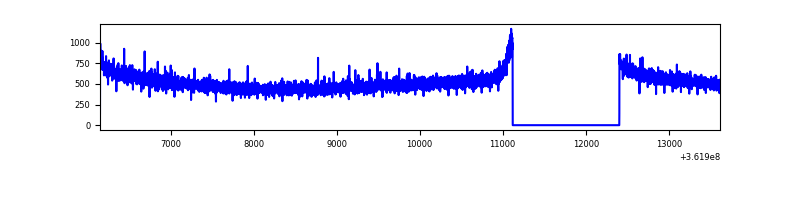 |
| B | 7466 | 6181 | 4 | 4 | 0.05% | 0.06% | 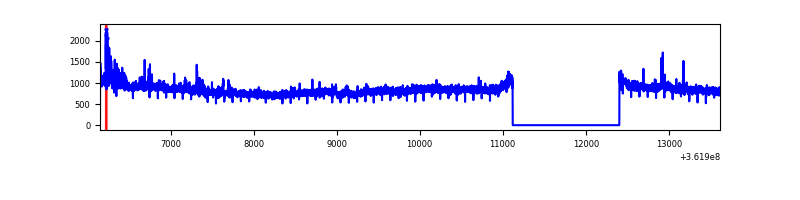 |
| C | 7466 | 6181 | 122 | 122 | 1.63% | 1.97% | 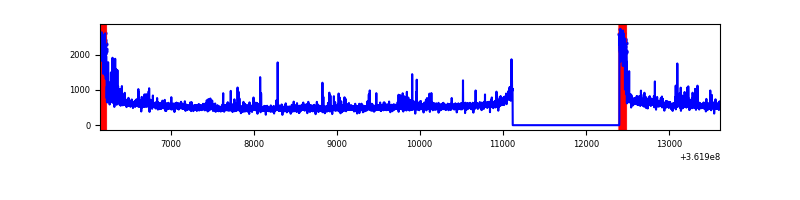 |
| D | 7466 | 6181 | 119 | 119 | 1.59% | 1.93% | 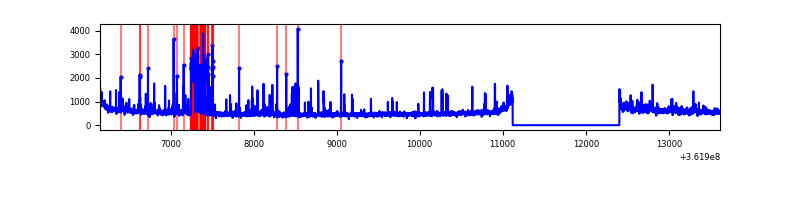 |
Top three noisy pixels from each quadrant. If the there are fewer than three noisy pixels in the level2.evt file, extra rows are filled as -1
| Pixel properties | Quadrant properties | ||||||
|---|---|---|---|---|---|---|---|
| Quadrant | DetID | PixID | Counts | Sigma | Mean | Median | Sigma |
| A | 13 | 254 | 11169 | 62.86 | 831 | 818 | 164.7 |
| A | 3 | 137 | 7870 | 42.83 | 831 | 818 | 164.7 |
| A | 0 | 226 | 6961 | 37.31 | 831 | 818 | 164.7 |
| B | 6 | 159 | 1838169 | 11860.85 | 827 | 807 | 154.9 |
| B | 0 | 155 | 70907 | 452.52 | 827 | 807 | 154.9 |
| B | 12 | 111 | 18334 | 113.14 | 827 | 807 | 154.9 |
| C | 0 | 10 | 467927 | 2568.96 | 780 | 790 | 181.8 |
| C | 14 | 238 | 130650 | 714.15 | 780 | 790 | 181.8 |
| C | 3 | 233 | 32993 | 177.1 | 780 | 790 | 181.8 |
| D | 13 | 249 | 338003 | 1817.95 | 789 | 773 | 185.5 |
| D | 8 | 195 | 269649 | 1449.47 | 789 | 773 | 185.5 |
| D | 2 | 250 | 77374 | 412.94 | 789 | 773 | 185.5 |
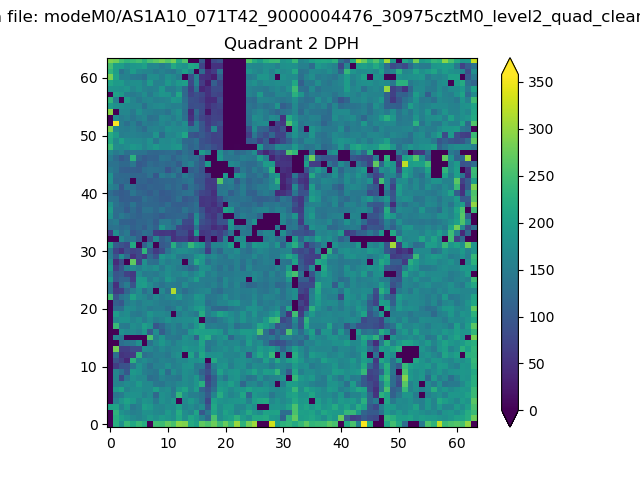
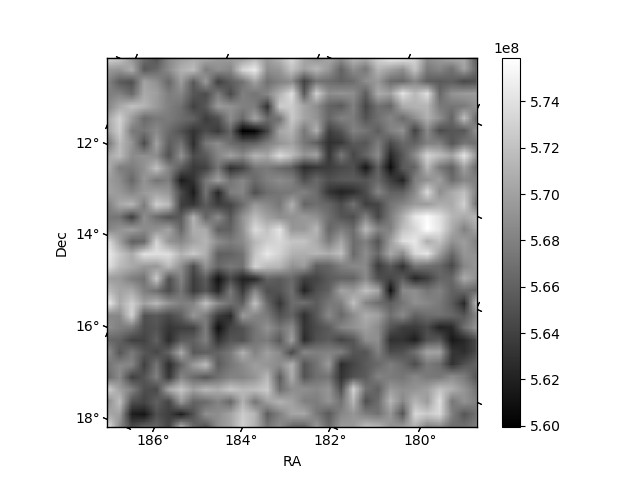
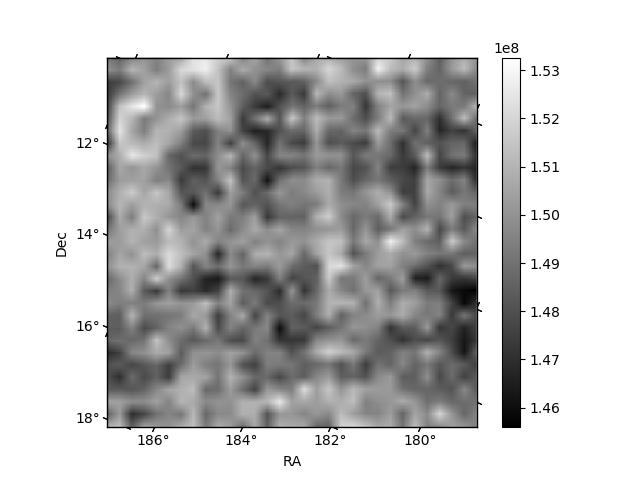
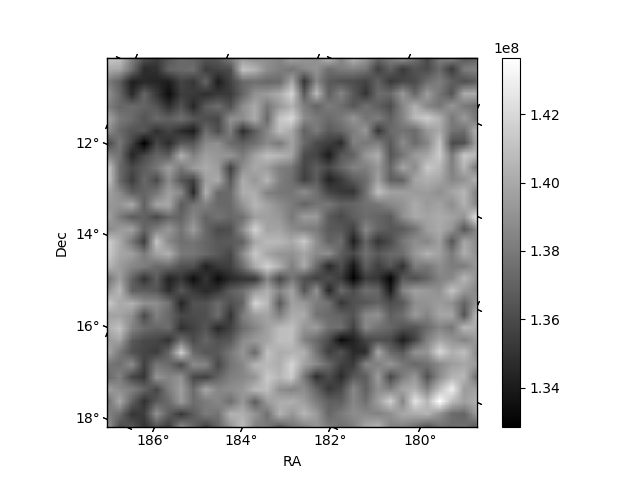
Histogram calculated using DETX and DETY for each event in the final _common_clean file
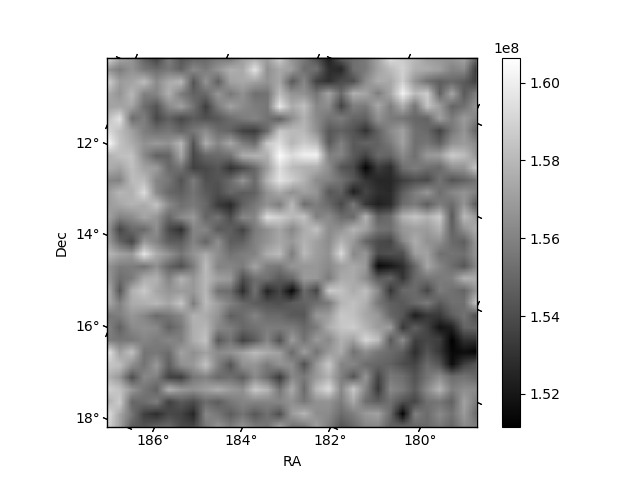
| Quadrant A | 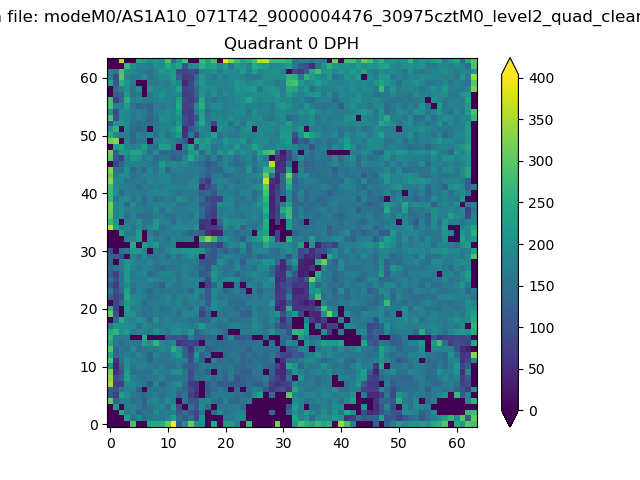 |
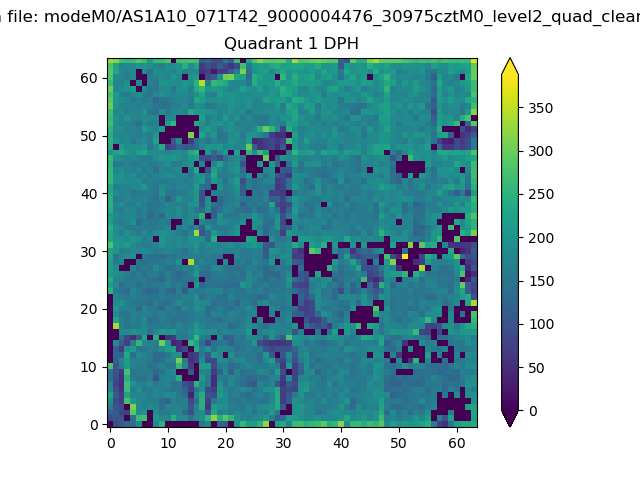 |
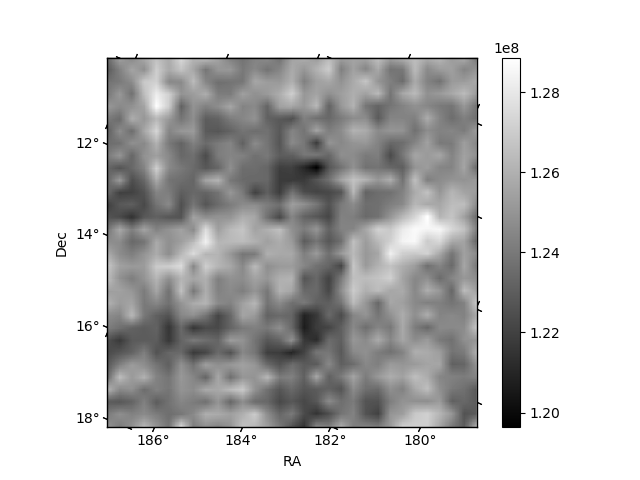
Quadrant B |
|---|---|---|---|
| Quadrant D | 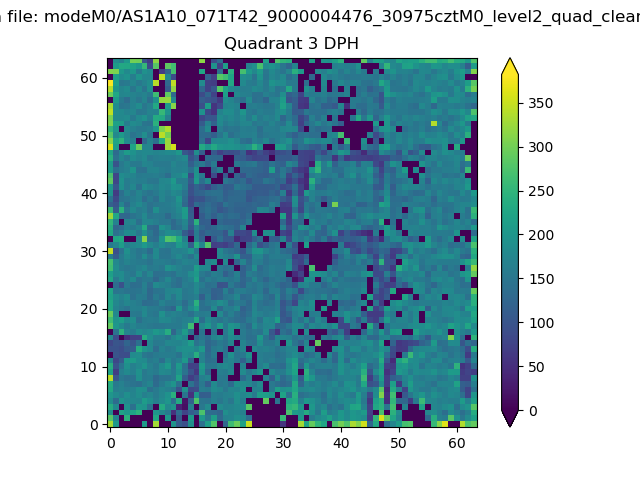 |
 |
Quadrant C |
| Plot type | Count rate plots | Images |
|---|---|---|
| Comparison with Poisson distribution Blue bars denote a histogram of data divided into 1 sec bins. Red curve is a Poisson curve with rate = median count rate of data. |
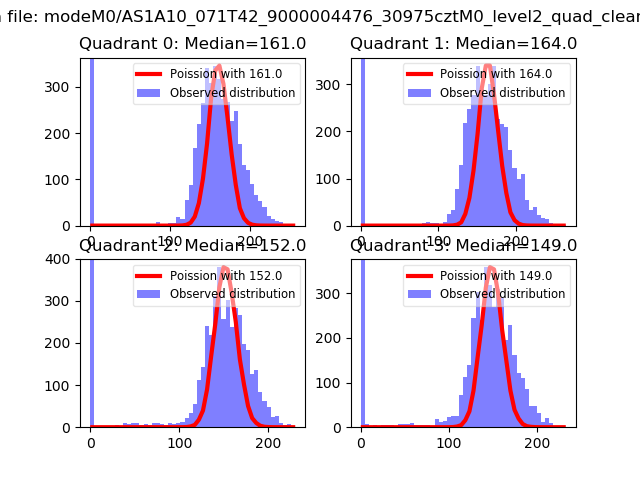 |
 |
| Quadrant-wise count rates Data is divided into 100 sec bins |
 |
|
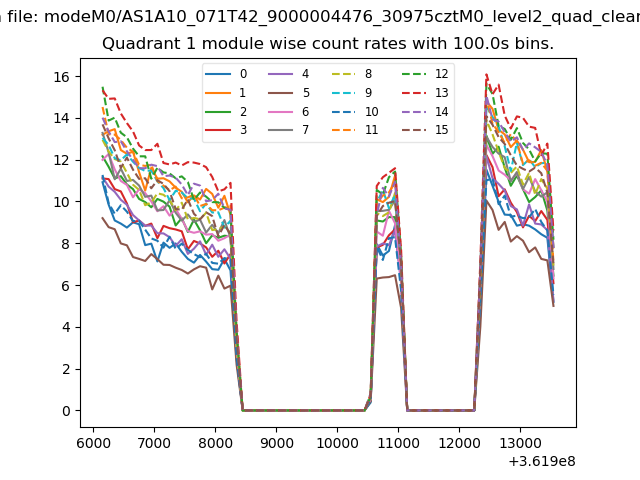
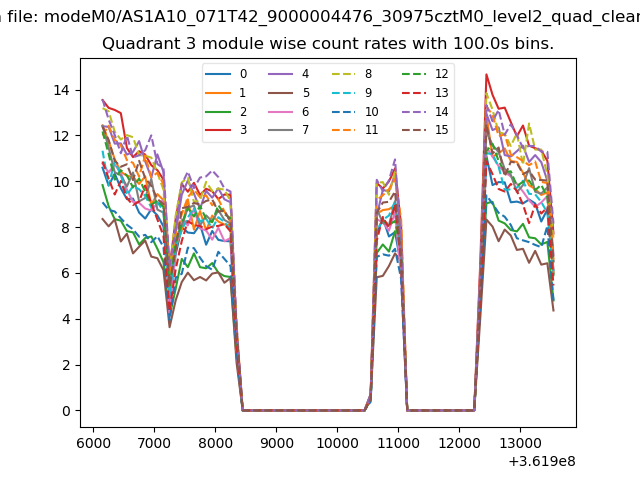
| Module-wise count rates for Quadrant A Data is divided into 100 sec bins |
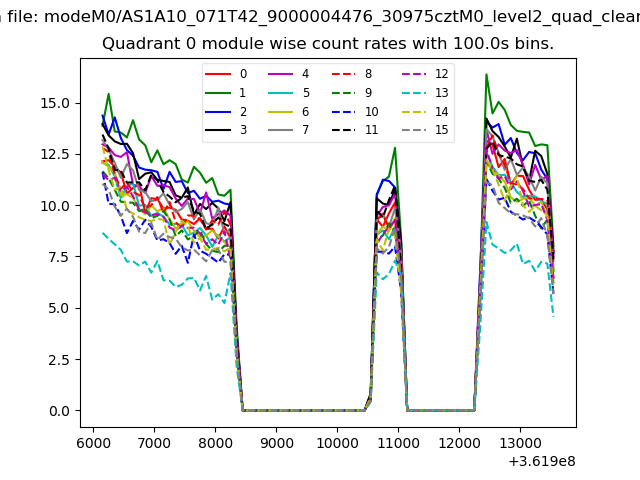 |
 |
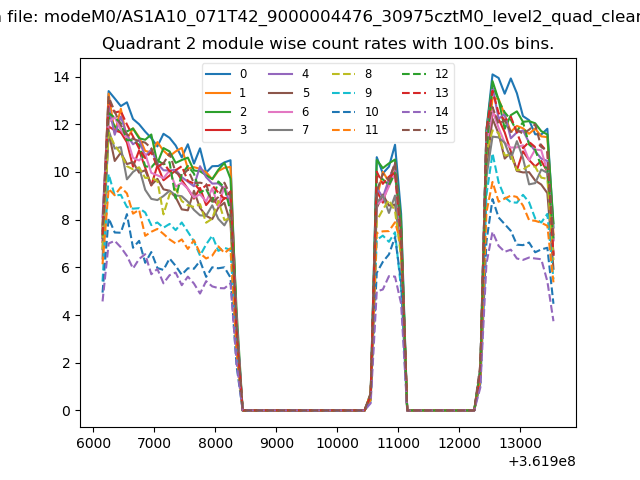
| Module-wise count rates for Quadrant B Data is divided into 100 sec bins |
 |
 |
| Module-wise count rates for Quadrant C Data is divided into 100 sec bins |
 |
 |
| Module-wise count rates for Quadrant D Data is divided into 100 sec bins |
 |
 |
| Parameter | Plot |
|---|---|
| CZT HV Monitor | 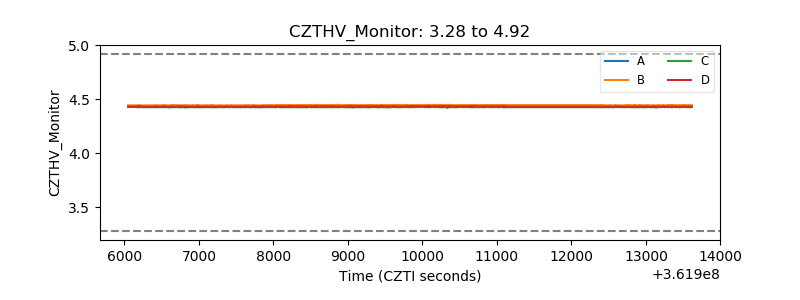 |
| D_VDD | 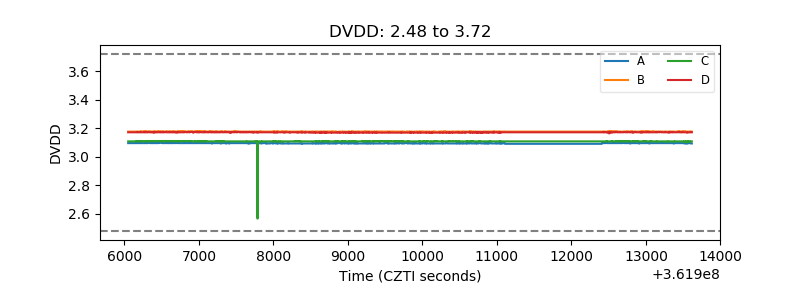 |
| Temperature 1 | 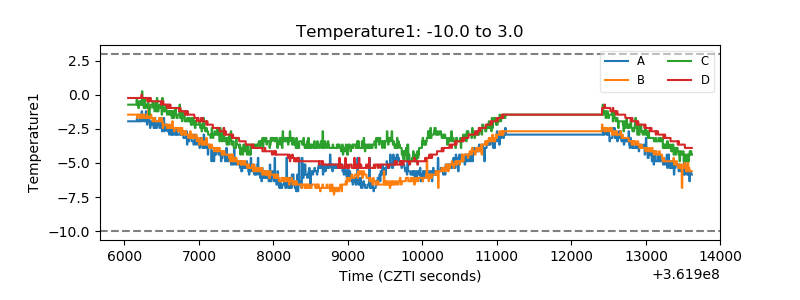 |
| Veto HV Monitor | 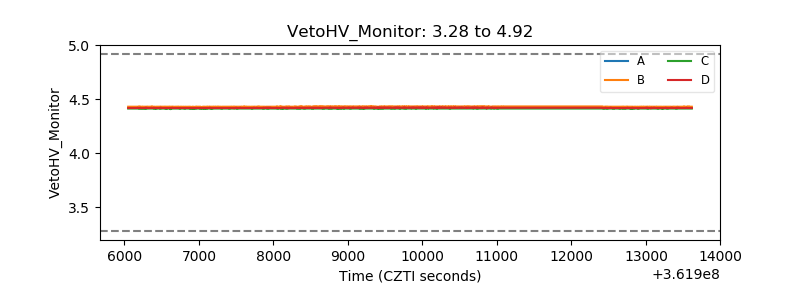 |
| Veto LLD | 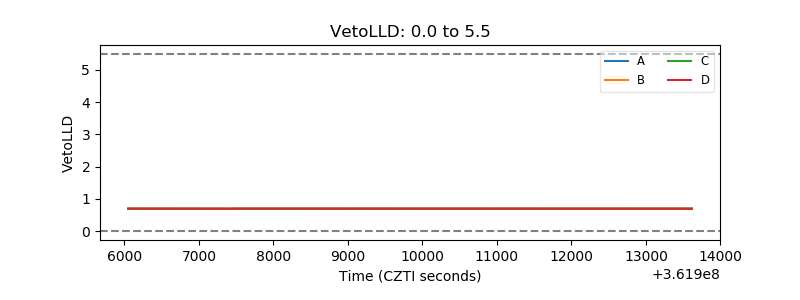 |
| Alpha Counter | 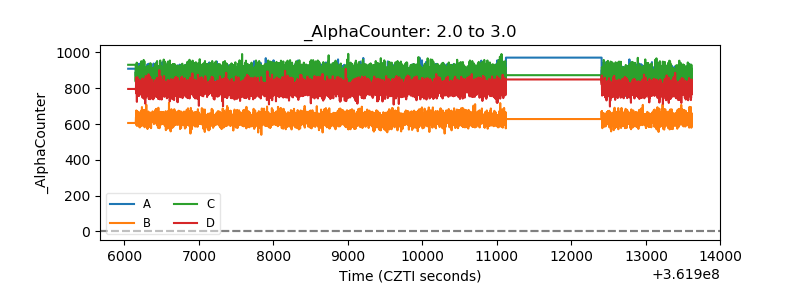 |
| _CPM_Rate | 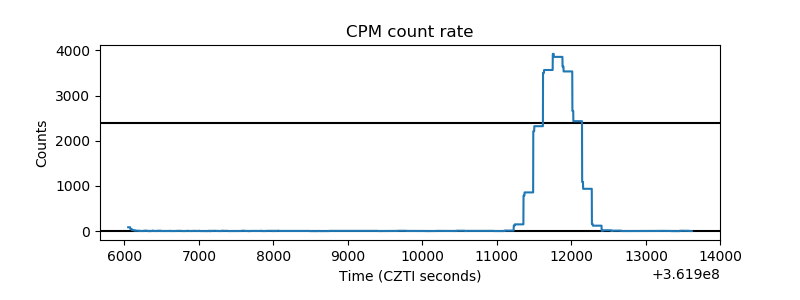 |
| CZT Counter | 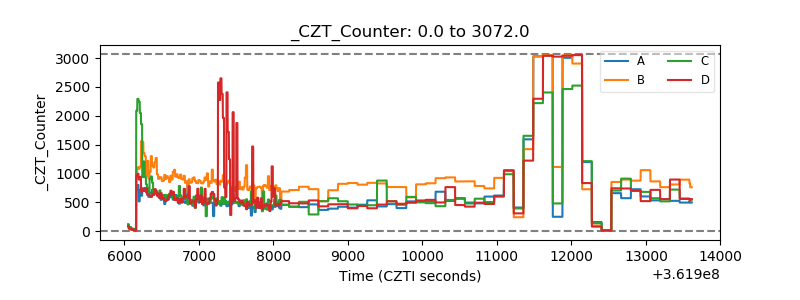 |
| +2.5 Volts monitor |  |
| +5 Volts monitor |  |
| _ROLL_ROT | 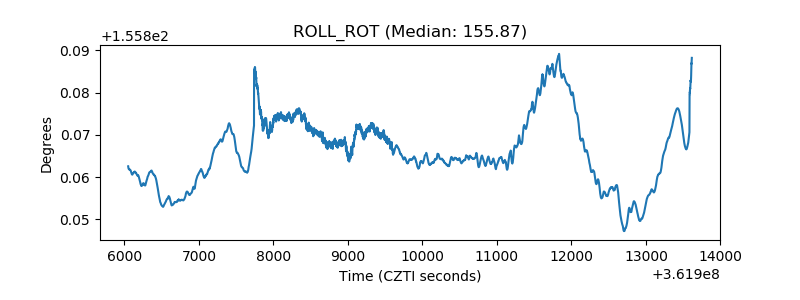 |
| _Roll_DEC | 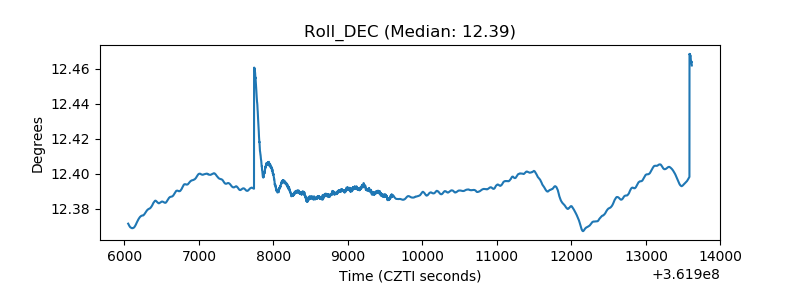 |
| _Roll_RA | 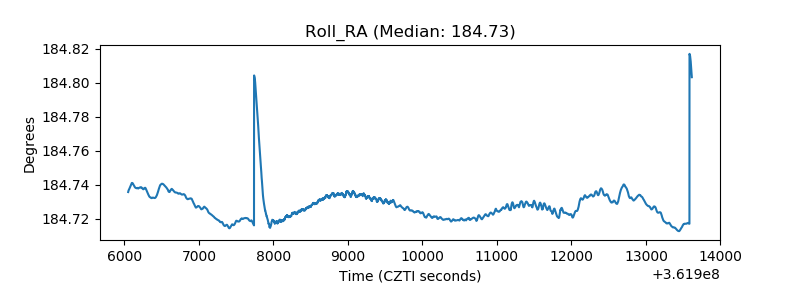 |
| Veto Counter | 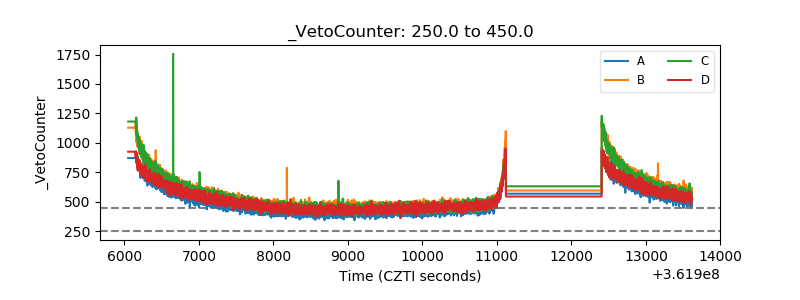 |