| Param | Original file | Final file |
|---|---|---|
| Filename | modeM0/AS1A10_071T42_9000004476_30976cztM0_level2.evt | modeM0/AS1A10_071T42_9000004476_30976cztM0_level2_quad_clean.evt |
| Size (bytes) | 540,780,480 | 97,349,760 |
| Size | 515.7 MB | 92.8 MB |
| Events in quadrant A | 3,234,447 | 656,161 |
| Events in quadrant B | 5,129,945 | 665,888 |
| Events in quadrant C | 3,899,774 | 606,029 |
| Events in quadrant D | 3,698,102 | 591,652 |
| Mode SS | |||
|---|---|---|---|
| Quadrant | BADHDUFLAG | Total packets | Discarded packets |
| A | 0 | 126 | 0 |
| B | 0 | 126 | 0 |
| C | 0 | 126 | 0 |
| D | 0 | 126 | 0 |
| Mode M0 | |||
|---|---|---|---|
| Quadrant | BADHDUFLAG | Total packets | Discarded packets |
| A | 0 | 13260 | 2 |
| B | 0 | 19073 | 2 |
| C | 0 | 15464 | 2 |
| D | 0 | 14919 | 2 |
| Mode M9 | |||
|---|---|---|---|
| Quadrant | BADHDUFLAG | Total packets | Discarded packets |
| A | 0 | 17 | 0 |
| B | 0 | 18 | 0 |
| C | 0 | 18 | 0 |
| D | 0 | 18 | 0 |
| Quadrant | Total seconds | Saturated seconds | Saturation percentage |
|---|---|---|---|
| A | 6132 | 27 | 0.440313% |
| B | 6132 | 92 | 1.500326% |
| C | 6132 | 263 | 4.288976% |
| D | 6132 | 99 | 1.614481% |
Noise dominated data is calculated using 1-second bins in cleaned event files. If a bin has >2000 counts, and if more than 50% of those come from <1% of pixels, then it is considered to be noise-dominated and hence unusable.
| Quadrant | # 1 sec bins | Bins with >0 counts | Bins with >2000 counts | High rate bins dominated by noise | Noise dominated (total time) | Noise dominated (detector-on time) | Marked lightcurve |
|---|---|---|---|---|---|---|---|
| A | 7507 | 6133 | 0 | 0 | 0.00% | 0.00% | 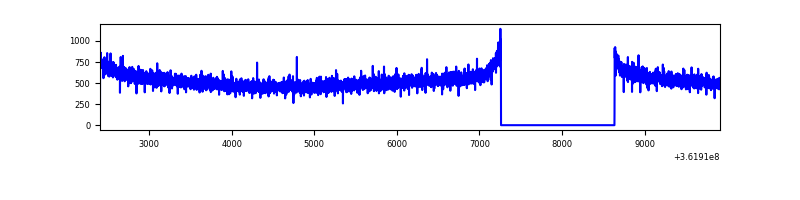 |
| B | 7507 | 6133 | 6 | 6 | 0.08% | 0.10% | 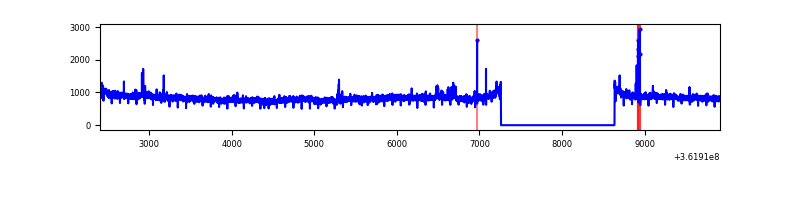 |
| C | 7507 | 6133 | 143 | 143 | 1.90% | 2.33% | 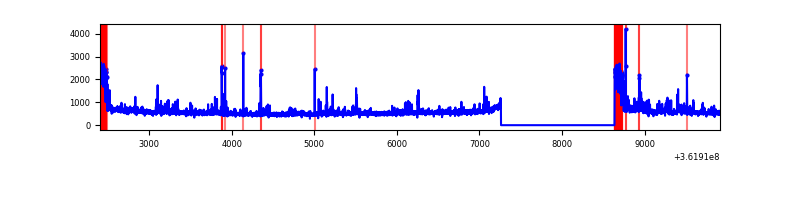 |
| D | 7507 | 6133 | 83 | 83 | 1.11% | 1.35% | 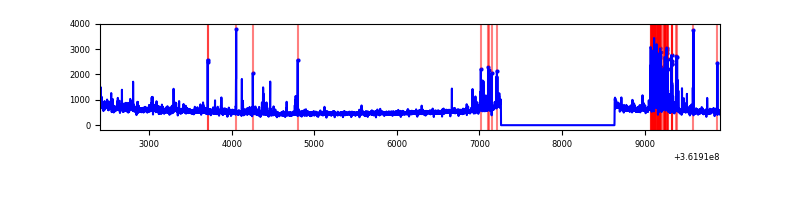 |
Top three noisy pixels from each quadrant. If the there are fewer than three noisy pixels in the level2.evt file, extra rows are filled as -1
| Pixel properties | Quadrant properties | ||||||
|---|---|---|---|---|---|---|---|
| Quadrant | DetID | PixID | Counts | Sigma | Mean | Median | Sigma |
| A | 13 | 254 | 11851 | 66.29 | 839 | 826 | 166.3 |
| A | 3 | 137 | 7622 | 40.86 | 839 | 826 | 166.3 |
| A | 0 | 226 | 7043 | 37.38 | 839 | 826 | 166.3 |
| B | 6 | 159 | 1759469 | 11264.91 | 837 | 819 | 156.1 |
| B | 0 | 190 | 37680 | 236.11 | 837 | 819 | 156.1 |
| B | 6 | 36 | 22918 | 141.55 | 837 | 819 | 156.1 |
| C | 0 | 10 | 665257 | 3625.09 | 784 | 792 | 183.3 |
| C | 14 | 238 | 130215 | 706.08 | 784 | 792 | 183.3 |
| C | 3 | 233 | 15685 | 81.25 | 784 | 792 | 183.3 |
| D | 8 | 195 | 277594 | 1473.25 | 791 | 772 | 187.9 |
| D | 13 | 249 | 245045 | 1300.02 | 791 | 772 | 187.9 |
| D | 2 | 250 | 88735 | 468.14 | 791 | 772 | 187.9 |
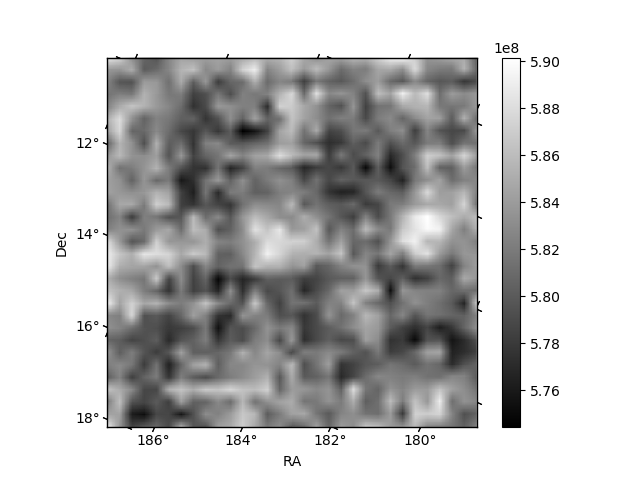
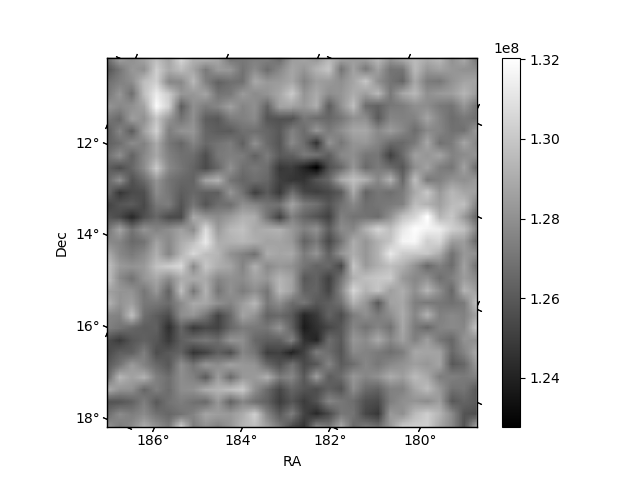
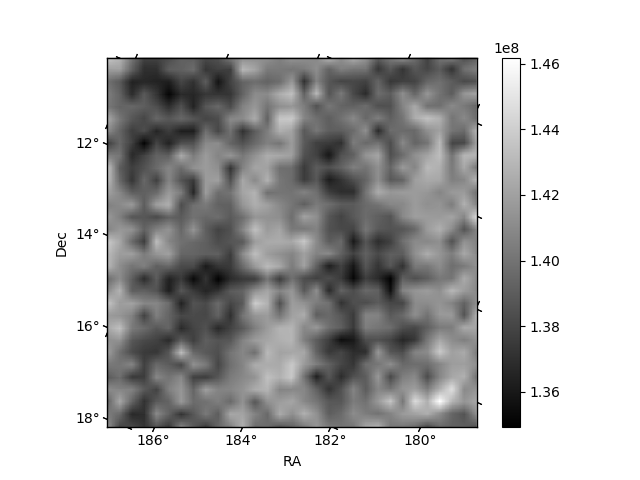
Histogram calculated using DETX and DETY for each event in the final _common_clean file
| Quadrant A | 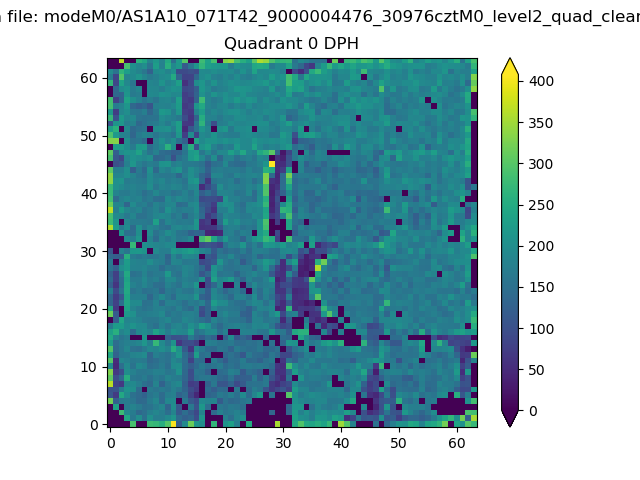 |
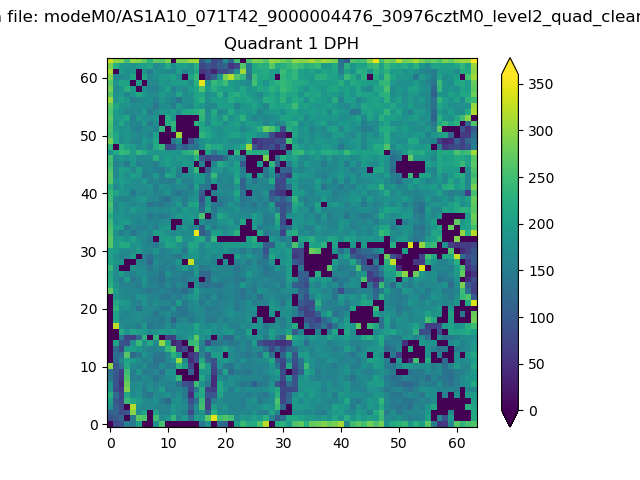 |
Quadrant B |
|---|---|---|---|
| Quadrant D | 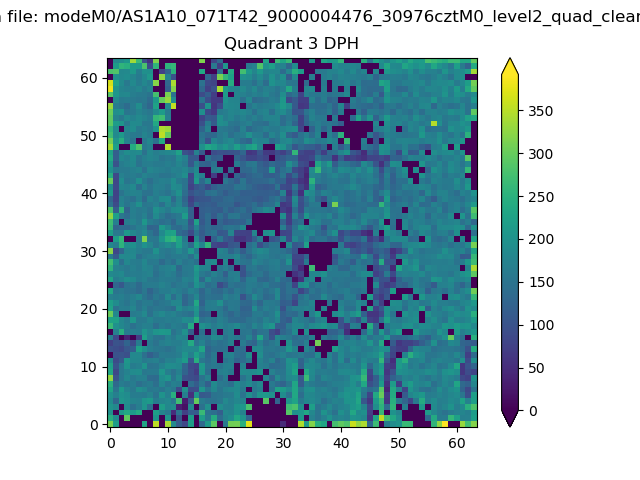 |
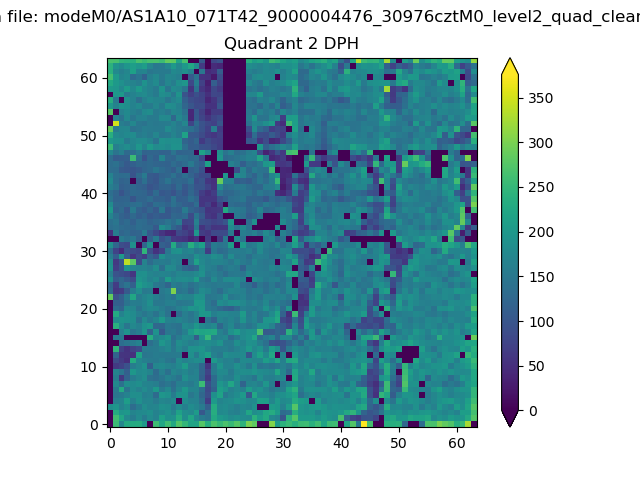 |
Quadrant C |
| Plot type | Count rate plots | Images |
|---|---|---|
| Comparison with Poisson distribution Blue bars denote a histogram of data divided into 1 sec bins. Red curve is a Poisson curve with rate = median count rate of data. |
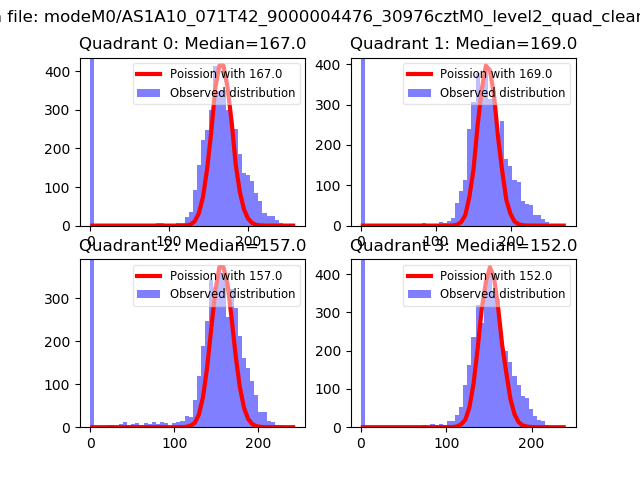 |
 |
| Quadrant-wise count rates Data is divided into 100 sec bins |
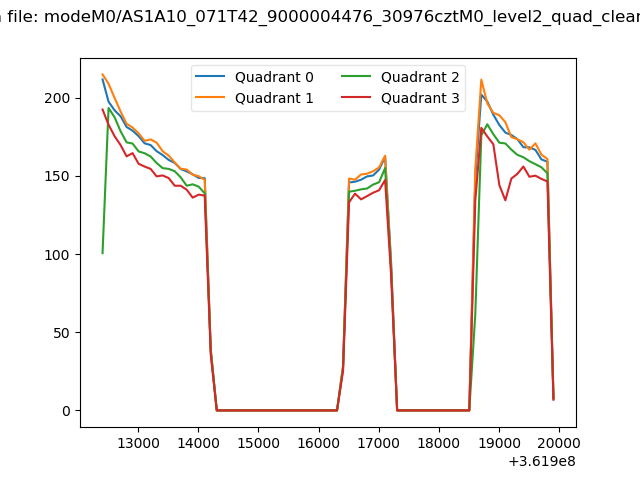 |
|
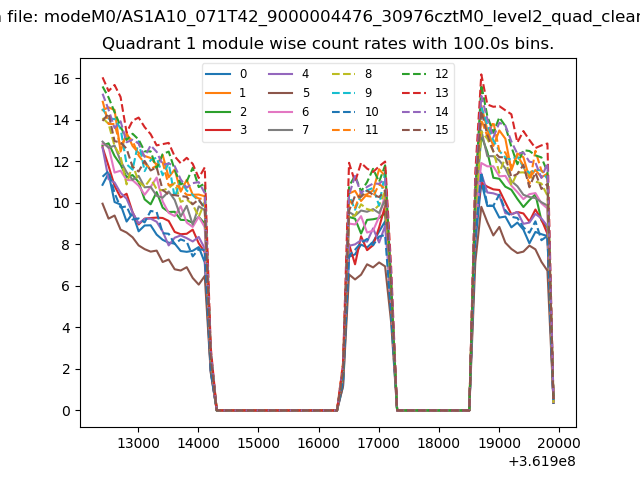
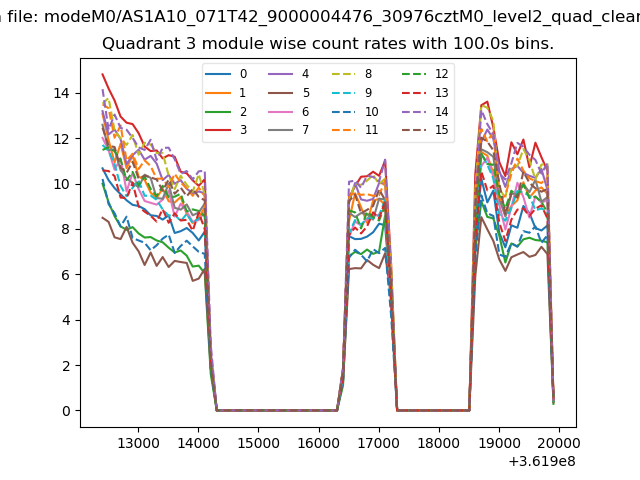
| Module-wise count rates for Quadrant A Data is divided into 100 sec bins |
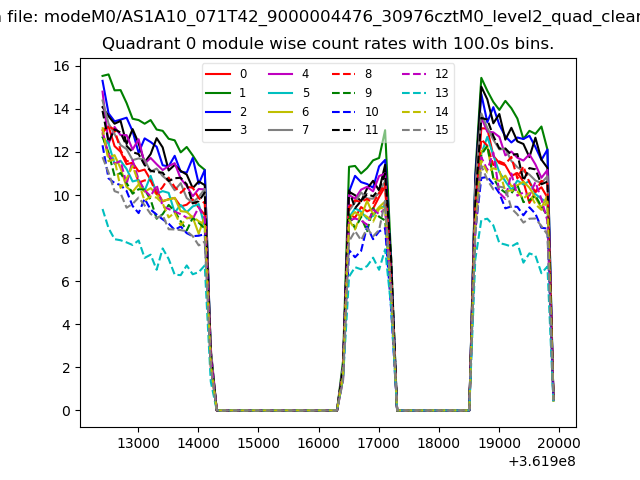 |
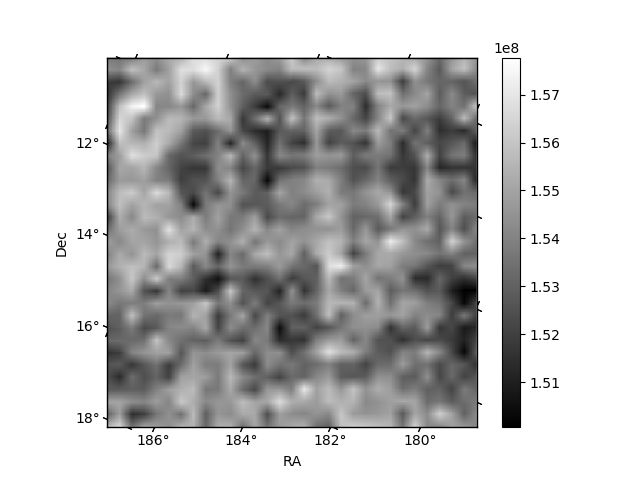 |
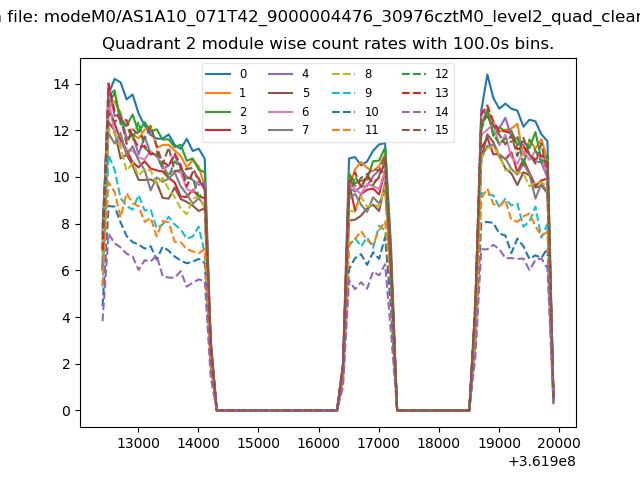
| Module-wise count rates for Quadrant B Data is divided into 100 sec bins |
 |
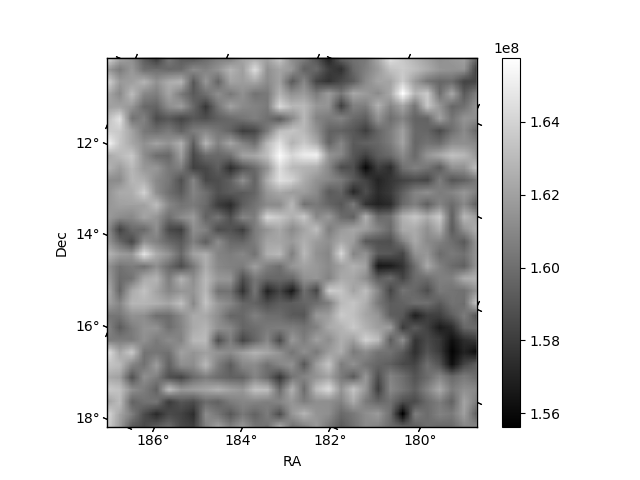 |
| Module-wise count rates for Quadrant C Data is divided into 100 sec bins |
 |
 |
| Module-wise count rates for Quadrant D Data is divided into 100 sec bins |
 |
 |
| Parameter | Plot |
|---|---|
| CZT HV Monitor | 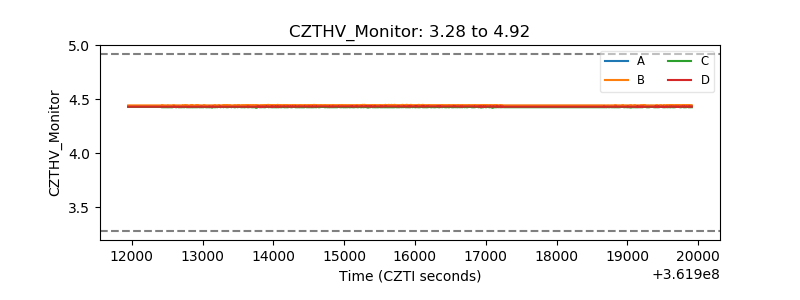 |
| D_VDD | 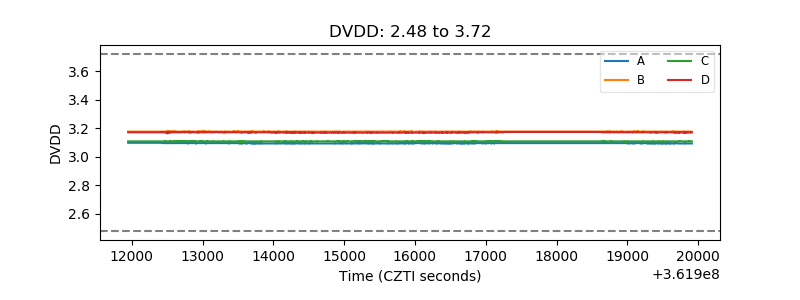 |
| Temperature 1 | 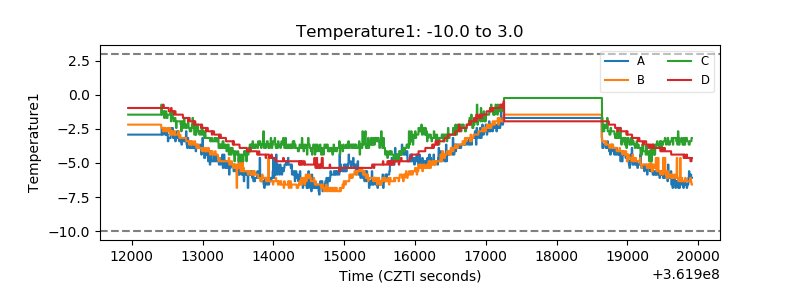 |
| Veto HV Monitor | 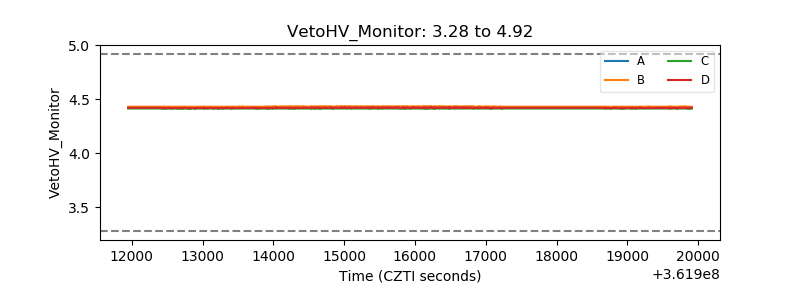 |
| Veto LLD | 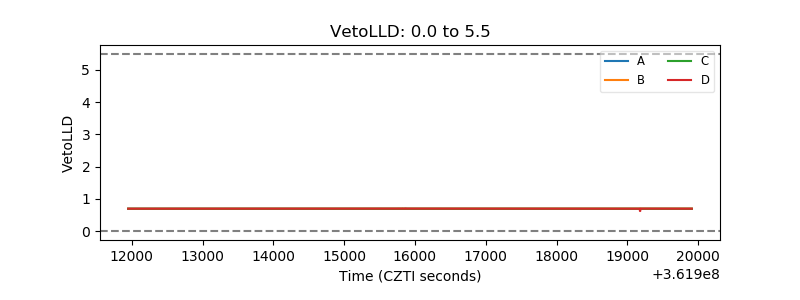 |
| Alpha Counter | 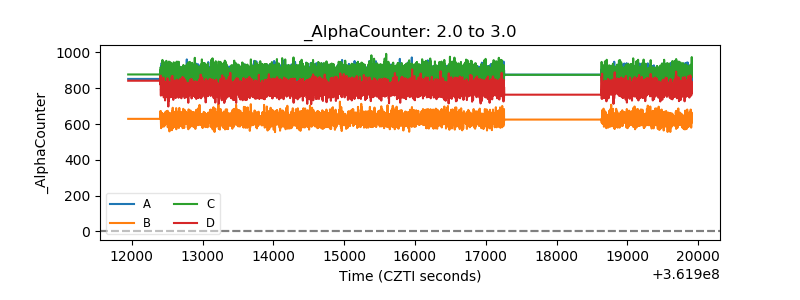 |
| _CPM_Rate | 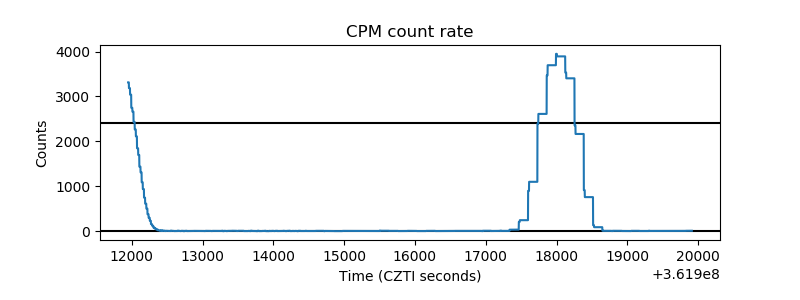 |
| CZT Counter | 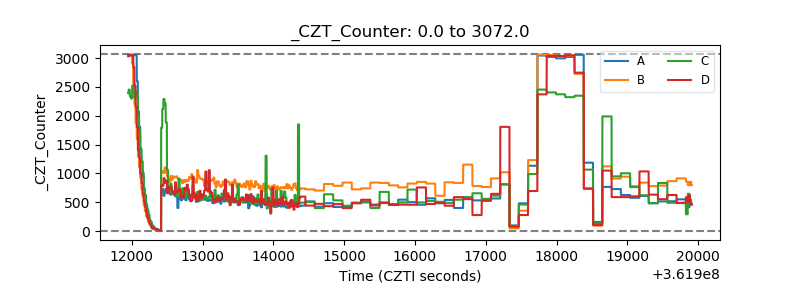 |
| +2.5 Volts monitor |  |
| +5 Volts monitor |  |
| _ROLL_ROT | 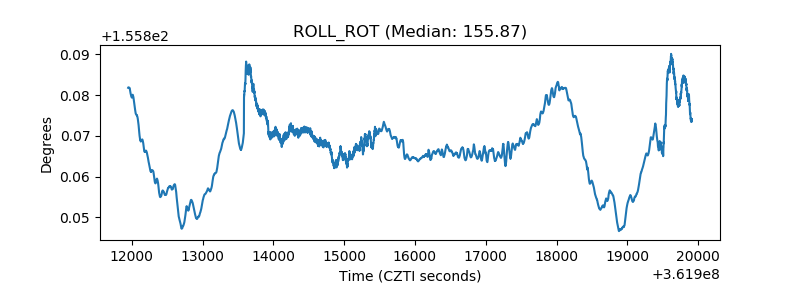 |
| _Roll_DEC | 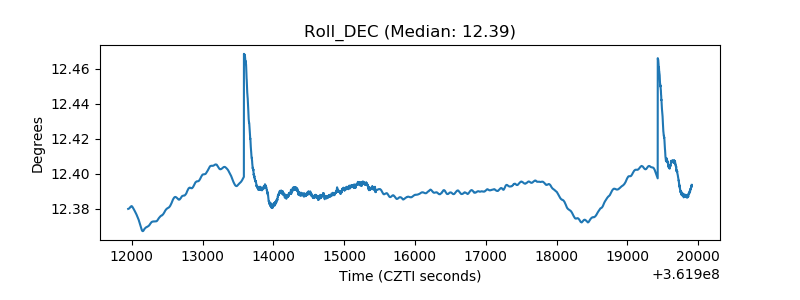 |
| _Roll_RA | 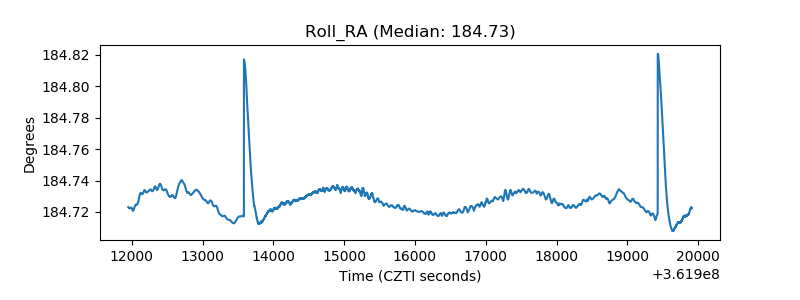 |
| Veto Counter | 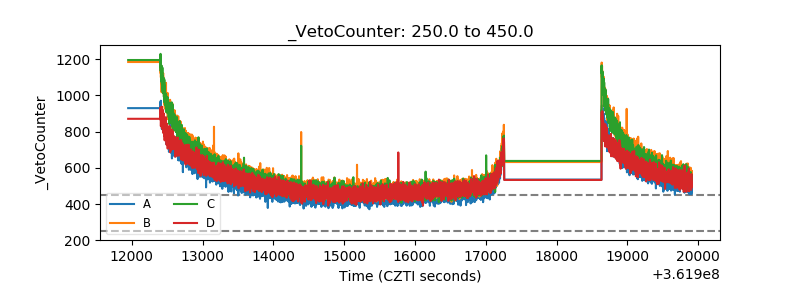 |