| Param | Original file | Final file |
|---|---|---|
| Filename | modeM0/AS1A10_071T42_9000004476_30978cztM0_level2.evt | modeM0/AS1A10_071T42_9000004476_30978cztM0_level2_quad_clean.evt |
| Size (bytes) | 534,093,120 | 80,876,160 |
| Size | 509.4 MB | 77.1 MB |
| Events in quadrant A | 3,180,753 | 524,302 |
| Events in quadrant B | 5,115,878 | 529,474 |
| Events in quadrant C | 3,914,344 | 481,663 |
| Events in quadrant D | 3,543,602 | 480,075 |
| Mode SS | |||
|---|---|---|---|
| Quadrant | BADHDUFLAG | Total packets | Discarded packets |
| A | 0 | 126 | 0 |
| B | 0 | 126 | 0 |
| C | 0 | 126 | 0 |
| D | 0 | 126 | 0 |
| Mode M0 | |||
|---|---|---|---|
| Quadrant | BADHDUFLAG | Total packets | Discarded packets |
| A | 0 | 13062 | 2 |
| B | 0 | 19213 | 2 |
| C | 0 | 15531 | 2 |
| D | 0 | 14549 | 2 |
| Mode M9 | |||
|---|---|---|---|
| Quadrant | BADHDUFLAG | Total packets | Discarded packets |
| A | 0 | 19 | 0 |
| B | 0 | 20 | 0 |
| C | 0 | 20 | 0 |
| D | 0 | 20 | 0 |
| Quadrant | Total seconds | Saturated seconds | Saturation percentage |
|---|---|---|---|
| A | 6211 | 18 | 0.289808% |
| B | 6211 | 91 | 1.465142% |
| C | 6211 | 225 | 3.622605% |
| D | 6211 | 25 | 0.402512% |
Noise dominated data is calculated using 1-second bins in cleaned event files. If a bin has >2000 counts, and if more than 50% of those come from <1% of pixels, then it is considered to be noise-dominated and hence unusable.
| Quadrant | # 1 sec bins | Bins with >0 counts | Bins with >2000 counts | High rate bins dominated by noise | Noise dominated (total time) | Noise dominated (detector-on time) | Marked lightcurve |
|---|---|---|---|---|---|---|---|
| A | 7526 | 6212 | 0 | 0 | 0.00% | 0.00% | 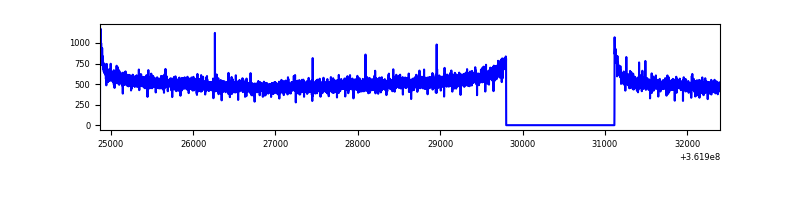 |
| B | 7526 | 6212 | 2 | 2 | 0.03% | 0.03% | 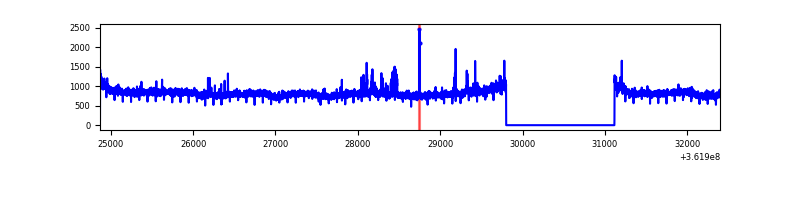 |
| C | 7526 | 6212 | 122 | 122 | 1.62% | 1.96% | 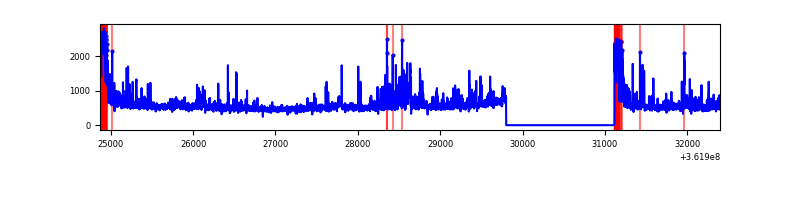 |
| D | 7526 | 6212 | 13 | 13 | 0.17% | 0.21% | 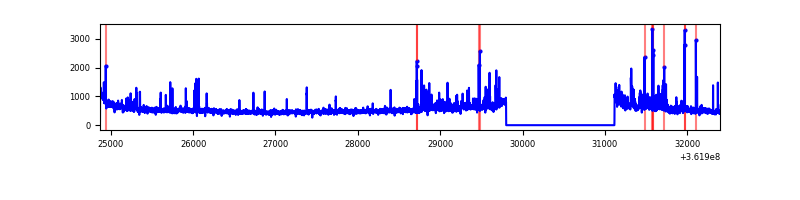 |
Top three noisy pixels from each quadrant. If the there are fewer than three noisy pixels in the level2.evt file, extra rows are filled as -1
| Pixel properties | Quadrant properties | ||||||
|---|---|---|---|---|---|---|---|
| Quadrant | DetID | PixID | Counts | Sigma | Mean | Median | Sigma |
| A | 13 | 254 | 12045 | 69.05 | 823 | 809 | 162.7 |
| A | 3 | 137 | 7816 | 43.06 | 823 | 809 | 162.7 |
| A | 0 | 226 | 7107 | 38.7 | 823 | 809 | 162.7 |
| B | 6 | 159 | 1775025 | 11409.68 | 823 | 806 | 155.5 |
| B | 0 | 190 | 66008 | 419.3 | 823 | 806 | 155.5 |
| B | 12 | 111 | 18503 | 113.81 | 823 | 806 | 155.5 |
| C | 0 | 10 | 749453 | 4180.63 | 770 | 777 | 179.1 |
| C | 14 | 238 | 127036 | 705.03 | 770 | 777 | 179.1 |
| C | 2 | 114 | 13987 | 73.77 | 770 | 777 | 179.1 |
| D | 8 | 195 | 318578 | 1700.95 | 781 | 761 | 186.8 |
| D | 1 | 52 | 105089 | 558.36 | 781 | 761 | 186.8 |
| D | 2 | 250 | 102198 | 542.89 | 781 | 761 | 186.8 |
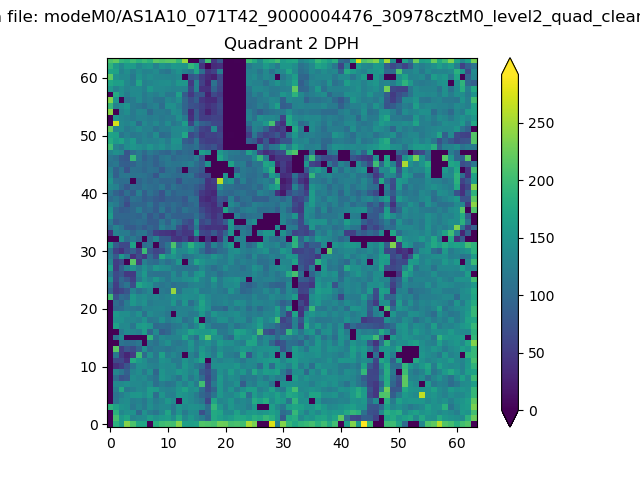
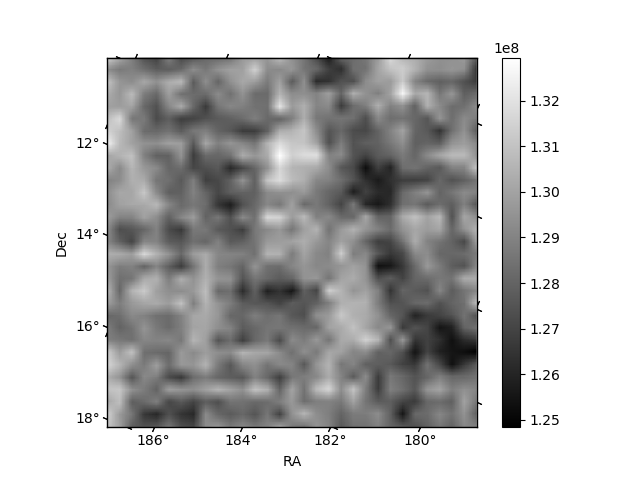
Histogram calculated using DETX and DETY for each event in the final _common_clean file
| Quadrant A | 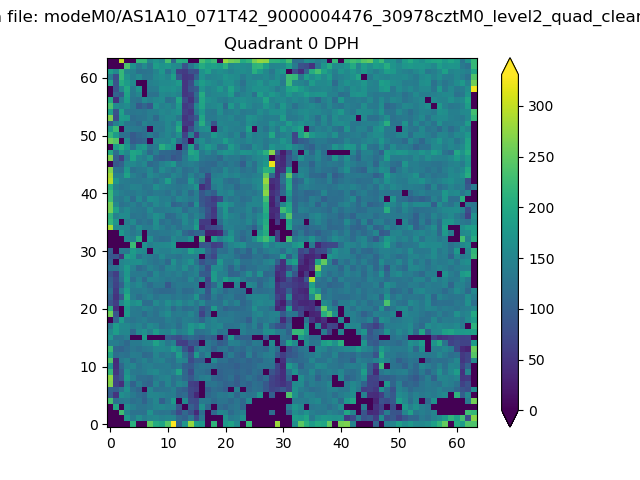 |
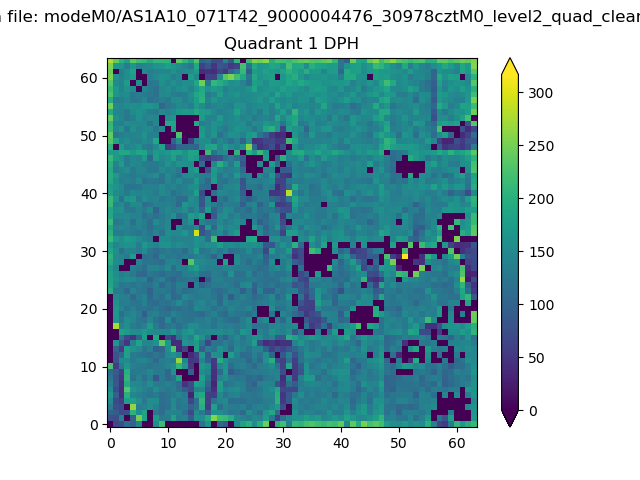 |
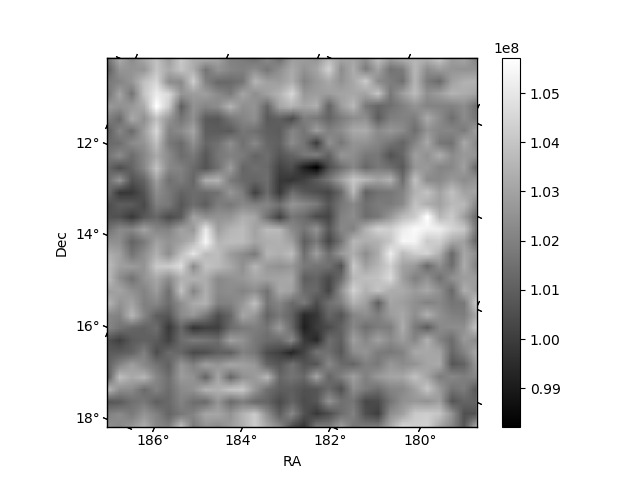
Quadrant B |
|---|---|---|---|
| Quadrant D | 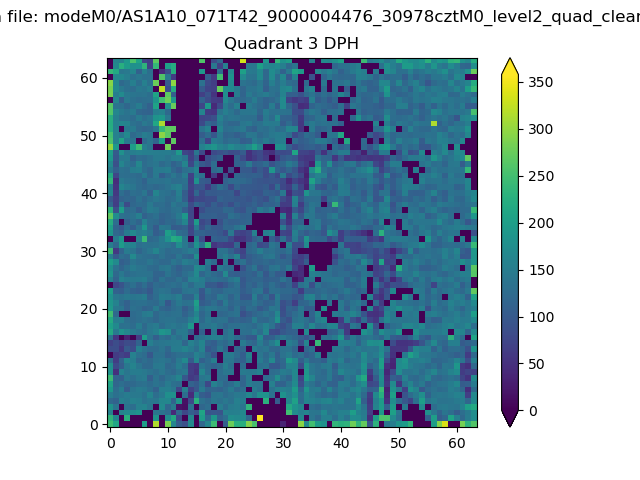 |
 |
Quadrant C |
| Plot type | Count rate plots | Images |
|---|---|---|
| Comparison with Poisson distribution Blue bars denote a histogram of data divided into 1 sec bins. Red curve is a Poisson curve with rate = median count rate of data. |
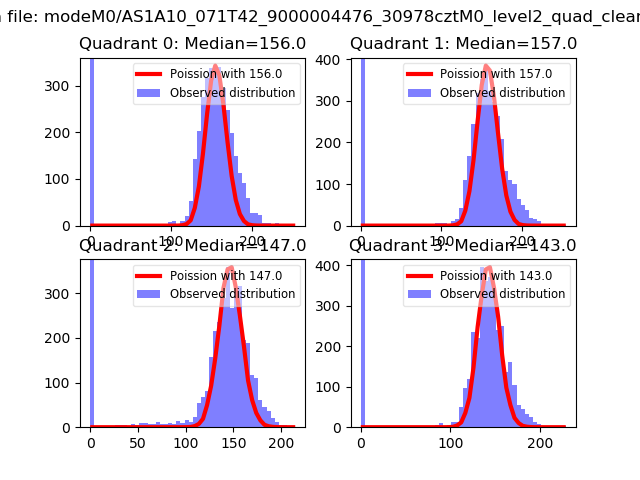 |
 |
| Quadrant-wise count rates Data is divided into 100 sec bins |
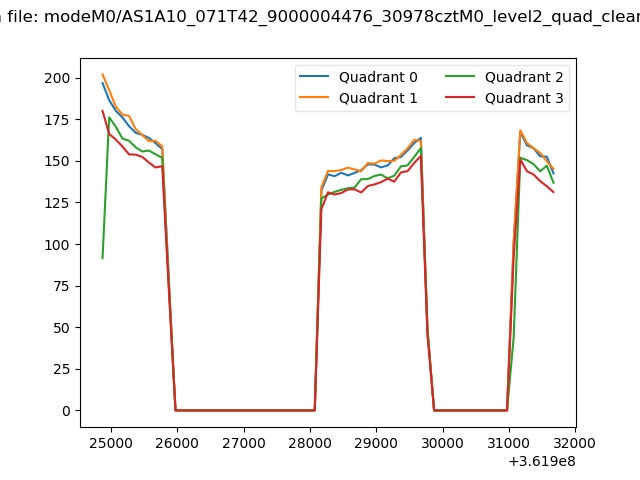 |
|
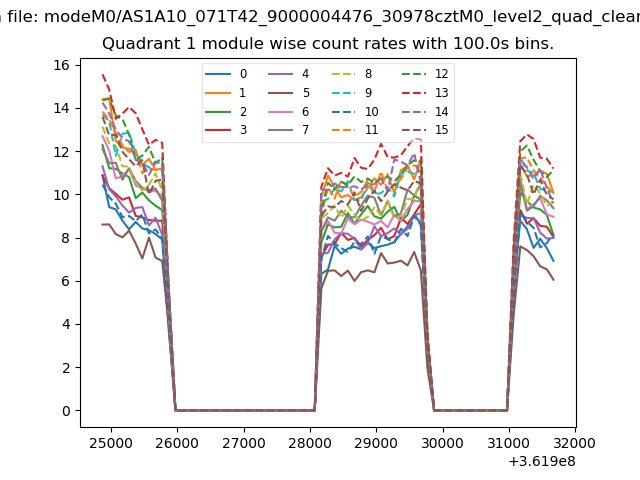
| Module-wise count rates for Quadrant A Data is divided into 100 sec bins |
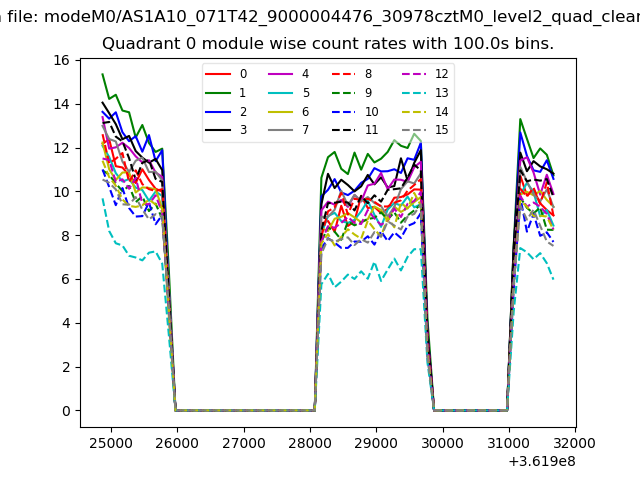 |
 |
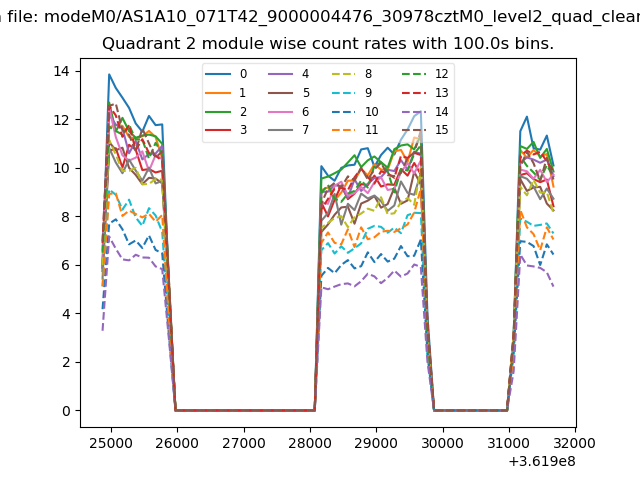
| Module-wise count rates for Quadrant B Data is divided into 100 sec bins |
 |
 |
| Module-wise count rates for Quadrant C Data is divided into 100 sec bins |
 |
 |
| Module-wise count rates for Quadrant D Data is divided into 100 sec bins |
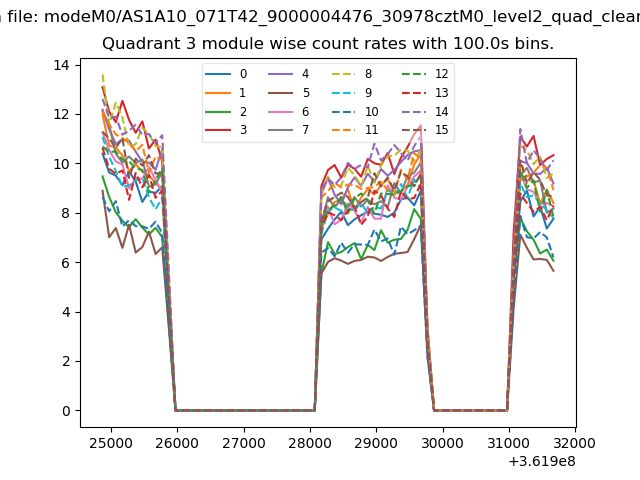 |
 |
| Parameter | Plot |
|---|---|
| CZT HV Monitor |  |
| D_VDD | 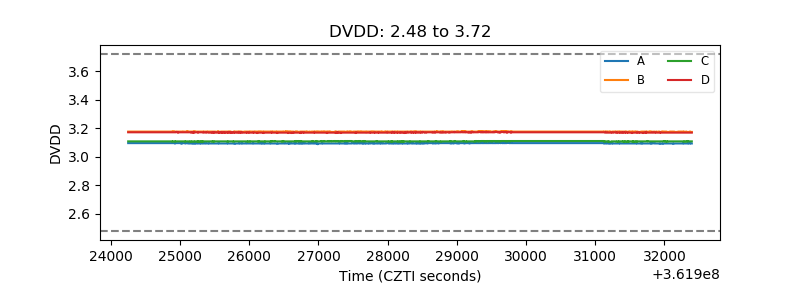 |
| Temperature 1 | 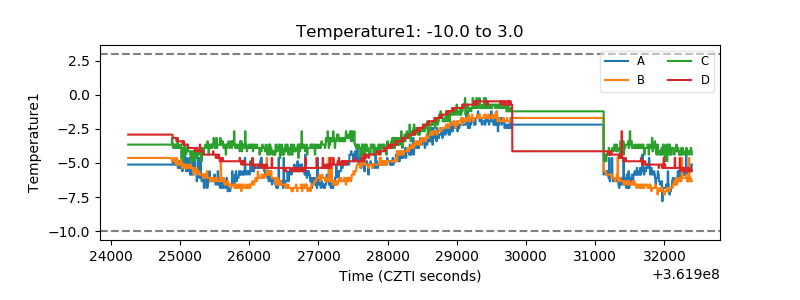 |
| Veto HV Monitor | 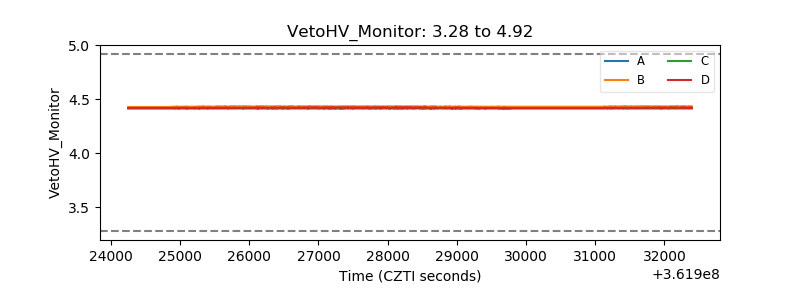 |
| Veto LLD | 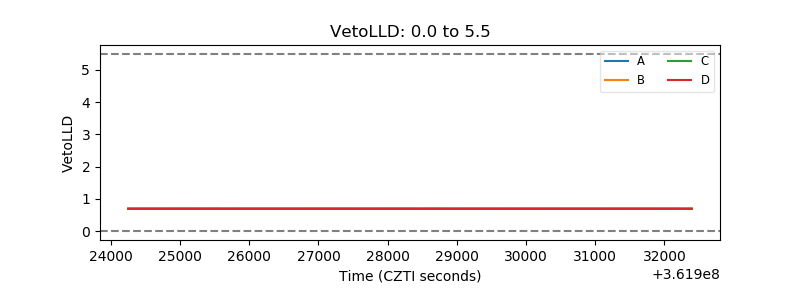 |
| Alpha Counter | 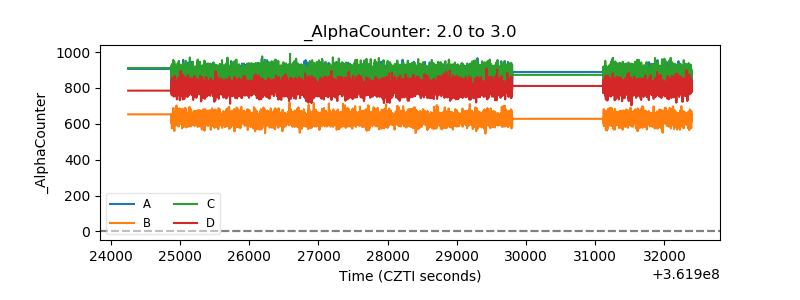 |
| _CPM_Rate | 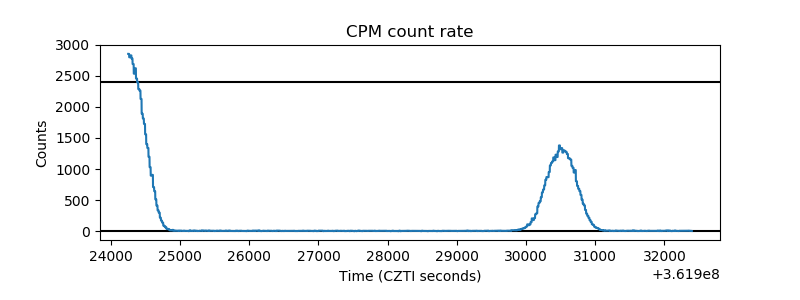 |
| CZT Counter | 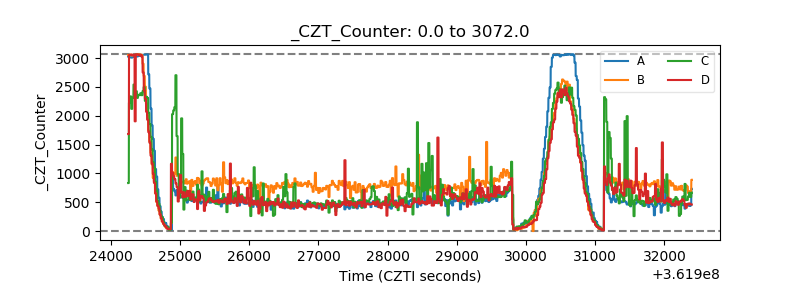 |
| +2.5 Volts monitor |  |
| +5 Volts monitor |  |
| _ROLL_ROT | 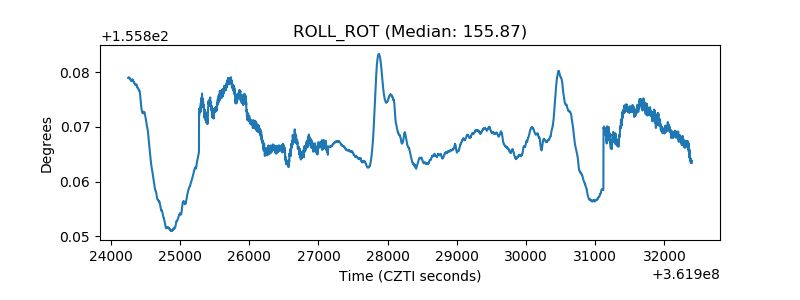 |
| _Roll_DEC | 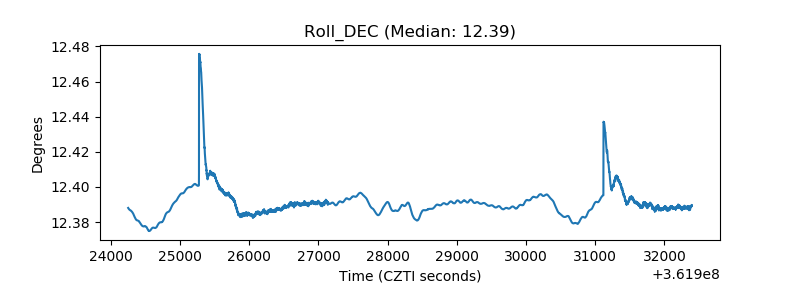 |
| _Roll_RA | 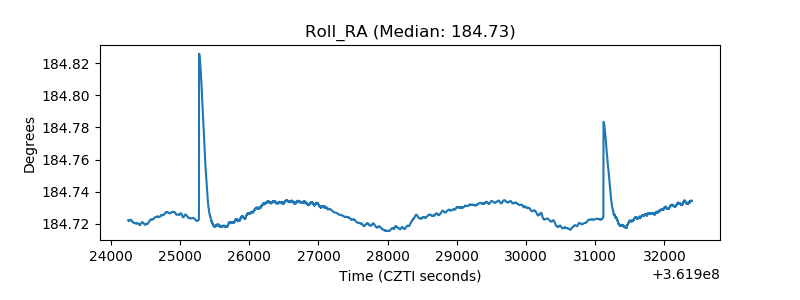 |
| Veto Counter |  |