| Param | Original file | Final file |
|---|---|---|
| Filename | modeM0/AS1A10_071T42_9000004476_30979cztM0_level2.evt | modeM0/AS1A10_071T42_9000004476_30979cztM0_level2_quad_clean.evt |
| Size (bytes) | 553,783,680 | 77,077,440 |
| Size | 528.1 MB | 73.5 MB |
| Events in quadrant A | 3,310,515 | 483,387 |
| Events in quadrant B | 5,354,300 | 483,749 |
| Events in quadrant C | 3,831,180 | 453,603 |
| Events in quadrant D | 3,823,852 | 448,248 |
| Mode SS | |||
|---|---|---|---|
| Quadrant | BADHDUFLAG | Total packets | Discarded packets |
| A | 0 | 140 | 0 |
| B | 0 | 140 | 0 |
| C | 0 | 140 | 0 |
| D | 0 | 140 | 0 |
| Mode M0 | |||
|---|---|---|---|
| Quadrant | BADHDUFLAG | Total packets | Discarded packets |
| A | 0 | 13796 | 2 |
| B | 0 | 20422 | 2 |
| C | 0 | 15389 | 2 |
| D | 0 | 15723 | 2 |
| Mode M9 | |||
|---|---|---|---|
| Quadrant | BADHDUFLAG | Total packets | Discarded packets |
| A | 0 | 22 | 0 |
| B | 0 | 22 | 0 |
| C | 0 | 22 | 0 |
| D | 0 | 22 | 0 |
| Quadrant | Total seconds | Saturated seconds | Saturation percentage |
|---|---|---|---|
| A | 6658 | 31 | 0.465605% |
| B | 6659 | 142 | 2.132452% |
| C | 6659 | 179 | 2.688091% |
| D | 6659 | 37 | 0.555639% |
Noise dominated data is calculated using 1-second bins in cleaned event files. If a bin has >2000 counts, and if more than 50% of those come from <1% of pixels, then it is considered to be noise-dominated and hence unusable.
| Quadrant | # 1 sec bins | Bins with >0 counts | Bins with >2000 counts | High rate bins dominated by noise | Noise dominated (total time) | Noise dominated (detector-on time) | Marked lightcurve |
|---|---|---|---|---|---|---|---|
| A | 8959 | 6661 | 0 | 0 | 0.00% | 0.00% | 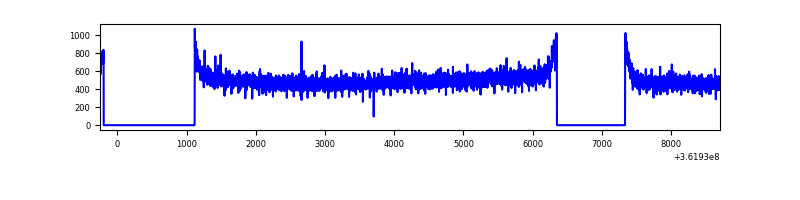 |
| B | 8960 | 6662 | 10 | 10 | 0.11% | 0.15% | 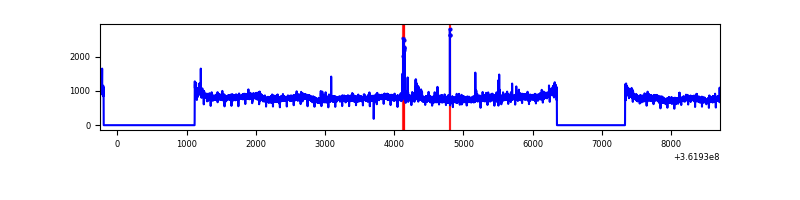 |
| C | 8960 | 6662 | 62 | 62 | 0.69% | 0.93% | 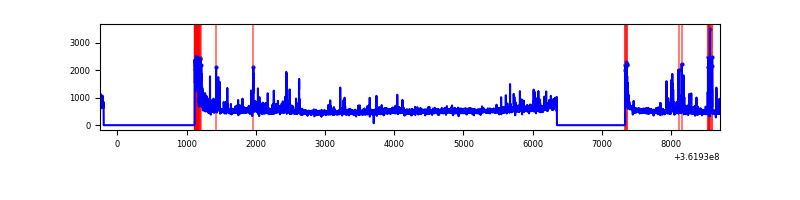 |
| D | 8960 | 6662 | 21 | 21 | 0.23% | 0.32% | 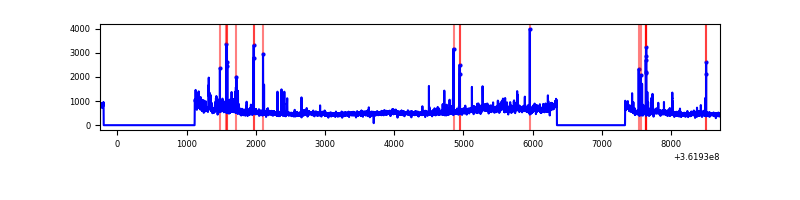 |
Top three noisy pixels from each quadrant. If the there are fewer than three noisy pixels in the level2.evt file, extra rows are filled as -1
| Pixel properties | Quadrant properties | ||||||
|---|---|---|---|---|---|---|---|
| Quadrant | DetID | PixID | Counts | Sigma | Mean | Median | Sigma |
| A | 13 | 254 | 12041 | 65.36 | 856 | 839 | 171.4 |
| A | 3 | 137 | 8382 | 44.01 | 856 | 839 | 171.4 |
| A | 15 | 192 | 8147 | 42.64 | 856 | 839 | 171.4 |
| B | 6 | 159 | 1897151 | 11668.79 | 851 | 830 | 162.5 |
| B | 4 | 80 | 39433 | 237.54 | 851 | 830 | 162.5 |
| B | 0 | 190 | 28552 | 170.58 | 851 | 830 | 162.5 |
| C | 0 | 10 | 503795 | 2624.93 | 811 | 818 | 191.6 |
| C | 14 | 238 | 131942 | 684.31 | 811 | 818 | 191.6 |
| C | 2 | 114 | 15331 | 75.74 | 811 | 818 | 191.6 |
| D | 8 | 195 | 454336 | 2316.54 | 815 | 791 | 195.8 |
| D | 1 | 52 | 120760 | 612.76 | 815 | 791 | 195.8 |
| D | 2 | 250 | 113404 | 575.18 | 815 | 791 | 195.8 |
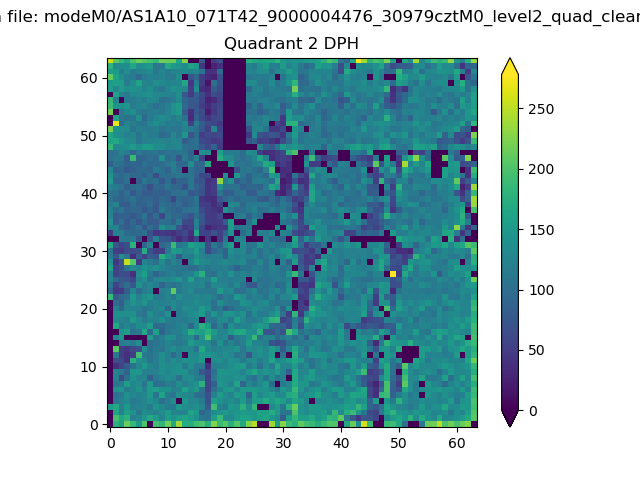
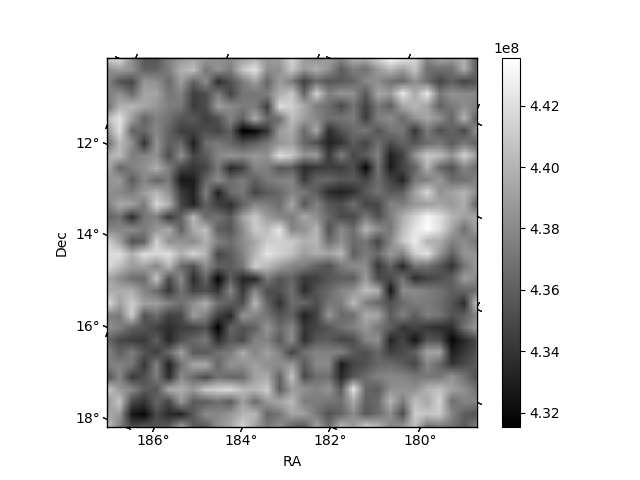
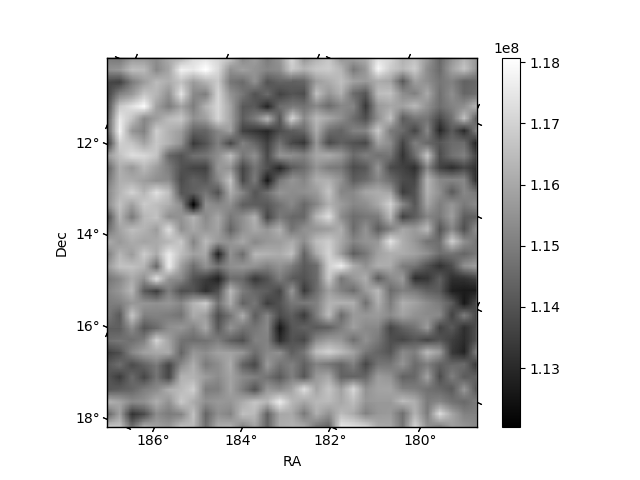
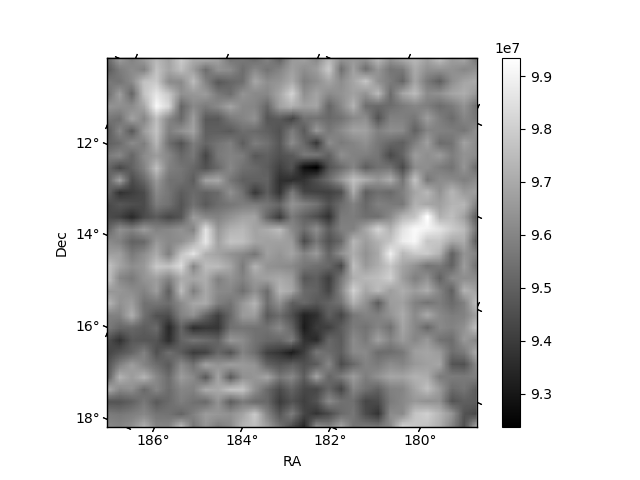
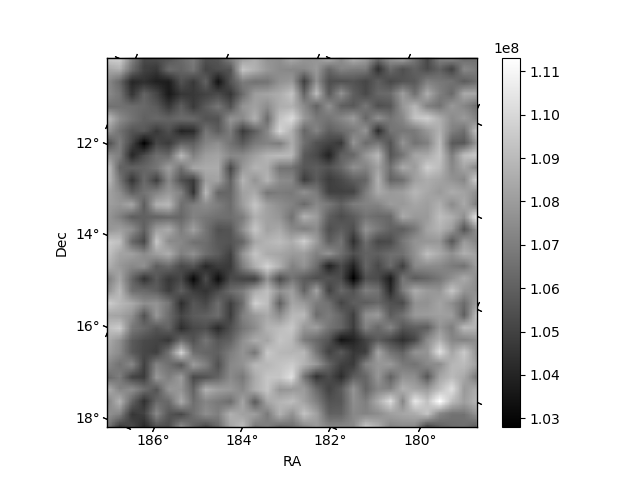
Histogram calculated using DETX and DETY for each event in the final _common_clean file
| Quadrant A | 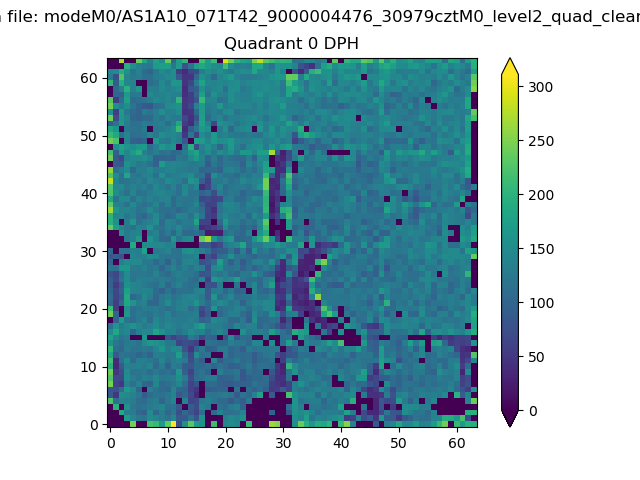 |
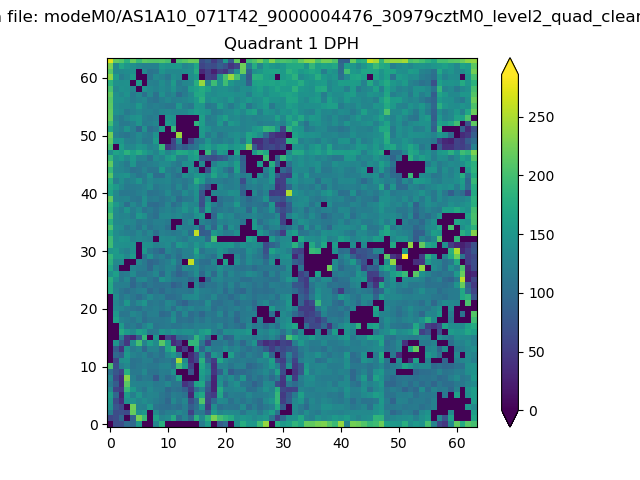 |
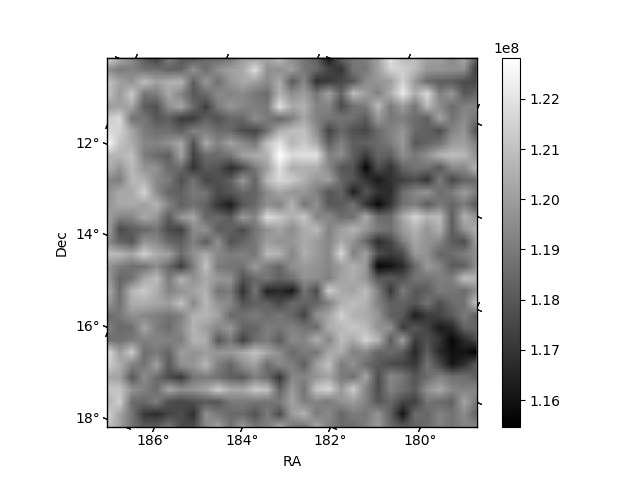
Quadrant B |
|---|---|---|---|
| Quadrant D | 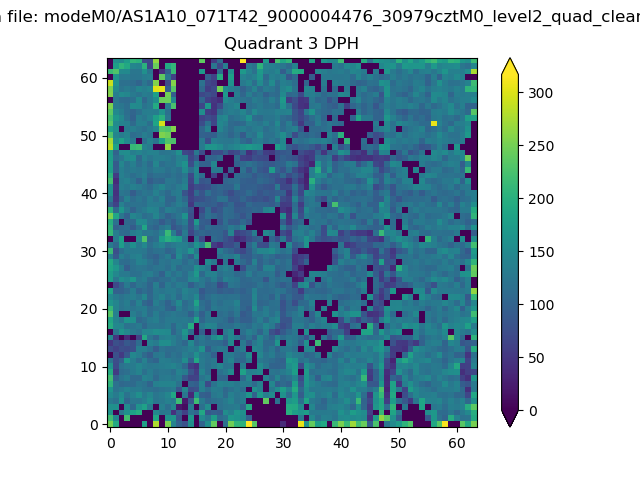 |
 |
Quadrant C |
| Plot type | Count rate plots | Images |
|---|---|---|
| Comparison with Poisson distribution Blue bars denote a histogram of data divided into 1 sec bins. Red curve is a Poisson curve with rate = median count rate of data. |
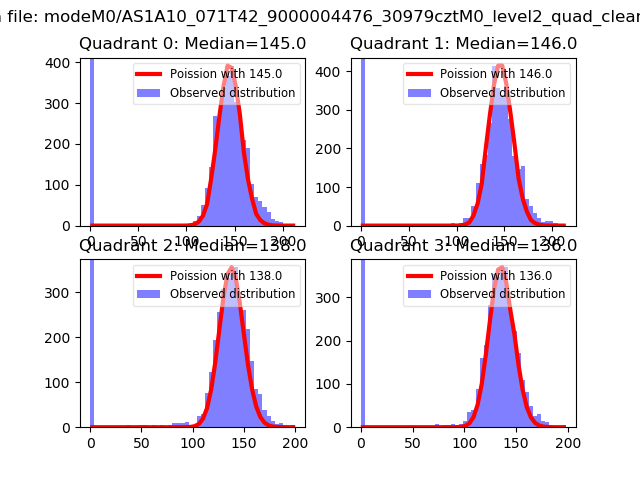 |
 |
| Quadrant-wise count rates Data is divided into 100 sec bins |
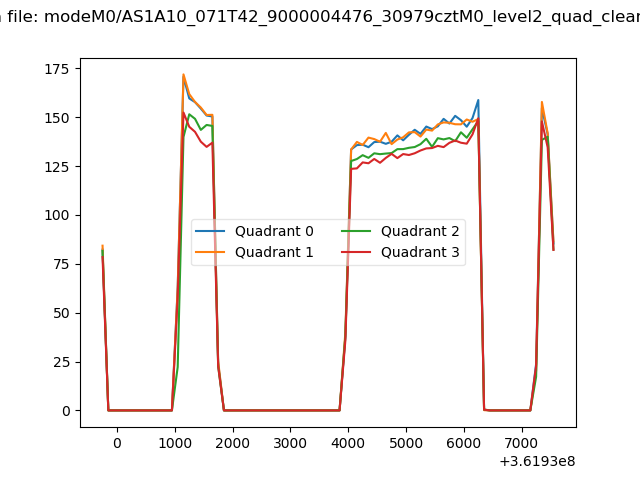 |
|
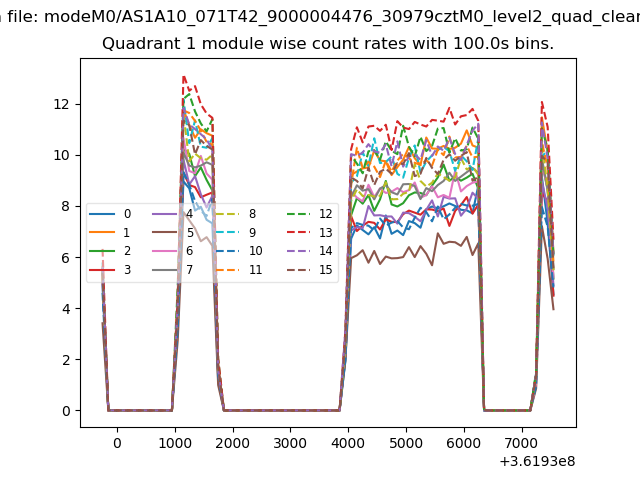
| Module-wise count rates for Quadrant A Data is divided into 100 sec bins |
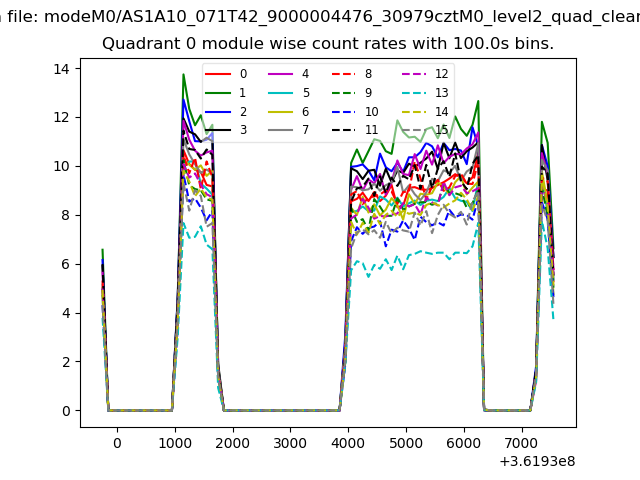 |
 |
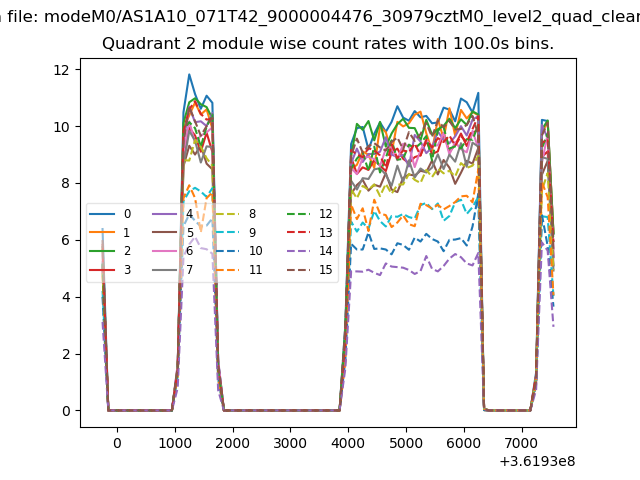
| Module-wise count rates for Quadrant B Data is divided into 100 sec bins |
 |
 |
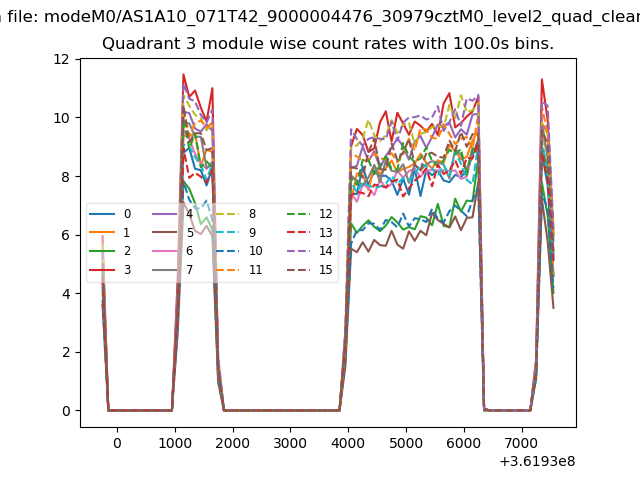
| Module-wise count rates for Quadrant C Data is divided into 100 sec bins |
 |
 |
| Module-wise count rates for Quadrant D Data is divided into 100 sec bins |
 |
 |
| Parameter | Plot |
|---|---|
| CZT HV Monitor | 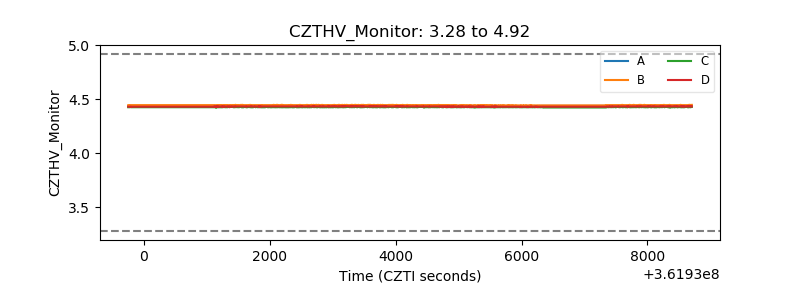 |
| D_VDD | 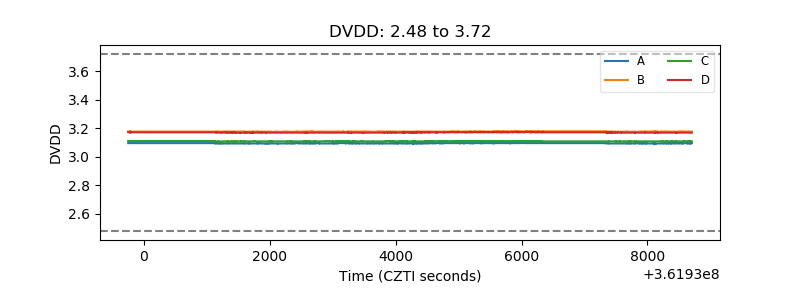 |
| Temperature 1 | 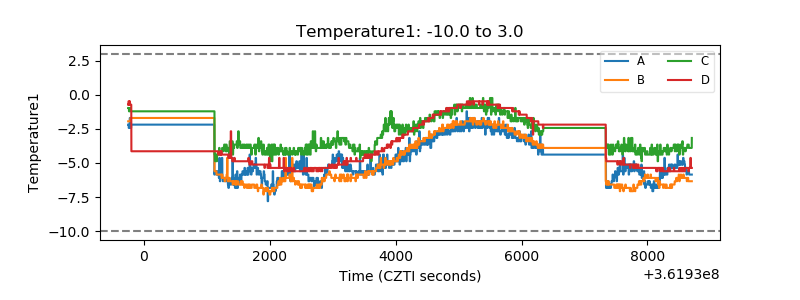 |
| Veto HV Monitor | 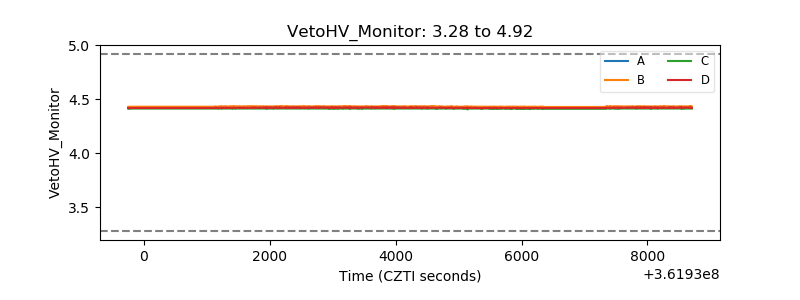 |
| Veto LLD |  |
| Alpha Counter |  |
| _CPM_Rate | 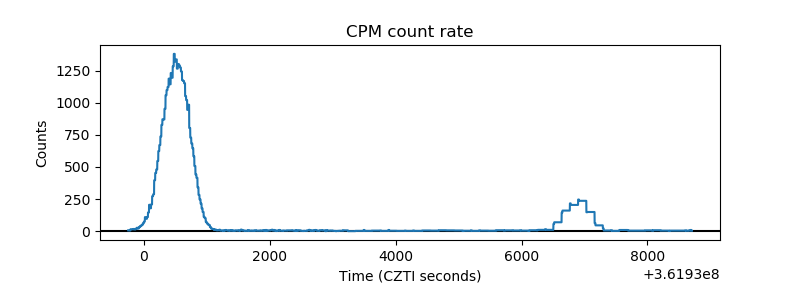 |
| CZT Counter | 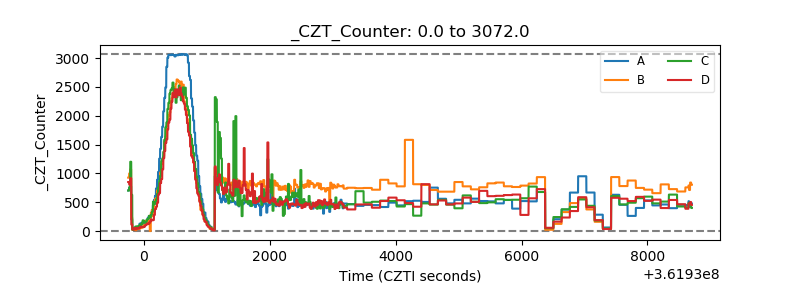 |
| +2.5 Volts monitor |  |
| +5 Volts monitor |  |
| _ROLL_ROT | 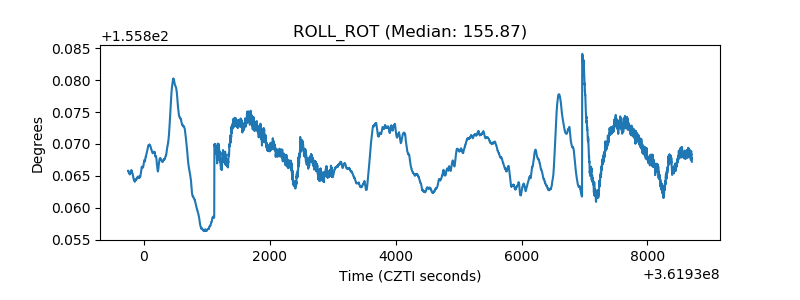 |
| _Roll_DEC | 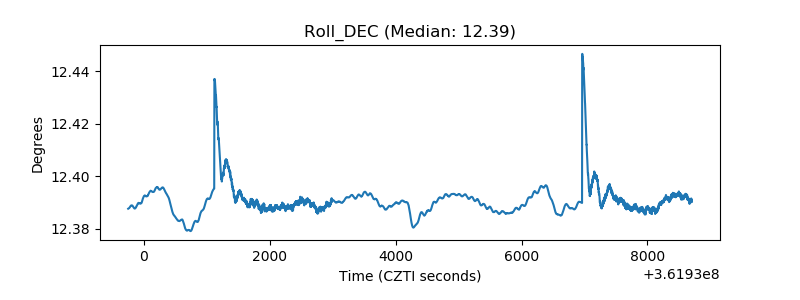 |
| _Roll_RA | 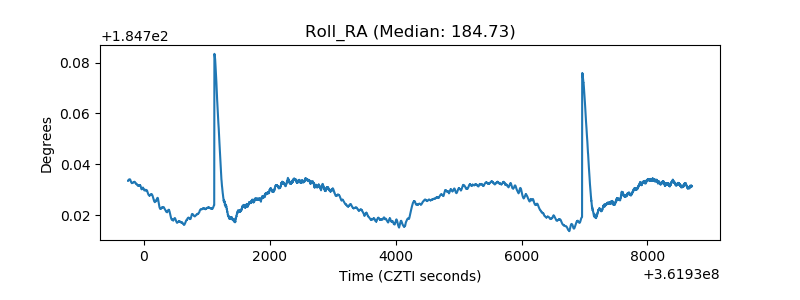 |
| Veto Counter | 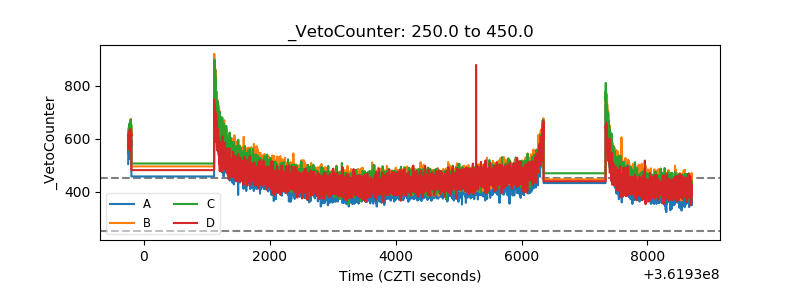 |