| Param | Original file | Final file |
|---|---|---|
| Filename | modeM0/AS1A10_071T42_9000004476_30980cztM0_level2.evt | modeM0/AS1A10_071T42_9000004476_30980cztM0_level2_quad_clean.evt |
| Size (bytes) | 587,393,280 | 76,129,920 |
| Size | 560.2 MB | 72.6 MB |
| Events in quadrant A | 3,550,504 | 462,207 |
| Events in quadrant B | 5,684,710 | 460,285 |
| Events in quadrant C | 4,141,963 | 442,613 |
| Events in quadrant D | 3,921,071 | 435,251 |
| Mode SS | |||
|---|---|---|---|
| Quadrant | BADHDUFLAG | Total packets | Discarded packets |
| A | 0 | 148 | 0 |
| B | 0 | 148 | 0 |
| C | 0 | 148 | 0 |
| D | 0 | 148 | 0 |
| Mode M0 | |||
|---|---|---|---|
| Quadrant | BADHDUFLAG | Total packets | Discarded packets |
| A | 0 | 15049 | 1 |
| B | 0 | 22140 | 1 |
| C | 0 | 16688 | 1 |
| D | 0 | 16206 | 1 |
| Mode M9 | |||
|---|---|---|---|
| Quadrant | BADHDUFLAG | Total packets | Discarded packets |
| A | 0 | 4 | 0 |
| B | 0 | 4 | 0 |
| C | 0 | 4 | 0 |
| D | 0 | 4 | 0 |
| Quadrant | Total seconds | Saturated seconds | Saturation percentage |
|---|---|---|---|
| A | 7246 | 164 | 2.263318% |
| B | 7246 | 257 | 3.546784% |
| C | 7245 | 277 | 3.823326% |
| D | 7245 | 148 | 2.042788% |
Noise dominated data is calculated using 1-second bins in cleaned event files. If a bin has >2000 counts, and if more than 50% of those come from <1% of pixels, then it is considered to be noise-dominated and hence unusable.
| Quadrant | # 1 sec bins | Bins with >0 counts | Bins with >2000 counts | High rate bins dominated by noise | Noise dominated (total time) | Noise dominated (detector-on time) | Marked lightcurve |
|---|---|---|---|---|---|---|---|
| A | 7661 | 7246 | 0 | 0 | 0.00% | 0.00% |  |
| B | 7661 | 7246 | 7 | 7 | 0.09% | 0.10% |  |
| C | 7660 | 7245 | 36 | 36 | 0.47% | 0.50% |  |
| D | 7660 | 7245 | 27 | 27 | 0.35% | 0.37% |  |
Top three noisy pixels from each quadrant. If the there are fewer than three noisy pixels in the level2.evt file, extra rows are filled as -1
| Pixel properties | Quadrant properties | ||||||
|---|---|---|---|---|---|---|---|
| Quadrant | DetID | PixID | Counts | Sigma | Mean | Median | Sigma |
| A | 13 | 254 | 12854 | 63.96 | 919 | 897 | 186.9 |
| A | 3 | 137 | 9397 | 45.47 | 919 | 897 | 186.9 |
| A | 0 | 226 | 7744 | 36.63 | 919 | 897 | 186.9 |
| B | 6 | 159 | 1991466 | 11211.56 | 907 | 883 | 177.5 |
| B | 0 | 190 | 38603 | 212.45 | 907 | 883 | 177.5 |
| B | 4 | 52 | 25284 | 137.43 | 907 | 883 | 177.5 |
| C | 0 | 10 | 551145 | 2647.64 | 873 | 877 | 207.8 |
| C | 14 | 238 | 139006 | 664.61 | 873 | 877 | 207.8 |
| C | 2 | 114 | 16805 | 76.64 | 873 | 877 | 207.8 |
| D | 8 | 195 | 411518 | 1919.22 | 882 | 857 | 214.0 |
| D | 2 | 250 | 95012 | 440.03 | 882 | 857 | 214.0 |
| D | 7 | 238 | 30464 | 138.37 | 882 | 857 | 214.0 |
Histogram calculated using DETX and DETY for each event in the final _common_clean file
| Quadrant A |  |
 |
Quadrant B |
|---|---|---|---|
| Quadrant D |  |
 |
Quadrant C |
| Plot type | Count rate plots | Images |
|---|---|---|
| Comparison with Poisson distribution Blue bars denote a histogram of data divided into 1 sec bins. Red curve is a Poisson curve with rate = median count rate of data. |
 |
 |
| Quadrant-wise count rates Data is divided into 100 sec bins |
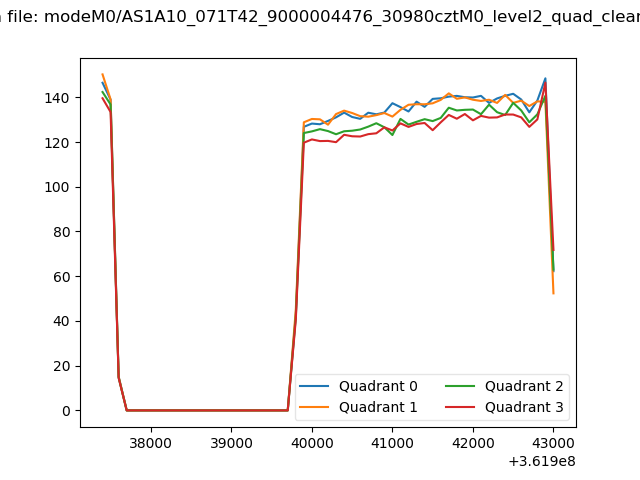 |
|
| Module-wise count rates for Quadrant A Data is divided into 100 sec bins |
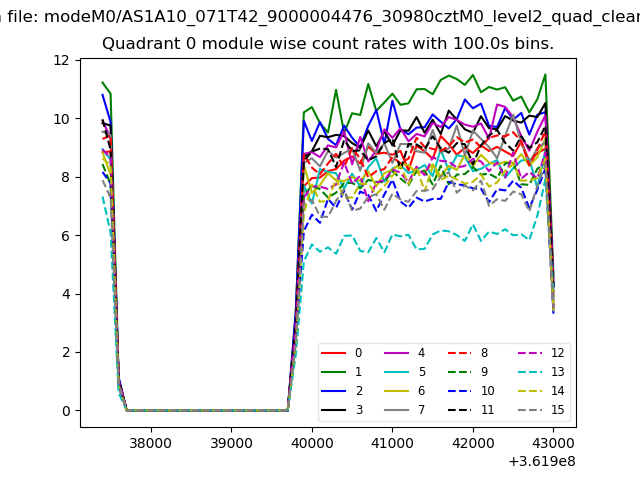 |
 |
| Module-wise count rates for Quadrant B Data is divided into 100 sec bins |
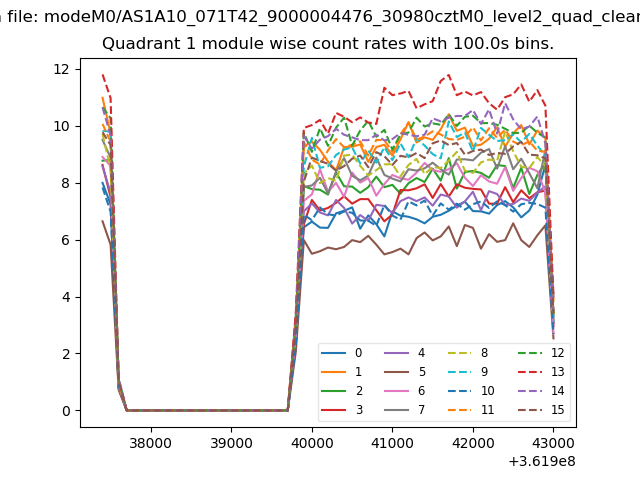 |
 |
| Module-wise count rates for Quadrant C Data is divided into 100 sec bins |
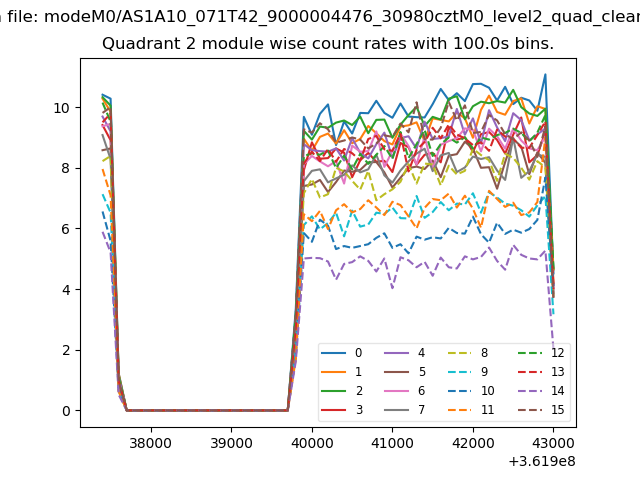 |
 |
| Module-wise count rates for Quadrant D Data is divided into 100 sec bins |
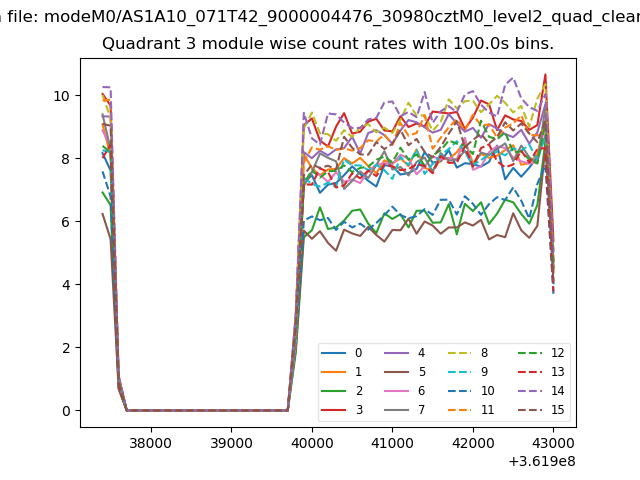 |
 |
| Parameter | Plot |
|---|---|
| CZT HV Monitor | 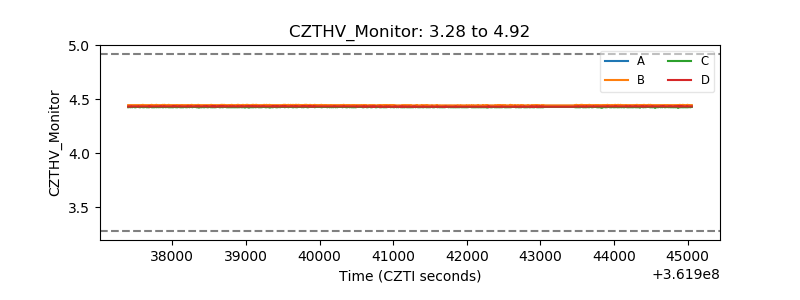 |
| D_VDD |  |
| Temperature 1 |  |
| Veto HV Monitor | 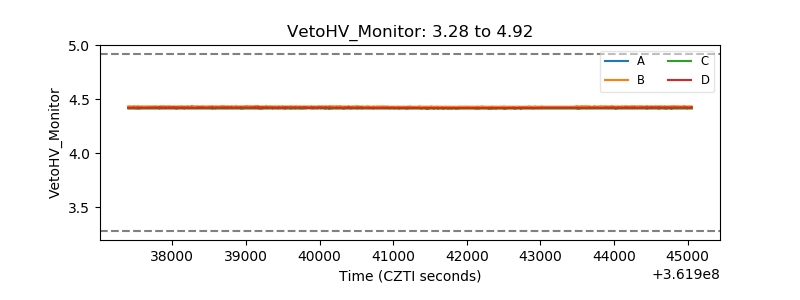 |
| Veto LLD |  |
| Alpha Counter | 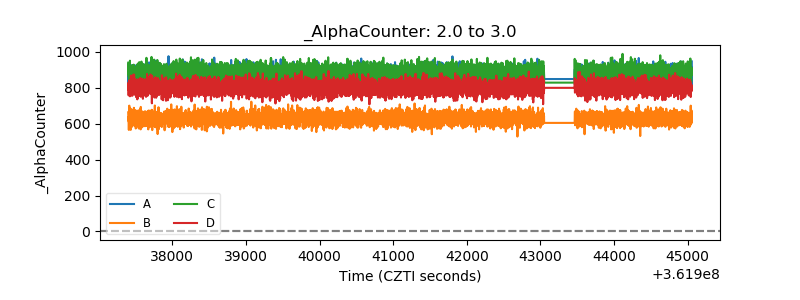 |
| _CPM_Rate | 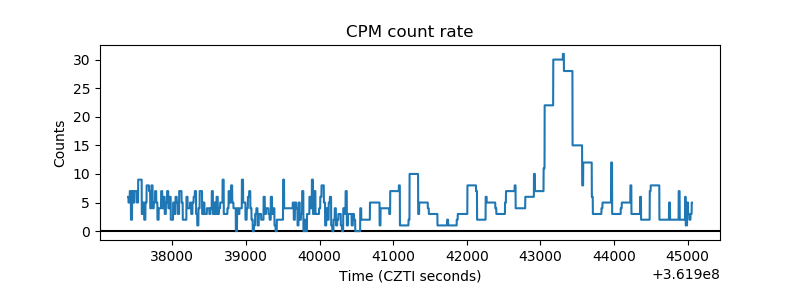 |
| CZT Counter |  |
| +2.5 Volts monitor |  |
| +5 Volts monitor |  |
| _ROLL_ROT | 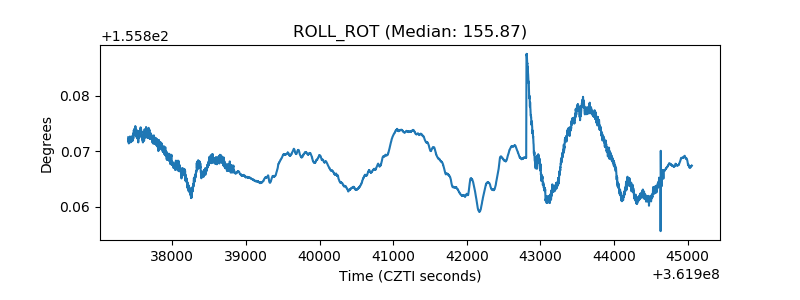 |
| _Roll_DEC | 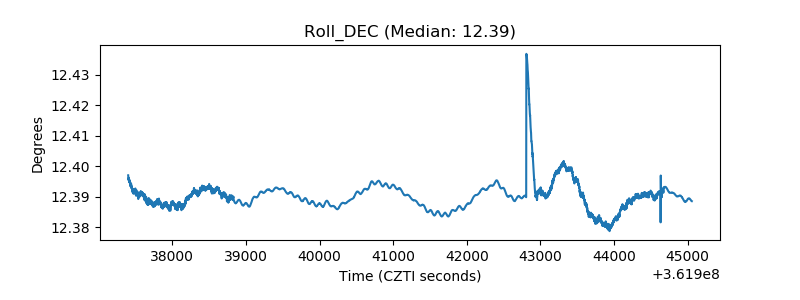 |
| _Roll_RA |  |
| Veto Counter | 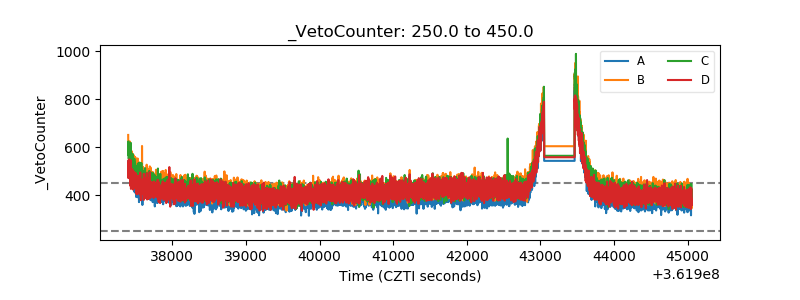 |