| Param | Original file | Final file |
|---|---|---|
| Filename | modeM0/AS1A10_071T42_9000004476_30981cztM0_level2.evt | modeM0/AS1A10_071T42_9000004476_30981cztM0_level2_quad_clean.evt |
| Size (bytes) | 671,371,200 | 81,645,120 |
| Size | 640.3 MB | 77.9 MB |
| Events in quadrant A | 4,057,007 | 487,887 |
| Events in quadrant B | 6,420,830 | 486,464 |
| Events in quadrant C | 4,793,778 | 466,013 |
| Events in quadrant D | 4,506,886 | 463,458 |
| Mode SS | |||
|---|---|---|---|
| Quadrant | BADHDUFLAG | Total packets | Discarded packets |
| A | 0 | 166 | 0 |
| B | 0 | 166 | 0 |
| C | 0 | 166 | 0 |
| D | 0 | 166 | 0 |
| Mode M0 | |||
|---|---|---|---|
| Quadrant | BADHDUFLAG | Total packets | Discarded packets |
| A | 0 | 17245 | 2 |
| B | 0 | 25145 | 2 |
| C | 0 | 19309 | 2 |
| D | 0 | 18562 | 2 |
| Mode M9 | |||
|---|---|---|---|
| Quadrant | BADHDUFLAG | Total packets | Discarded packets |
| A | 0 | 4 | 0 |
| B | 0 | 4 | 0 |
| C | 0 | 4 | 0 |
| D | 0 | 4 | 0 |
| Quadrant | Total seconds | Saturated seconds | Saturation percentage |
|---|---|---|---|
| A | 8177 | 383 | 4.683869% |
| B | 8177 | 540 | 6.603889% |
| C | 8177 | 489 | 5.980188% |
| D | 8177 | 291 | 3.558762% |
Noise dominated data is calculated using 1-second bins in cleaned event files. If a bin has >2000 counts, and if more than 50% of those come from <1% of pixels, then it is considered to be noise-dominated and hence unusable.
| Quadrant | # 1 sec bins | Bins with >0 counts | Bins with >2000 counts | High rate bins dominated by noise | Noise dominated (total time) | Noise dominated (detector-on time) | Marked lightcurve |
|---|---|---|---|---|---|---|---|
| A | 8647 | 8177 | 0 | 0 | 0.00% | 0.00% | 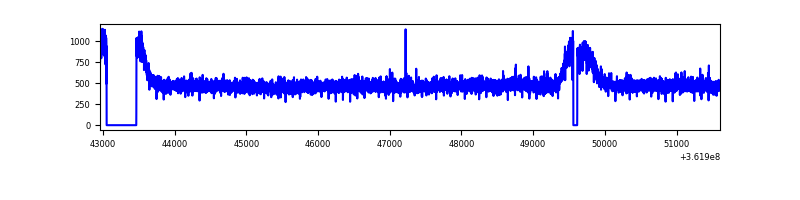 |
| B | 8647 | 8178 | 2 | 2 | 0.02% | 0.02% | 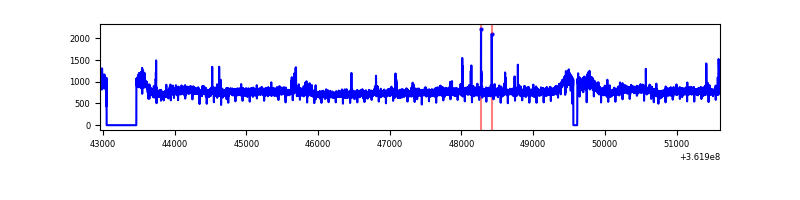 |
| C | 8647 | 8178 | 25 | 25 | 0.29% | 0.31% | 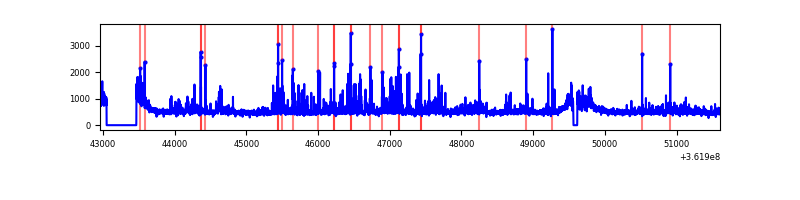 |
| D | 8647 | 8178 | 15 | 15 | 0.17% | 0.18% | 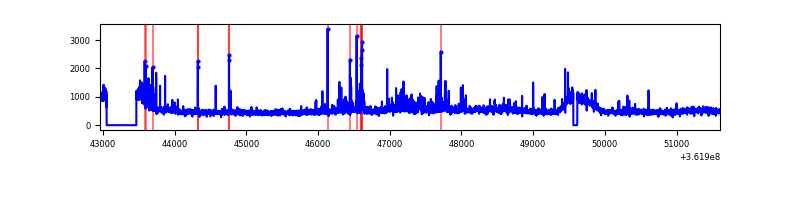 |
Top three noisy pixels from each quadrant. If the there are fewer than three noisy pixels in the level2.evt file, extra rows are filled as -1
| Pixel properties | Quadrant properties | ||||||
|---|---|---|---|---|---|---|---|
| Quadrant | DetID | PixID | Counts | Sigma | Mean | Median | Sigma |
| A | 13 | 254 | 13691 | 58.78 | 1051 | 1025 | 215.5 |
| A | 3 | 137 | 11406 | 48.18 | 1051 | 1025 | 215.5 |
| A | 0 | 226 | 8768 | 35.94 | 1051 | 1025 | 215.5 |
| B | 6 | 159 | 2256717 | 11020.02 | 1032 | 1002 | 204.7 |
| B | 0 | 190 | 52918 | 253.63 | 1032 | 1002 | 204.7 |
| B | 12 | 111 | 25735 | 120.83 | 1032 | 1002 | 204.7 |
| C | 0 | 10 | 682941 | 2873.61 | 998 | 1007 | 237.3 |
| C | 14 | 238 | 158521 | 663.75 | 998 | 1007 | 237.3 |
| C | 2 | 114 | 19352 | 77.3 | 998 | 1007 | 237.3 |
| D | 8 | 195 | 504575 | 2072.46 | 1019 | 991 | 243.0 |
| D | 2 | 250 | 108028 | 440.5 | 1019 | 991 | 243.0 |
| D | 2 | 234 | 35347 | 141.39 | 1019 | 991 | 243.0 |
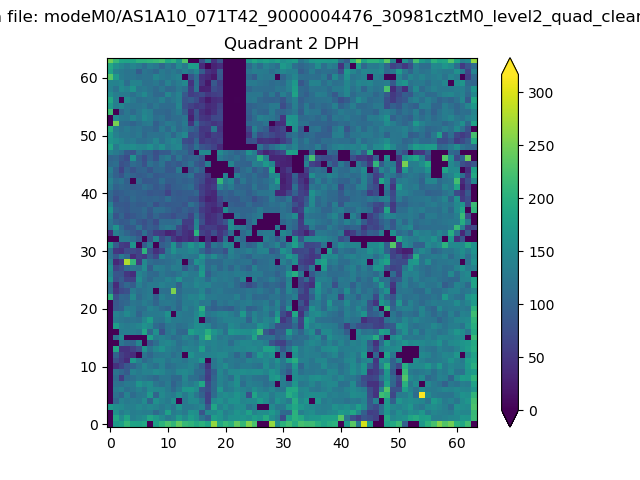
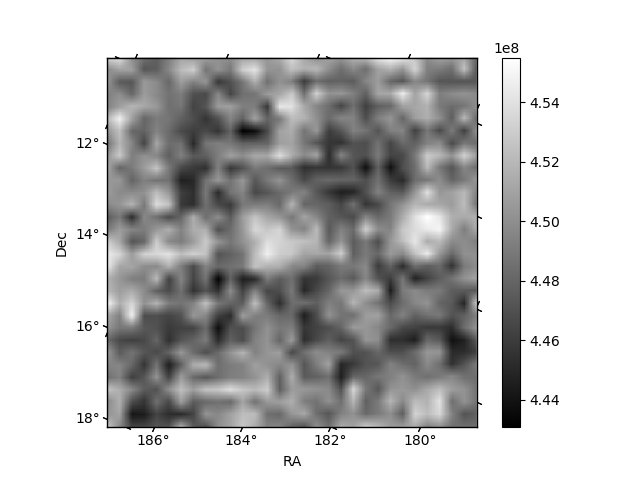
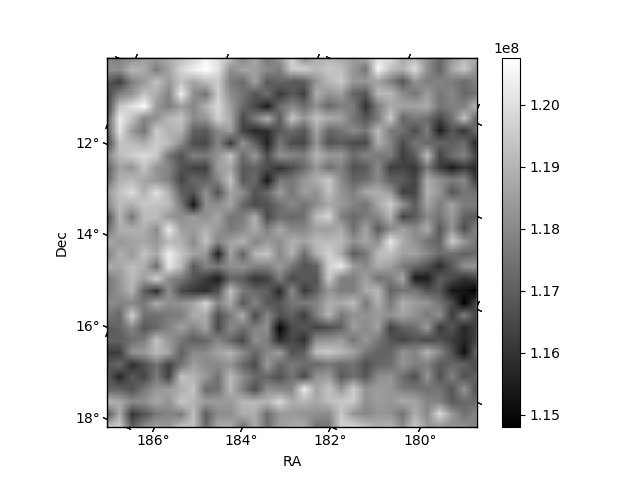
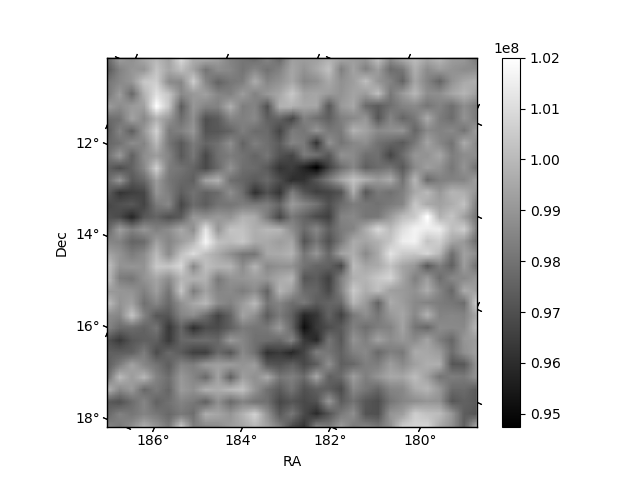
Histogram calculated using DETX and DETY for each event in the final _common_clean file
| Quadrant A | 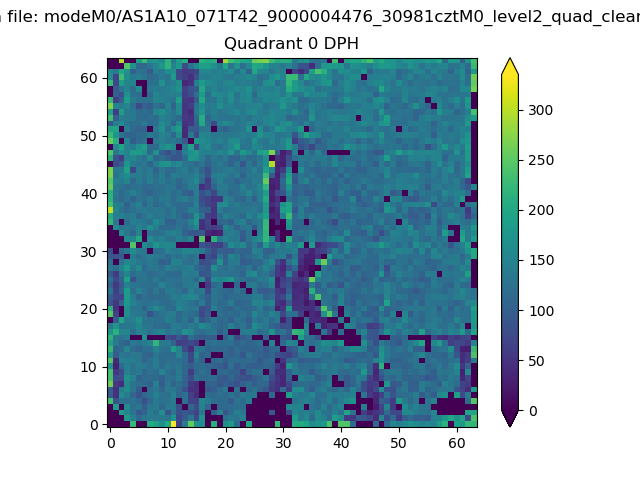 |
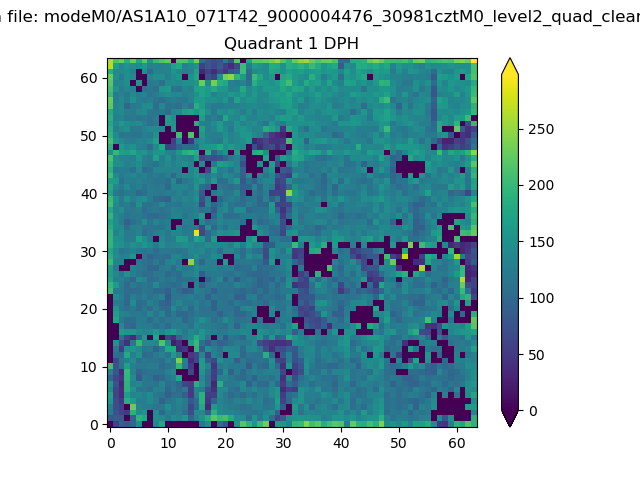 |
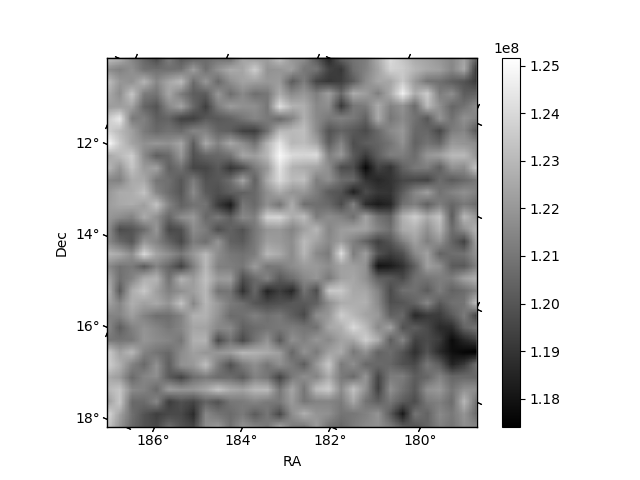
Quadrant B |
|---|---|---|---|
| Quadrant D | 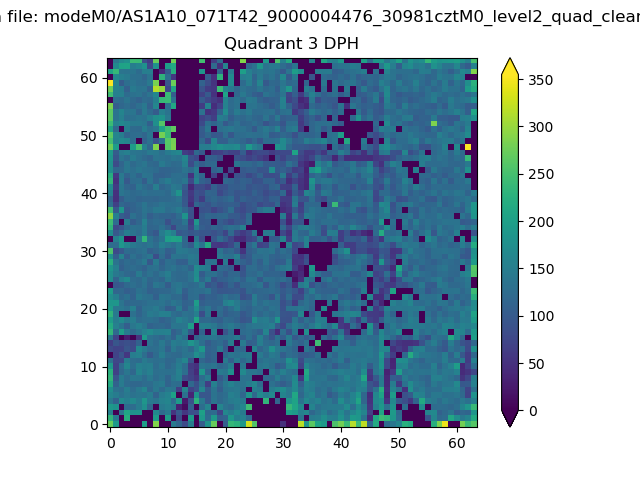 |
 |
Quadrant C |
| Plot type | Count rate plots | Images |
|---|---|---|
| Comparison with Poisson distribution Blue bars denote a histogram of data divided into 1 sec bins. Red curve is a Poisson curve with rate = median count rate of data. |
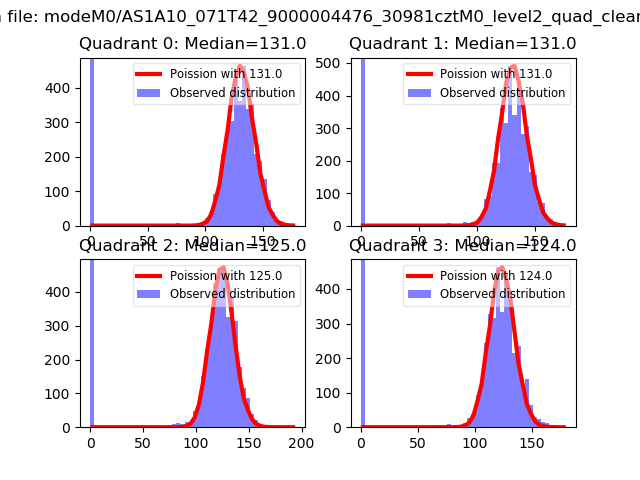 |
 |
| Quadrant-wise count rates Data is divided into 100 sec bins |
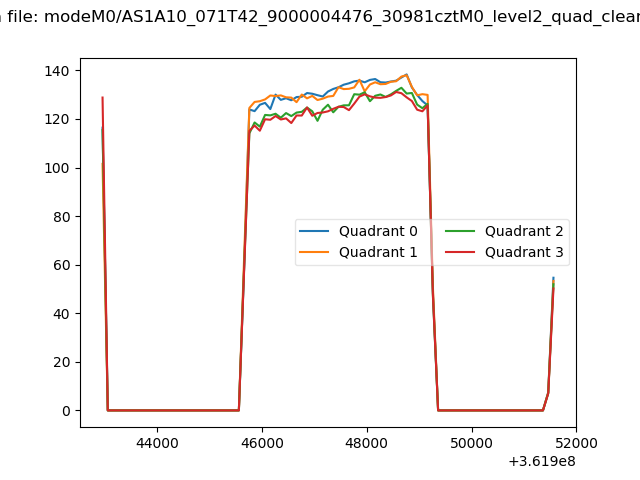 |
|
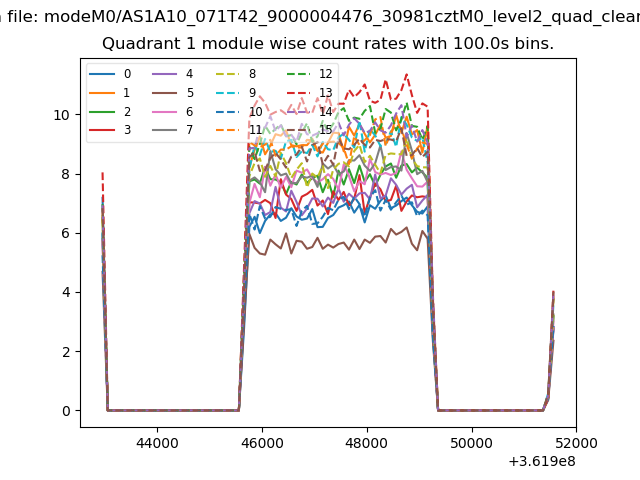
| Module-wise count rates for Quadrant A Data is divided into 100 sec bins |
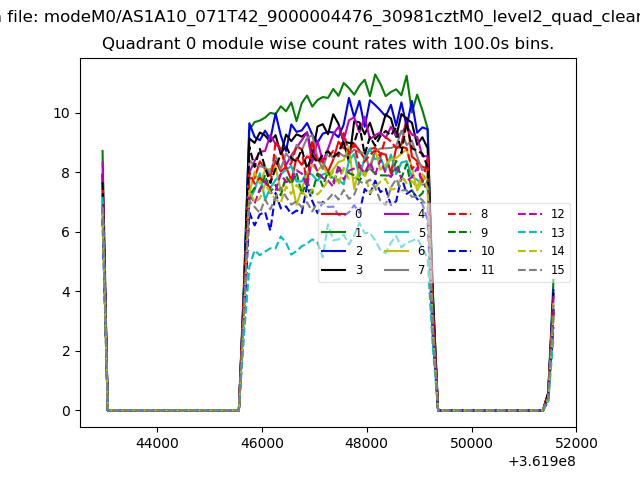 |
 |
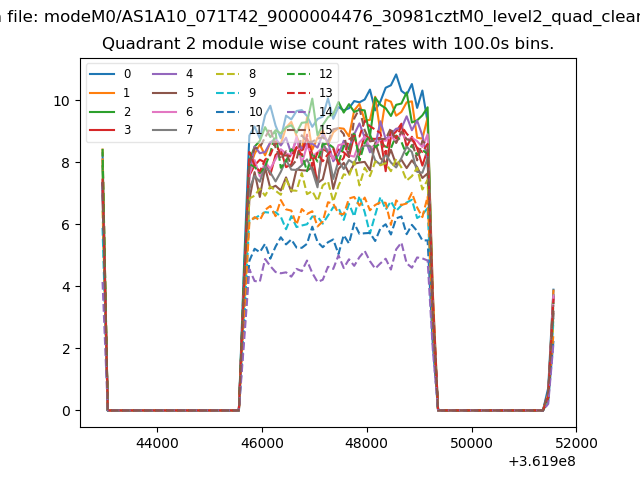
| Module-wise count rates for Quadrant B Data is divided into 100 sec bins |
 |
 |
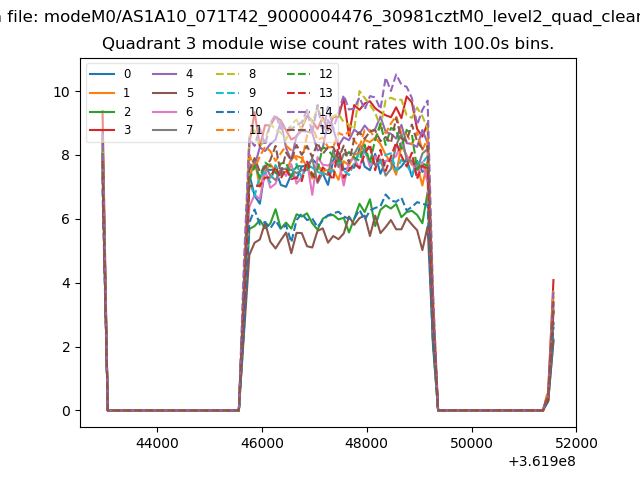
| Module-wise count rates for Quadrant C Data is divided into 100 sec bins |
 |
 |
| Module-wise count rates for Quadrant D Data is divided into 100 sec bins |
 |
 |
| Parameter | Plot |
|---|---|
| CZT HV Monitor | 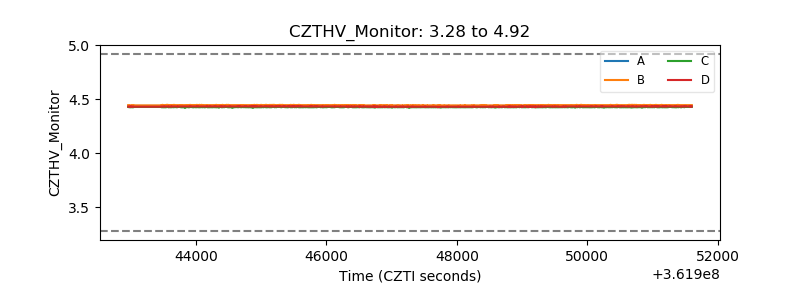 |
| D_VDD | 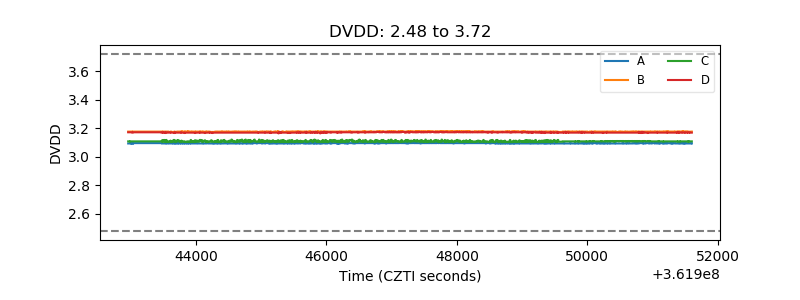 |
| Temperature 1 | 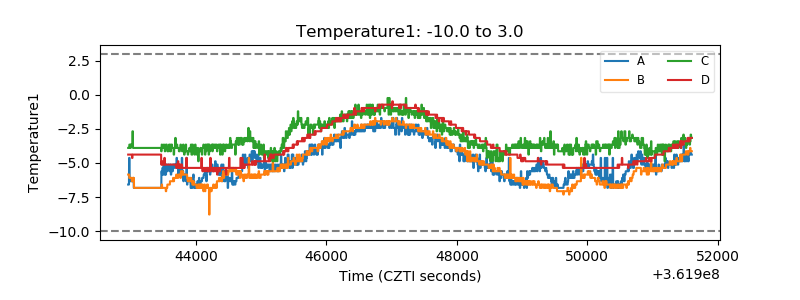 |
| Veto HV Monitor |  |
| Veto LLD | 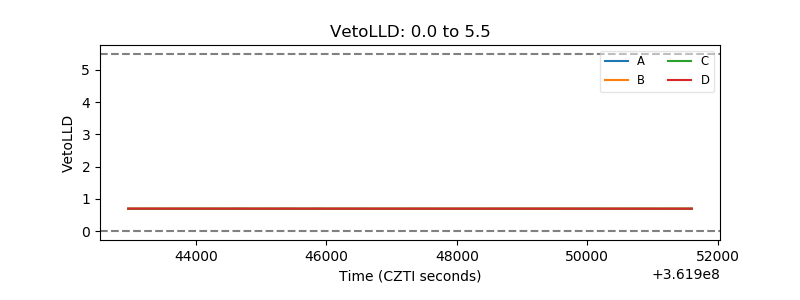 |
| Alpha Counter | 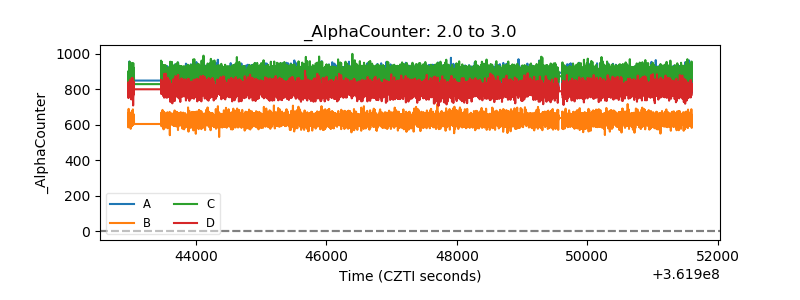 |
| _CPM_Rate | 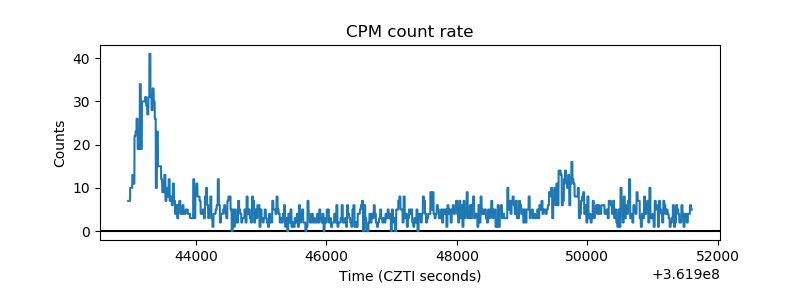 |
| CZT Counter | 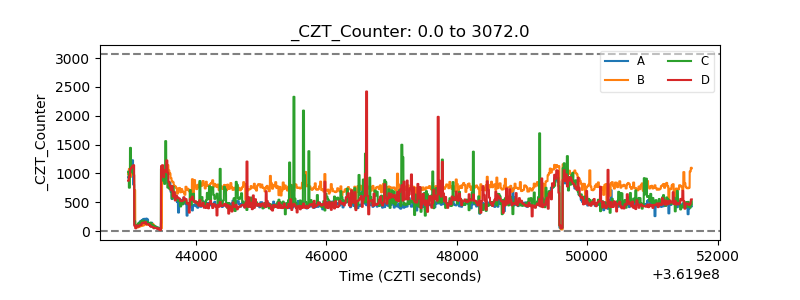 |
| +2.5 Volts monitor |  |
| +5 Volts monitor |  |
| _ROLL_ROT |  |
| _Roll_DEC | 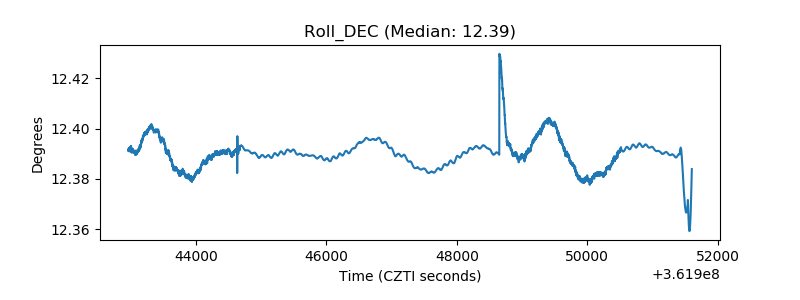 |
| _Roll_RA | 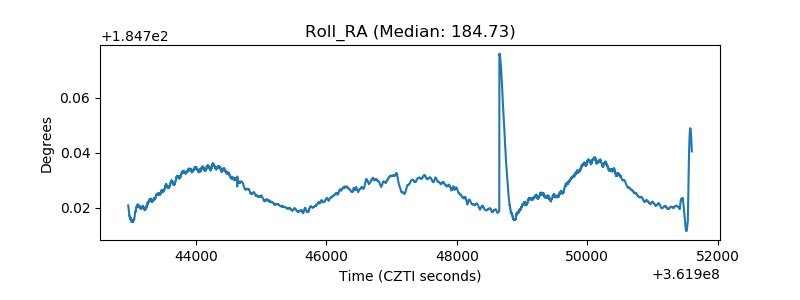 |
| Veto Counter | 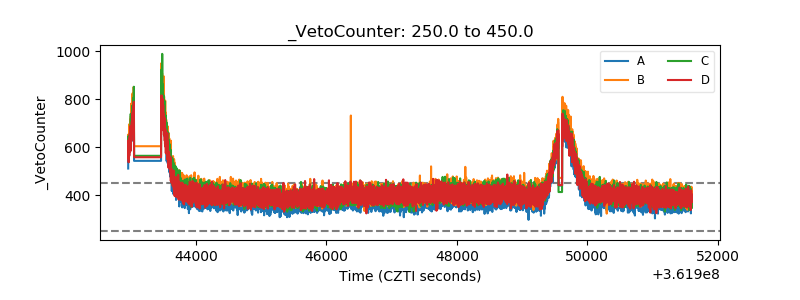 |