| Param | Original file | Final file |
|---|---|---|
| Filename | modeM0/AS1A10_071T42_9000004476_30985cztM0_level2.evt | modeM0/AS1A10_071T42_9000004476_30985cztM0_level2_quad_clean.evt |
| Size (bytes) | 1,507,152,960 | 243,158,400 |
| Size | 1.4 GB | 231.9 MB |
| Events in quadrant A | 8,984,478 | 1,557,378 |
| Events in quadrant B | 14,703,179 | 1,548,206 |
| Events in quadrant C | 10,494,044 | 1,488,248 |
| Events in quadrant D | 10,191,101 | 1,472,425 |
| Mode SS | |||
|---|---|---|---|
| Quadrant | BADHDUFLAG | Total packets | Discarded packets |
| A | 0 | 384 | 0 |
| B | 0 | 384 | 0 |
| C | 0 | 384 | 0 |
| D | 0 | 384 | 0 |
| Mode M0 | |||
|---|---|---|---|
| Quadrant | BADHDUFLAG | Total packets | Discarded packets |
| A | 0 | 38807 | 4 |
| B | 0 | 57680 | 5 |
| C | 0 | 42869 | 4 |
| D | 0 | 41481 | 4 |
| Mode M9 | |||
|---|---|---|---|
| Quadrant | BADHDUFLAG | Total packets | Discarded packets |
| A | 0 | 20 | 0 |
| B | 0 | 20 | 0 |
| C | 0 | 20 | 0 |
| D | 0 | 20 | 0 |
| Quadrant | Total seconds | Saturated seconds | Saturation percentage |
|---|---|---|---|
| A | 18852 | 416 | 2.206662% |
| B | 18851 | 687 | 3.644369% |
| C | 18852 | 718 | 3.808614% |
| D | 18852 | 414 | 2.196053% |
Noise dominated data is calculated using 1-second bins in cleaned event files. If a bin has >2000 counts, and if more than 50% of those come from <1% of pixels, then it is considered to be noise-dominated and hence unusable.
| Quadrant | # 1 sec bins | Bins with >0 counts | Bins with >2000 counts | High rate bins dominated by noise | Noise dominated (total time) | Noise dominated (detector-on time) | Marked lightcurve |
|---|---|---|---|---|---|---|---|
| A | 20827 | 18852 | 0 | 0 | 0.00% | 0.00% | 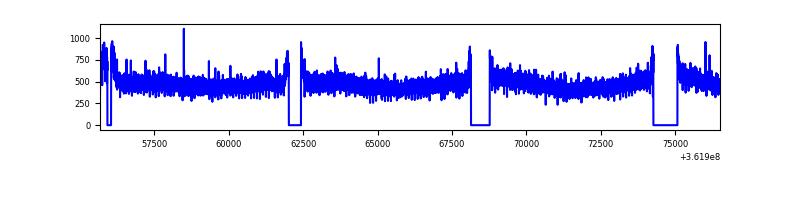 |
| B | 20826 | 18851 | 42 | 42 | 0.20% | 0.22% | 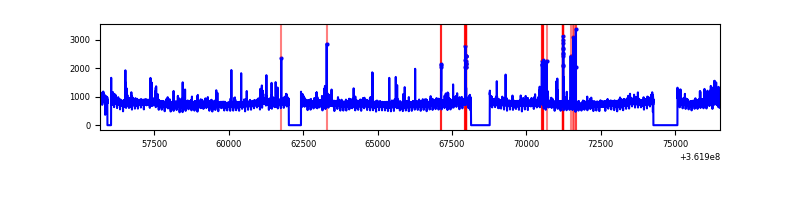 |
| C | 20827 | 18852 | 67 | 67 | 0.32% | 0.36% | 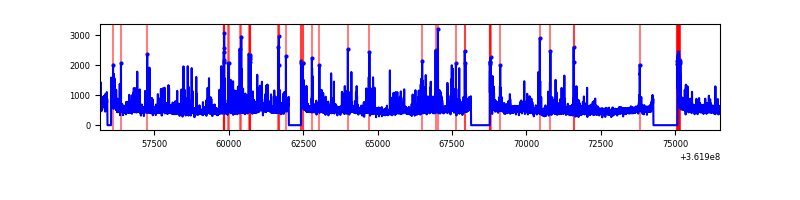 |
| D | 20827 | 18852 | 74 | 74 | 0.36% | 0.39% | 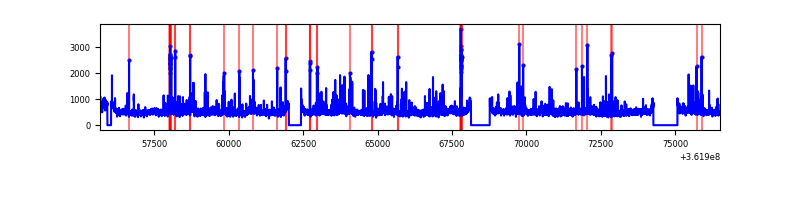 |
Top three noisy pixels from each quadrant. If the there are fewer than three noisy pixels in the level2.evt file, extra rows are filled as -1
| Pixel properties | Quadrant properties | ||||||
|---|---|---|---|---|---|---|---|
| Quadrant | DetID | PixID | Counts | Sigma | Mean | Median | Sigma |
| A | 13 | 254 | 33121 | 66.1 | 2325 | 2277 | 466.6 |
| A | 3 | 137 | 23980 | 46.51 | 2325 | 2277 | 466.6 |
| A | 0 | 226 | 19770 | 37.49 | 2325 | 2277 | 466.6 |
| B | 6 | 159 | 5177121 | 11701.69 | 2286 | 2226 | 442.2 |
| B | 0 | 190 | 122856 | 272.77 | 2286 | 2226 | 442.2 |
| B | 5 | 172 | 112437 | 249.21 | 2286 | 2226 | 442.2 |
| C | 0 | 10 | 1195289 | 2272.98 | 2219 | 2230 | 524.9 |
| C | 14 | 238 | 352617 | 667.55 | 2219 | 2230 | 524.9 |
| C | 14 | 67 | 132152 | 247.52 | 2219 | 2230 | 524.9 |
| D | 8 | 195 | 1052401 | 1955.72 | 2256 | 2193 | 537.0 |
| D | 2 | 250 | 239502 | 441.92 | 2256 | 2193 | 537.0 |
| D | 7 | 238 | 137553 | 252.07 | 2256 | 2193 | 537.0 |
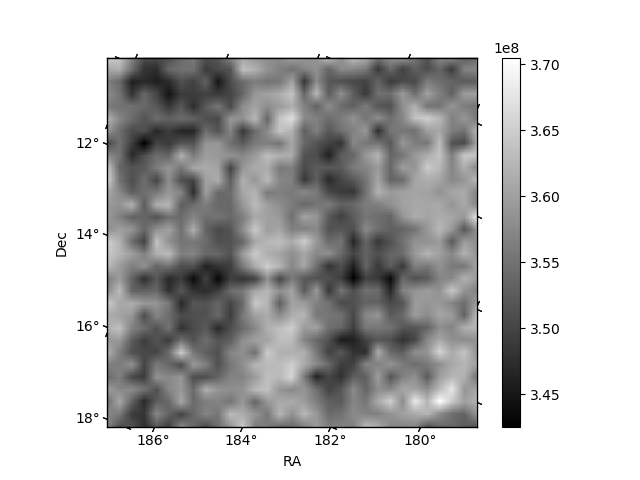
Histogram calculated using DETX and DETY for each event in the final _common_clean file
| Quadrant A | 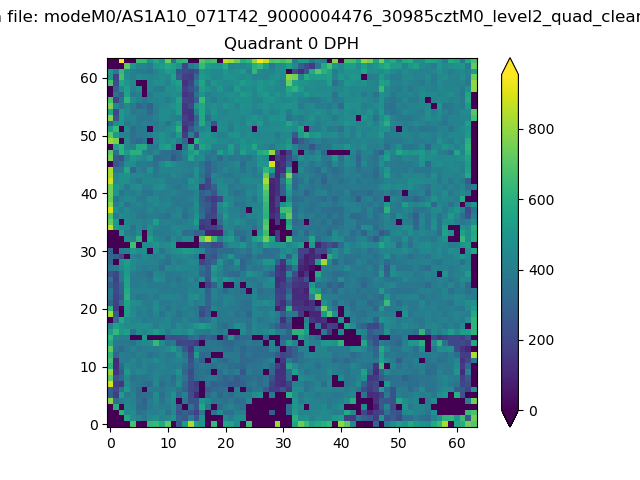 |
 |
Quadrant B |
|---|---|---|---|
| Quadrant D | 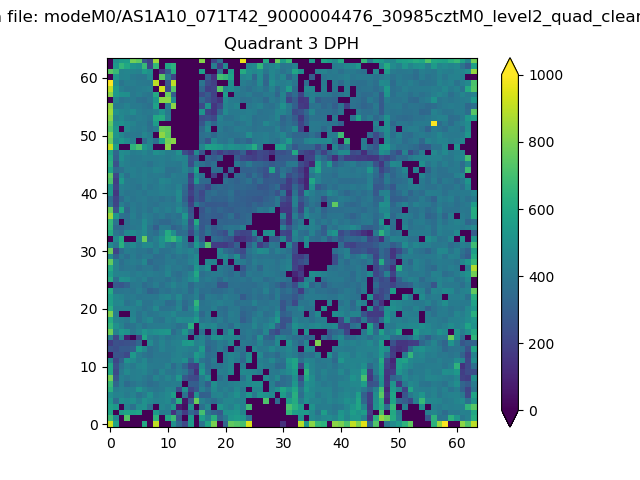 |
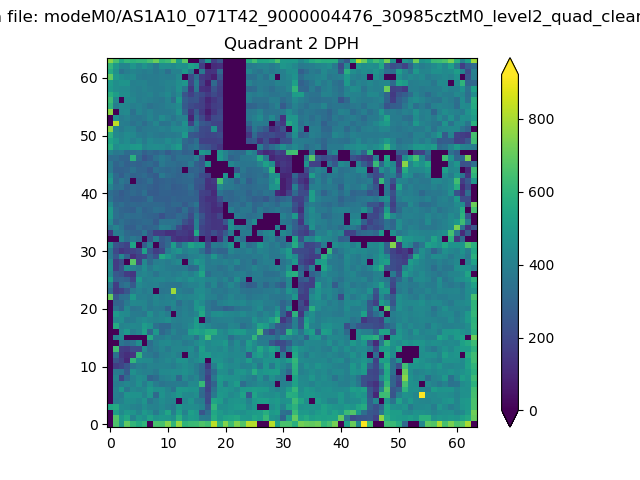 |
Quadrant C |
| Plot type | Count rate plots | Images |
|---|---|---|
| Comparison with Poisson distribution Blue bars denote a histogram of data divided into 1 sec bins. Red curve is a Poisson curve with rate = median count rate of data. |
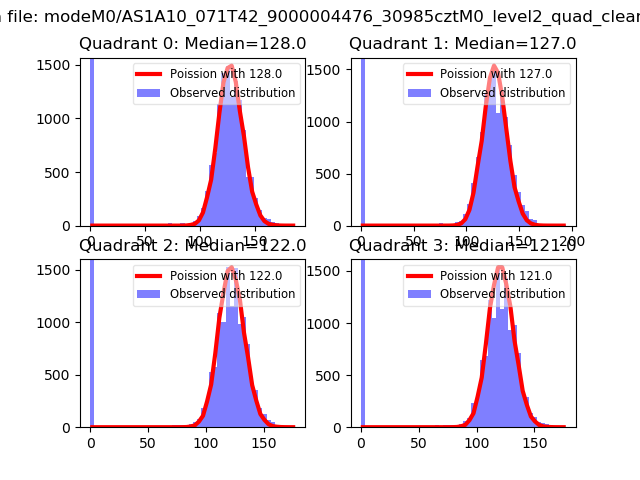 |
 |
| Quadrant-wise count rates Data is divided into 100 sec bins |
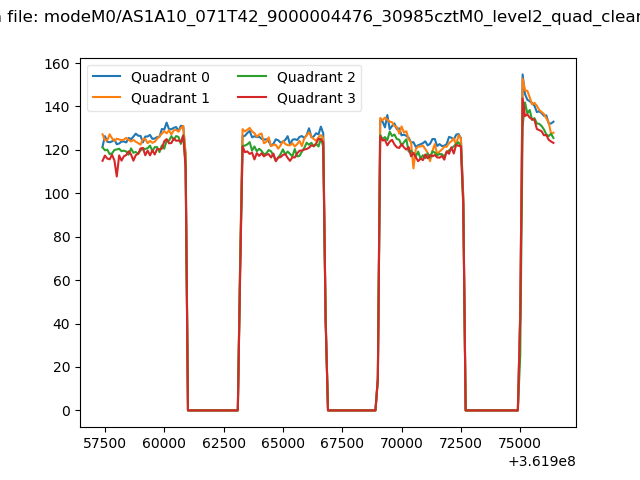 |
|
| Module-wise count rates for Quadrant A Data is divided into 100 sec bins |
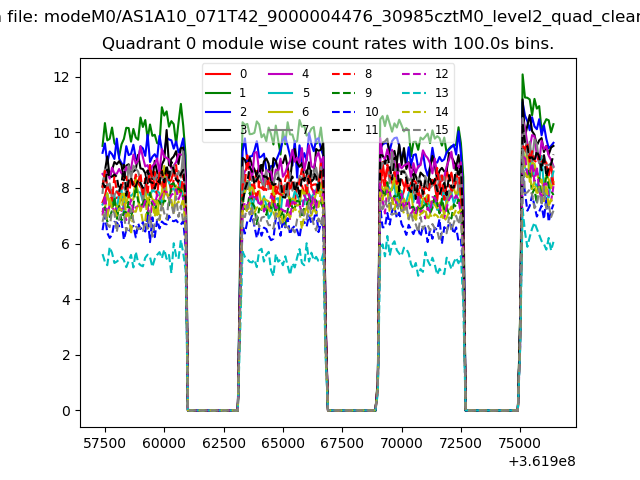 |
 |
| Module-wise count rates for Quadrant B Data is divided into 100 sec bins |
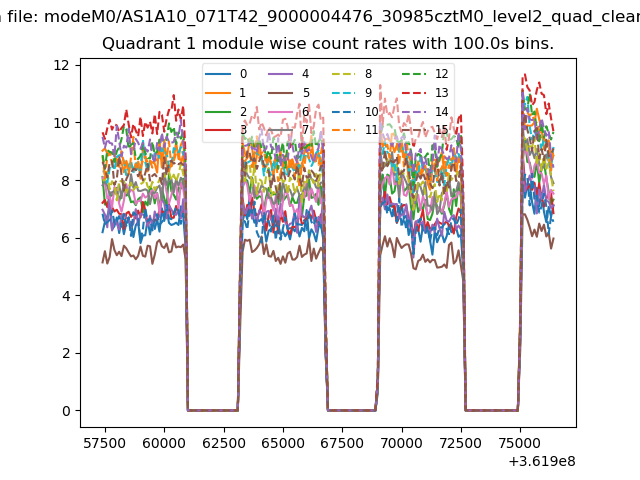 |
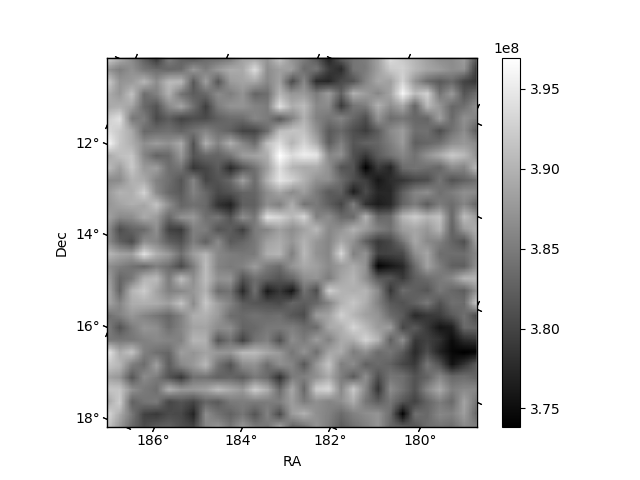 |
| Module-wise count rates for Quadrant C Data is divided into 100 sec bins |
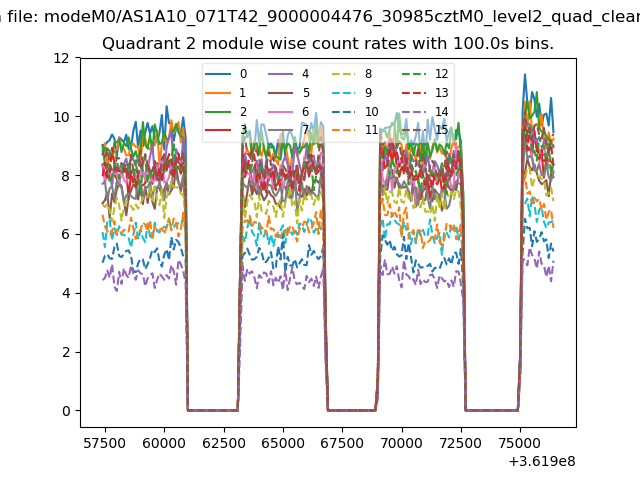 |
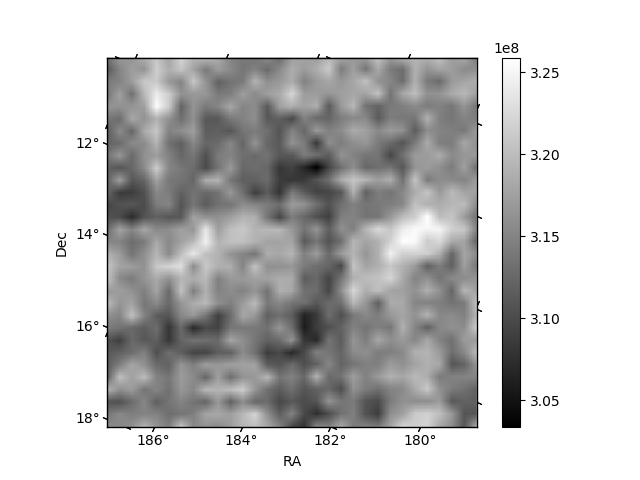 |
| Module-wise count rates for Quadrant D Data is divided into 100 sec bins |
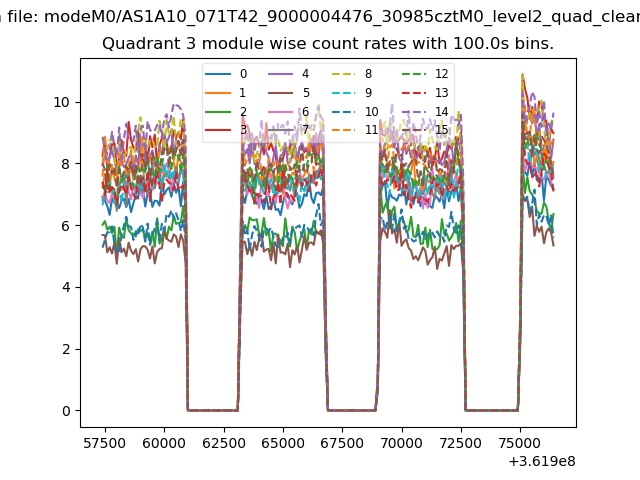 |
 |
| Parameter | Plot |
|---|---|
| CZT HV Monitor | 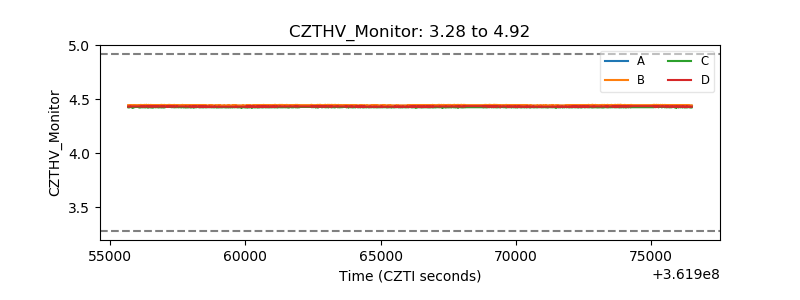 |
| D_VDD | 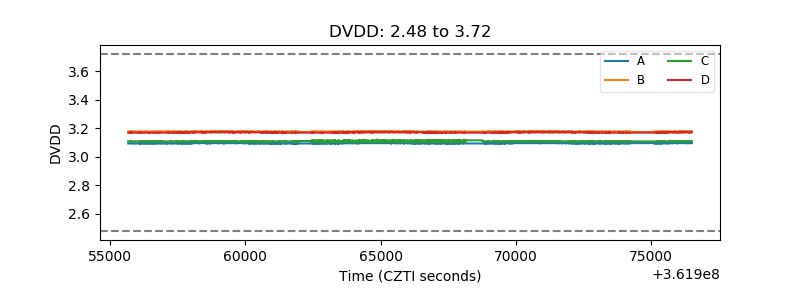 |
| Temperature 1 | 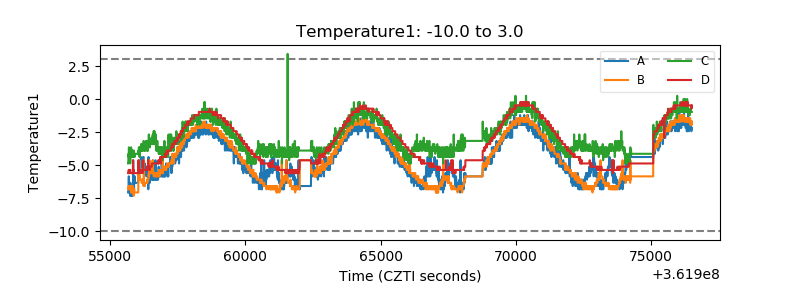 |
| Veto HV Monitor | 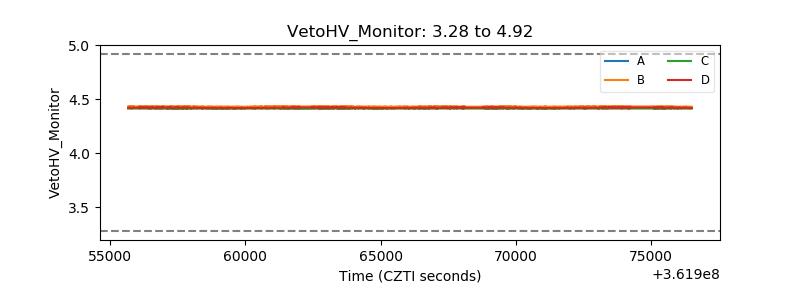 |
| Veto LLD |  |
| Alpha Counter | 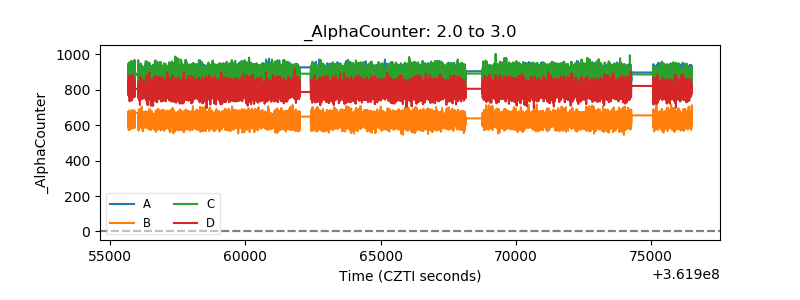 |
| _CPM_Rate | 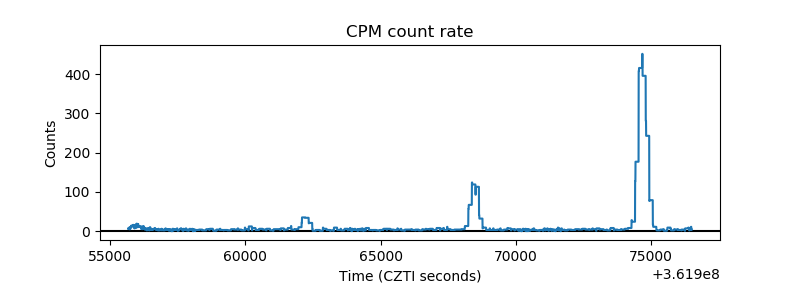 |
| CZT Counter | 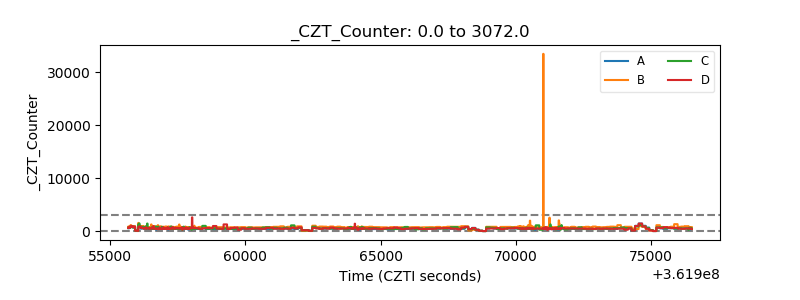 |
| +2.5 Volts monitor |  |
| +5 Volts monitor |  |
| _ROLL_ROT | 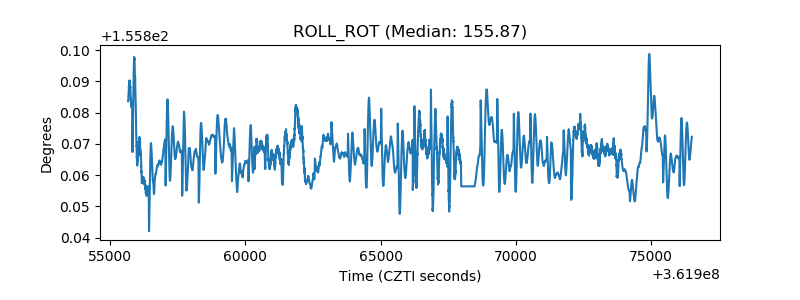 |
| _Roll_DEC | 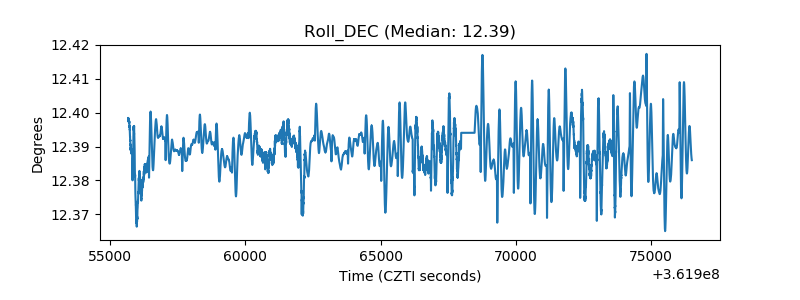 |
| _Roll_RA |  |
| Veto Counter | 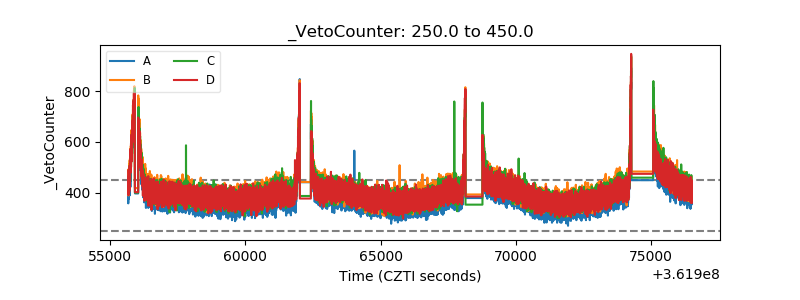 |