| Param | Original file | Final file |
|---|---|---|
| Filename | modeM0/AS1A10_071T42_9000004476_30986cztM0_level2.evt | modeM0/AS1A10_071T42_9000004476_30986cztM0_level2_quad_clean.evt |
| Size (bytes) | 529,776,000 | 87,549,120 |
| Size | 505.2 MB | 83.5 MB |
| Events in quadrant A | 2,954,575 | 582,433 |
| Events in quadrant B | 5,612,130 | 545,266 |
| Events in quadrant C | 3,417,071 | 550,808 |
| Events in quadrant D | 3,641,585 | 541,148 |
| Mode SS | |||
|---|---|---|---|
| Quadrant | BADHDUFLAG | Total packets | Discarded packets |
| A | 0 | 124 | 0 |
| B | 0 | 124 | 0 |
| C | 0 | 124 | 0 |
| D | 0 | 126 | 0 |
| Mode M0 | |||
|---|---|---|---|
| Quadrant | BADHDUFLAG | Total packets | Discarded packets |
| A | 0 | 12835 | 1 |
| B | 0 | 21095 | 1 |
| C | 0 | 14001 | 1 |
| D | 0 | 14781 | 1 |
| Mode M9 | |||
|---|---|---|---|
| Quadrant | BADHDUFLAG | Total packets | Discarded packets |
| A | 0 | 10 | 0 |
| B | 0 | 10 | 0 |
| C | 0 | 10 | 0 |
| D | 0 | 10 | 0 |
| Quadrant | Total seconds | Saturated seconds | Saturation percentage |
|---|---|---|---|
| A | 6186 | 57 | 0.921435% |
| B | 6186 | 475 | 7.678629% |
| C | 6186 | 173 | 2.796638% |
| D | 6186 | 171 | 2.764306% |
Noise dominated data is calculated using 1-second bins in cleaned event files. If a bin has >2000 counts, and if more than 50% of those come from <1% of pixels, then it is considered to be noise-dominated and hence unusable.
| Quadrant | # 1 sec bins | Bins with >0 counts | Bins with >2000 counts | High rate bins dominated by noise | Noise dominated (total time) | Noise dominated (detector-on time) | Marked lightcurve |
|---|---|---|---|---|---|---|---|
| A | 7161 | 6186 | 0 | 0 | 0.00% | 0.00% |  |
| B | 7161 | 6186 | 335 | 335 | 4.68% | 5.42% |  |
| C | 7161 | 6186 | 41 | 41 | 0.57% | 0.66% |  |
| D | 7161 | 6186 | 127 | 127 | 1.77% | 2.05% |  |
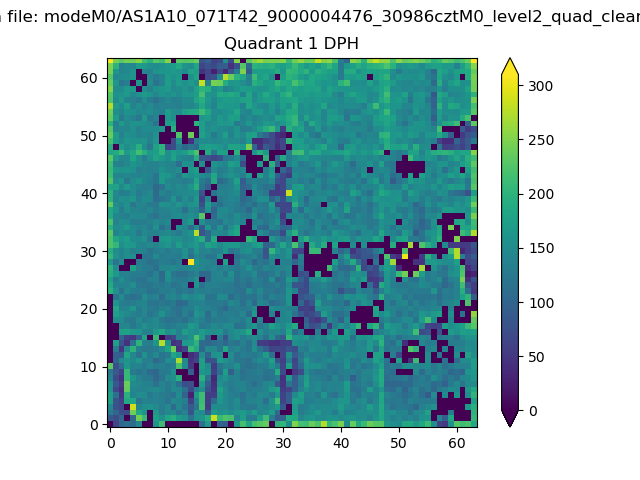
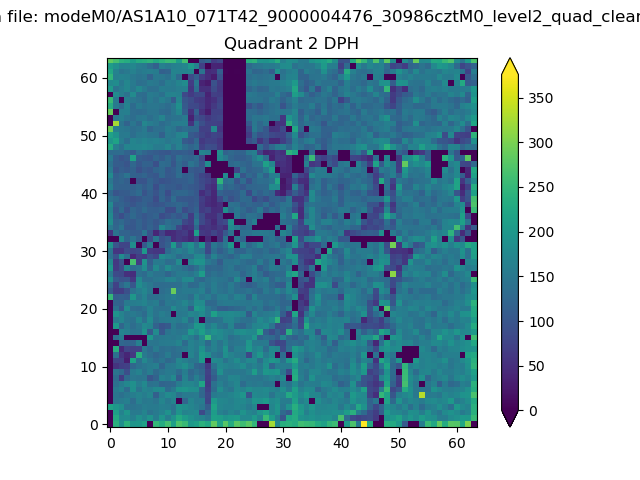
Top three noisy pixels from each quadrant. If the there are fewer than three noisy pixels in the level2.evt file, extra rows are filled as -1
| Pixel properties | Quadrant properties | ||||||
|---|---|---|---|---|---|---|---|
| Quadrant | DetID | PixID | Counts | Sigma | Mean | Median | Sigma |
| A | 13 | 254 | 12548 | 76.78 | 765 | 750 | 153.7 |
| A | 3 | 137 | 7523 | 44.08 | 765 | 750 | 153.7 |
| A | 0 | 226 | 6434 | 36.99 | 765 | 750 | 153.7 |
| B | 6 | 159 | 1722655 | 12216.67 | 728 | 708 | 141.0 |
| B | 5 | 172 | 853273 | 6048.68 | 728 | 708 | 141.0 |
| B | 0 | 190 | 69184 | 485.82 | 728 | 708 | 141.0 |
| C | 0 | 10 | 419336 | 2440.33 | 726 | 731 | 171.5 |
| C | 14 | 238 | 117303 | 679.58 | 726 | 731 | 171.5 |
| C | 14 | 67 | 21483 | 120.98 | 726 | 731 | 171.5 |
| D | 13 | 249 | 380343 | 2189.12 | 736 | 717 | 173.4 |
| D | 8 | 195 | 308033 | 1772.14 | 736 | 717 | 173.4 |
| D | 2 | 250 | 50855 | 289.12 | 736 | 717 | 173.4 |
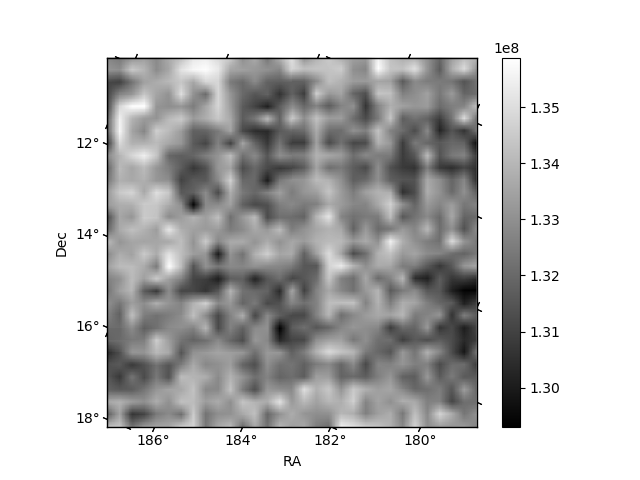
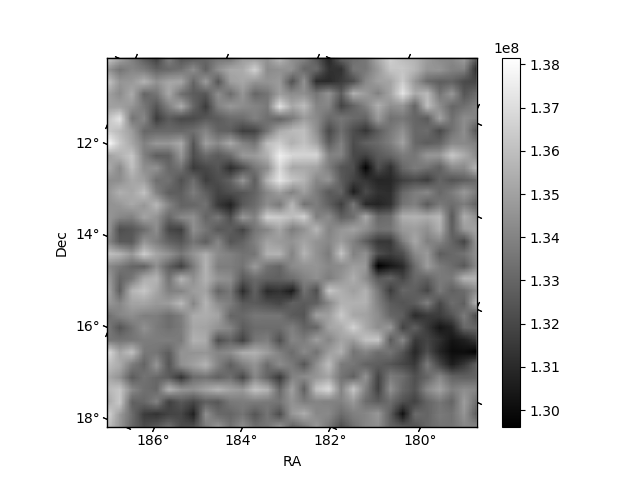
Histogram calculated using DETX and DETY for each event in the final _common_clean file
| Quadrant A | 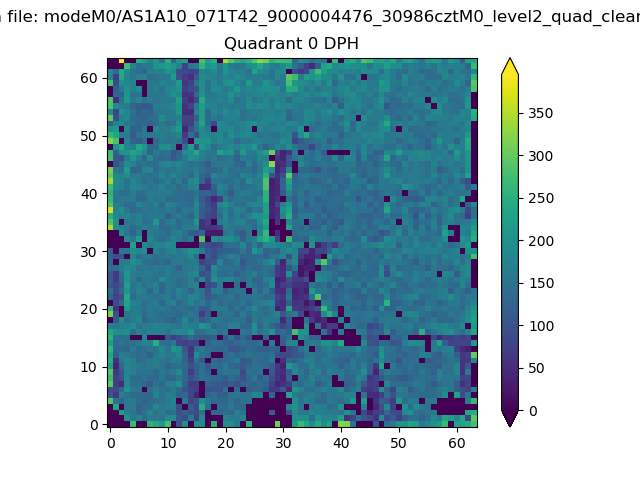 |
 |
Quadrant B |
|---|---|---|---|
| Quadrant D | 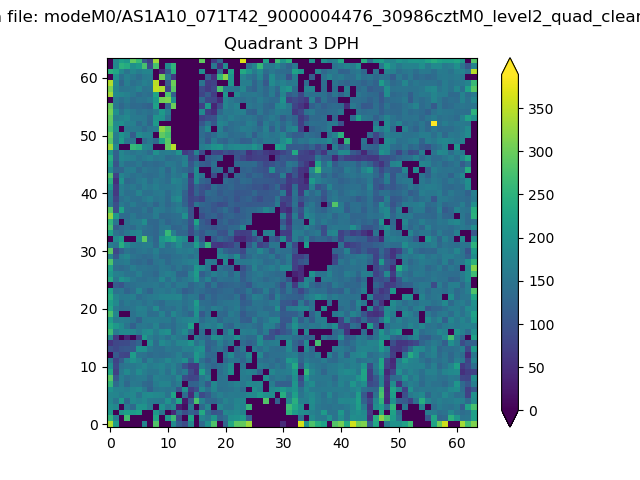 |
 |
Quadrant C |
| Plot type | Count rate plots | Images |
|---|---|---|
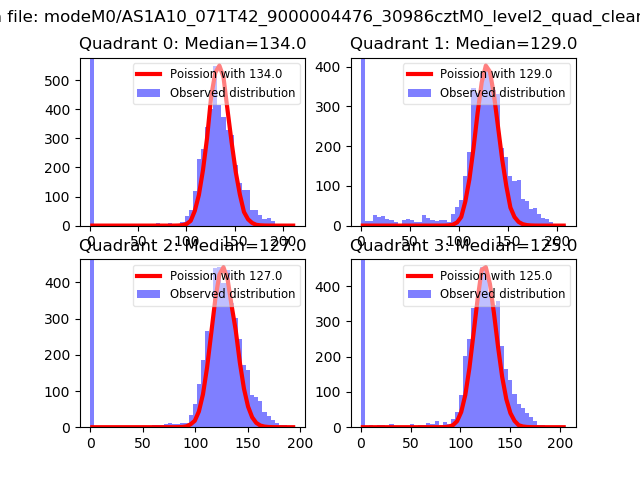
| Comparison with Poisson distribution Blue bars denote a histogram of data divided into 1 sec bins. Red curve is a Poisson curve with rate = median count rate of data. |
 |
 |
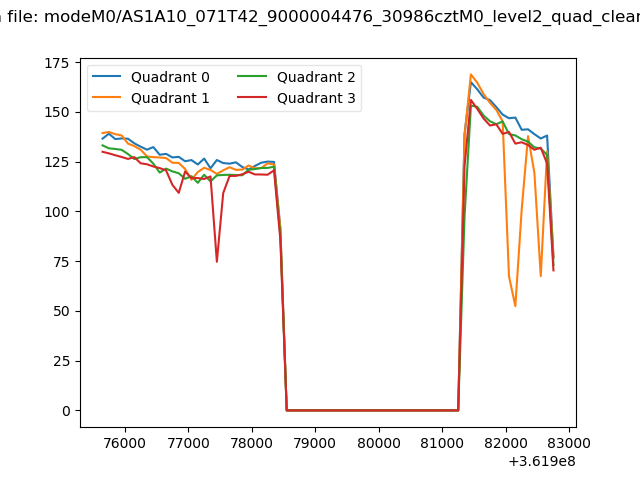
| Quadrant-wise count rates Data is divided into 100 sec bins |
 |
|
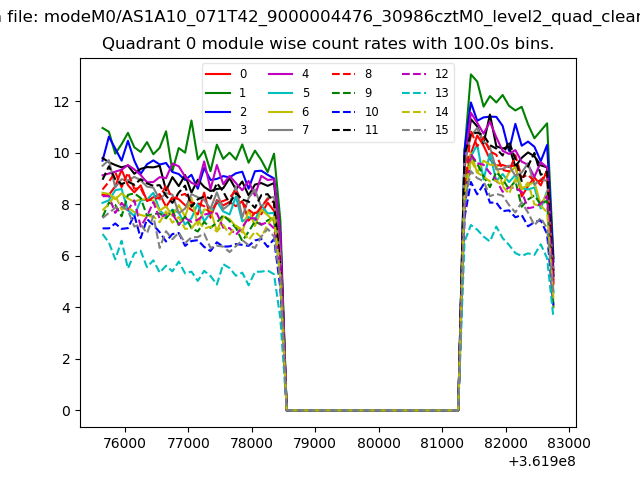
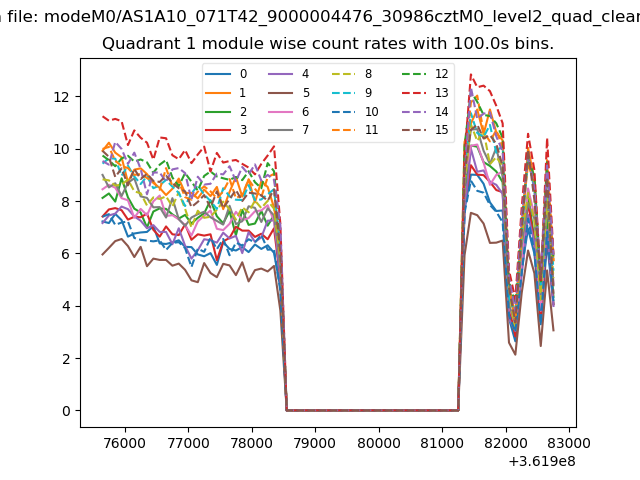
| Module-wise count rates for Quadrant A Data is divided into 100 sec bins |
 |
 |
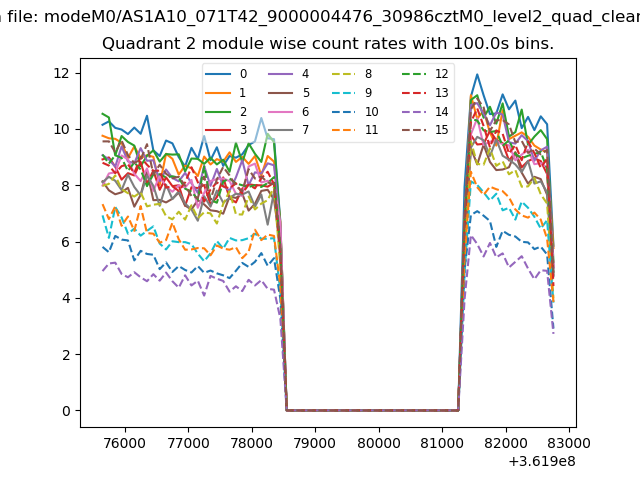
| Module-wise count rates for Quadrant B Data is divided into 100 sec bins |
 |
 |
| Module-wise count rates for Quadrant C Data is divided into 100 sec bins |
 |
 |
| Module-wise count rates for Quadrant D Data is divided into 100 sec bins |
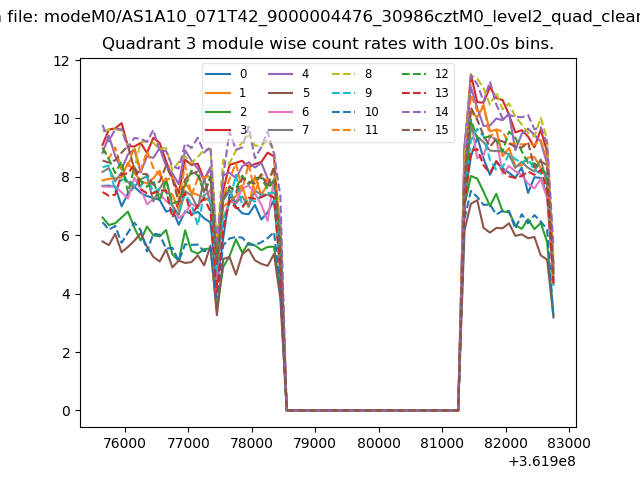 |
 |
| Parameter | Plot |
|---|---|
| CZT HV Monitor | 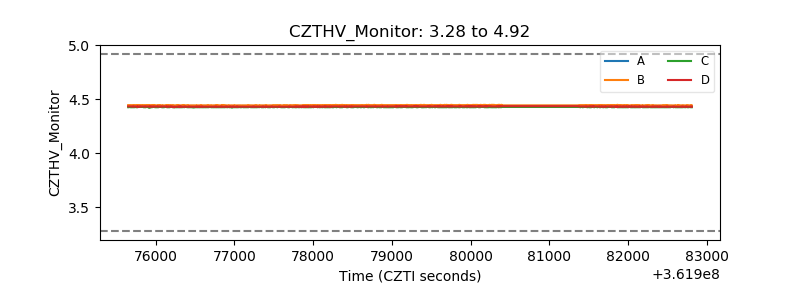 |
| D_VDD |  |
| Temperature 1 | 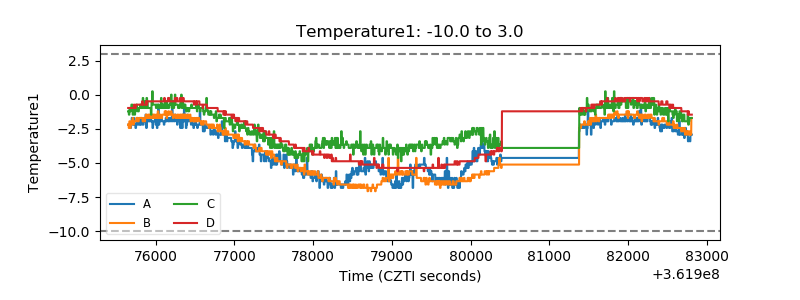 |
| Veto HV Monitor | 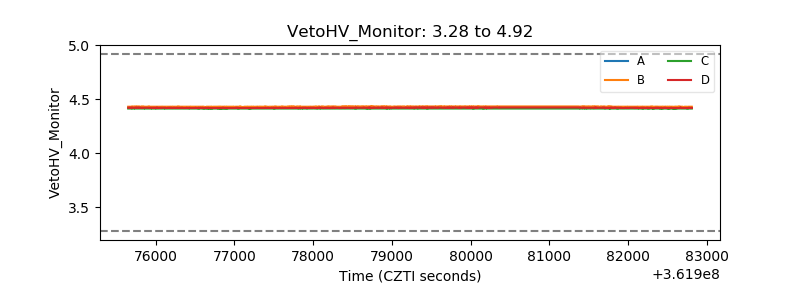 |
| Veto LLD | 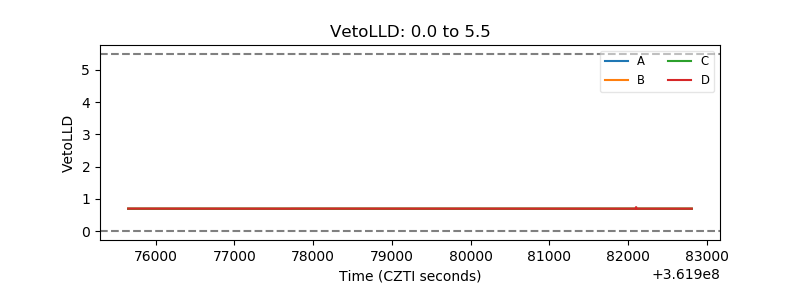 |
| Alpha Counter |  |
| _CPM_Rate | 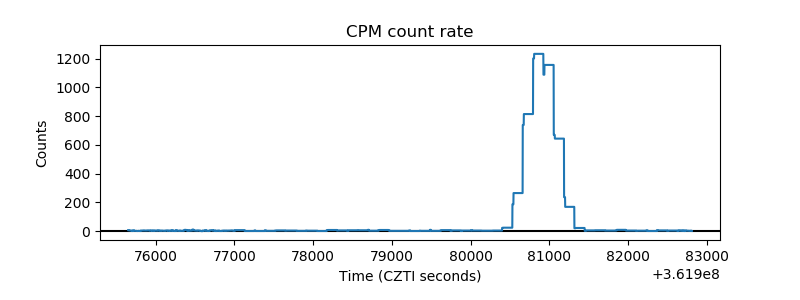 |
| CZT Counter | 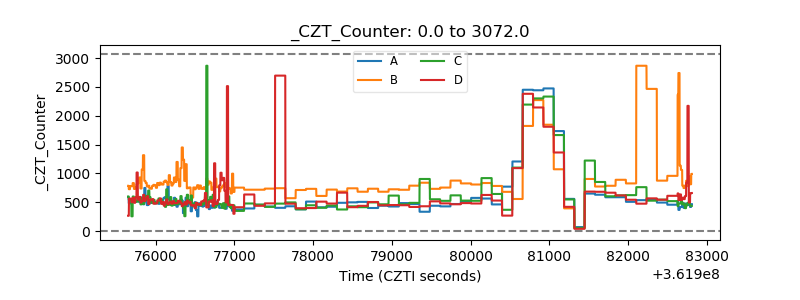 |
| +2.5 Volts monitor |  |
| +5 Volts monitor |  |
| _ROLL_ROT | 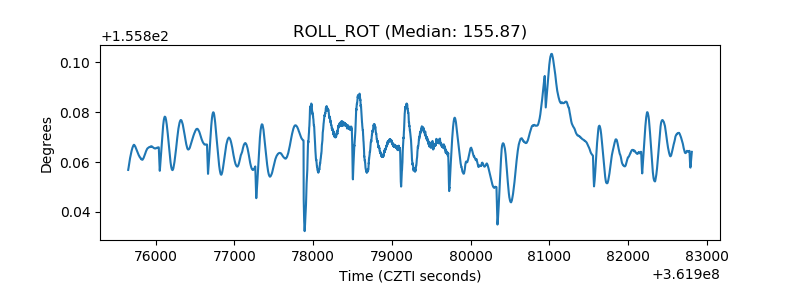 |
| _Roll_DEC | 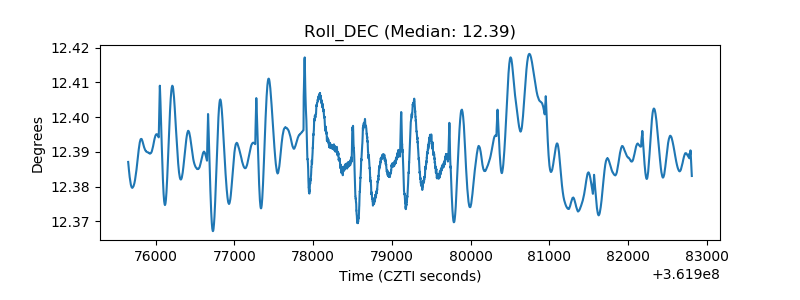 |
| _Roll_RA | 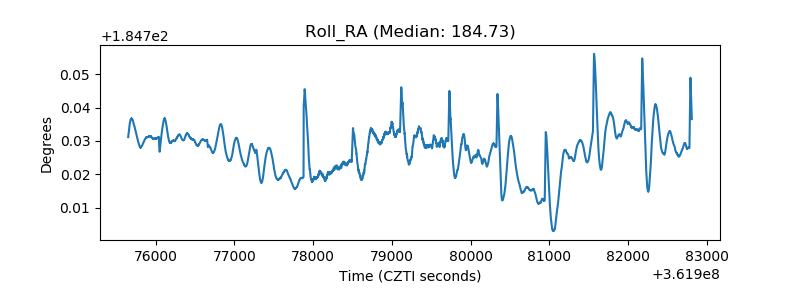 |
| Veto Counter | 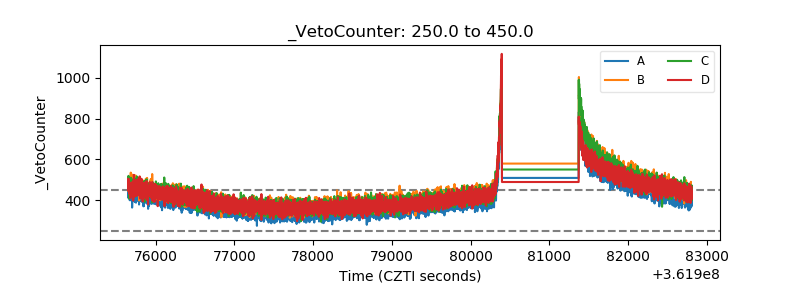 |