| Param | Original file | Final file |
|---|---|---|
| Filename | modeM0/AS1A10_071T42_9000004476_30988cztM0_level2.evt | modeM0/AS1A10_071T42_9000004476_30988cztM0_level2_quad_clean.evt |
| Size (bytes) | 179,945,280 | 36,996,480 |
| Size | 171.6 MB | 35.3 MB |
| Events in quadrant A | 901,643 | 261,973 |
| Events in quadrant B | 2,171,168 | 228,168 |
| Events in quadrant C | 1,006,503 | 248,132 |
| Events in quadrant D | 1,241,018 | 244,966 |
| Mode SS | |||
|---|---|---|---|
| Quadrant | BADHDUFLAG | Total packets | Discarded packets |
| A | 0 | 38 | 0 |
| B | 0 | 38 | 0 |
| C | 0 | 38 | 0 |
| D | 0 | 38 | 0 |
| Mode M0 | |||
|---|---|---|---|
| Quadrant | BADHDUFLAG | Total packets | Discarded packets |
| A | 0 | 3862 | 0 |
| B | 0 | 7748 | 0 |
| C | 0 | 4151 | 0 |
| D | 0 | 4916 | 0 |
| Quadrant | Total seconds | Saturated seconds | Saturation percentage |
|---|---|---|---|
| A | 1869 | 1 | 0.053505% |
| B | 1870 | 361 | 19.304813% |
| C | 1870 | 19 | 1.016043% |
| D | 1870 | 36 | 1.925134% |
Noise dominated data is calculated using 1-second bins in cleaned event files. If a bin has >2000 counts, and if more than 50% of those come from <1% of pixels, then it is considered to be noise-dominated and hence unusable.
| Quadrant | # 1 sec bins | Bins with >0 counts | Bins with >2000 counts | High rate bins dominated by noise | Noise dominated (total time) | Noise dominated (detector-on time) | Marked lightcurve |
|---|---|---|---|---|---|---|---|
| A | 1869 | 1869 | 0 | 0 | 0.00% | 0.00% | 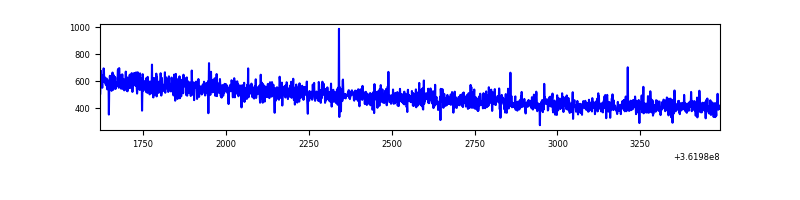 |
| B | 1870 | 1870 | 325 | 325 | 17.38% | 17.38% | 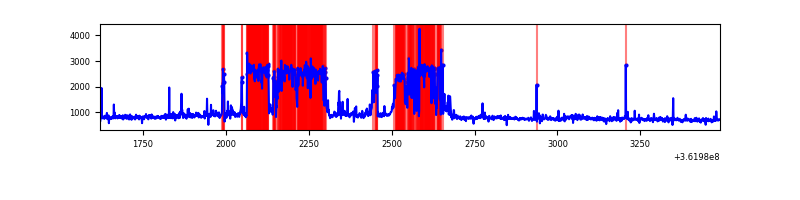 |
| C | 1870 | 1870 | 3 | 3 | 0.16% | 0.16% | 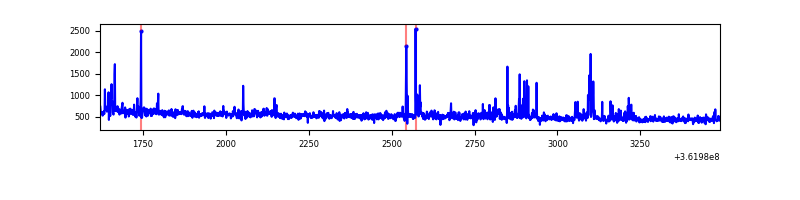 |
| D | 1870 | 1870 | 41 | 41 | 2.19% | 2.19% | 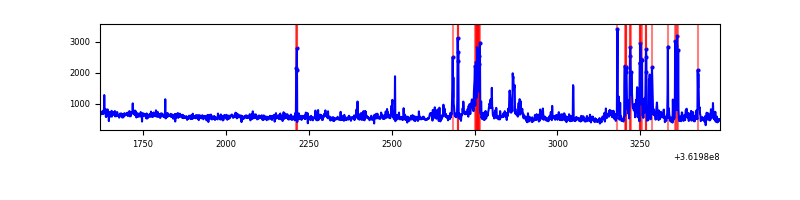 |
Top three noisy pixels from each quadrant. If the there are fewer than three noisy pixels in the level2.evt file, extra rows are filled as -1
| Pixel properties | Quadrant properties | ||||||
|---|---|---|---|---|---|---|---|
| Quadrant | DetID | PixID | Counts | Sigma | Mean | Median | Sigma |
| A | 13 | 254 | 4036 | 78.57 | 233 | 228 | 48.5 |
| A | 3 | 137 | 2193 | 40.54 | 233 | 228 | 48.5 |
| A | 0 | 226 | 1974 | 36.02 | 233 | 228 | 48.5 |
| B | 5 | 172 | 789987 | 19442.26 | 205 | 200 | 40.6 |
| B | 6 | 159 | 499392 | 12288.66 | 205 | 200 | 40.6 |
| B | 0 | 155 | 27682 | 676.53 | 205 | 200 | 40.6 |
| C | 0 | 10 | 87344 | 1617.99 | 223 | 224 | 53.8 |
| C | 14 | 238 | 36538 | 674.42 | 223 | 224 | 53.8 |
| C | 4 | 175 | 5835 | 104.21 | 223 | 224 | 53.8 |
| D | 13 | 249 | 207522 | 3727.03 | 227 | 220 | 55.6 |
| D | 8 | 195 | 147591 | 2649.55 | 227 | 220 | 55.6 |
| D | 2 | 234 | 10409 | 183.19 | 227 | 220 | 55.6 |
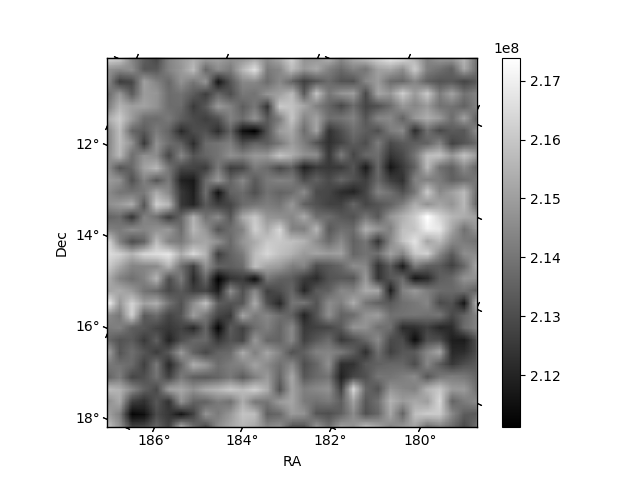
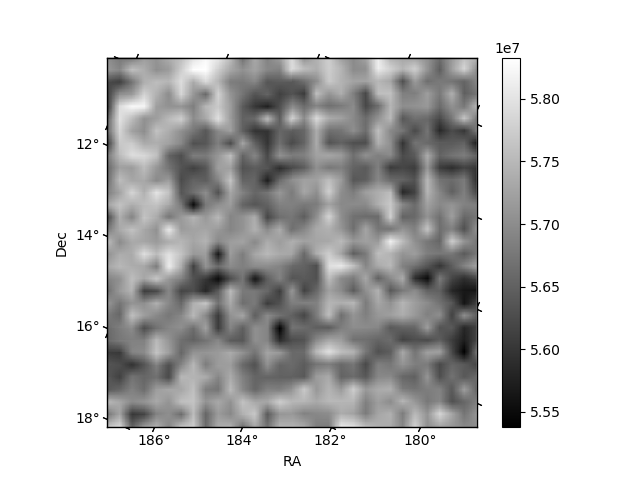
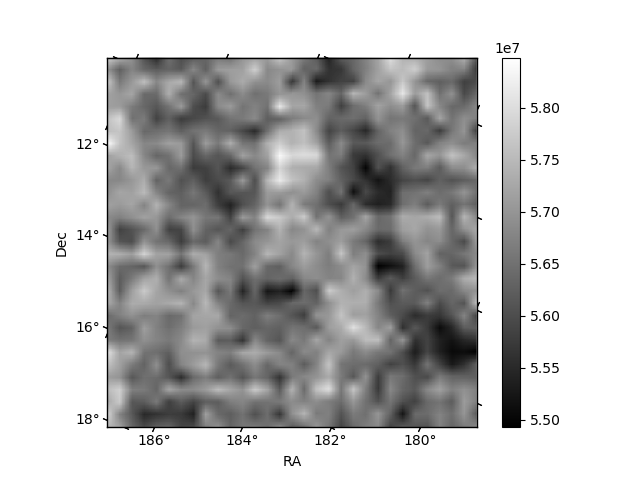
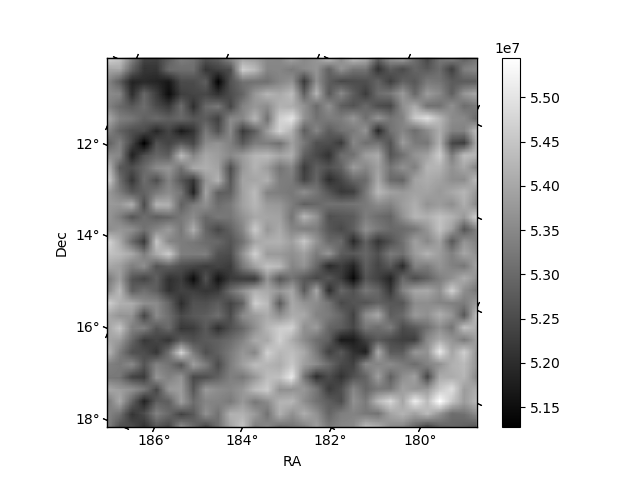
Histogram calculated using DETX and DETY for each event in the final _common_clean file
| Quadrant A | 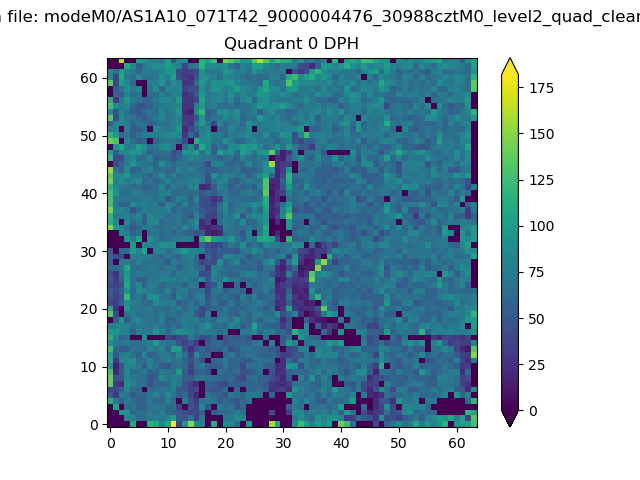 |
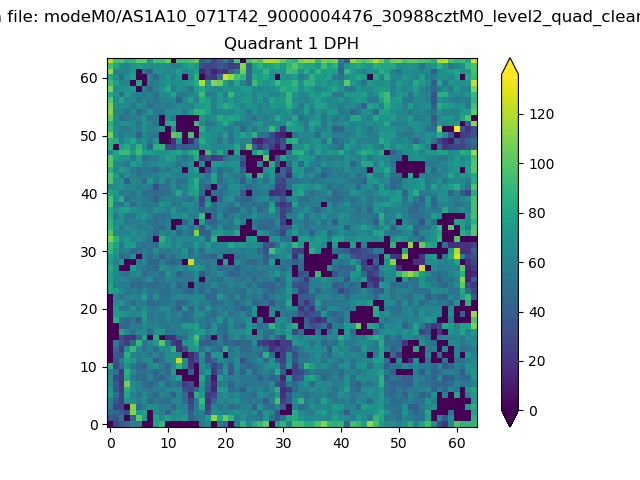 |
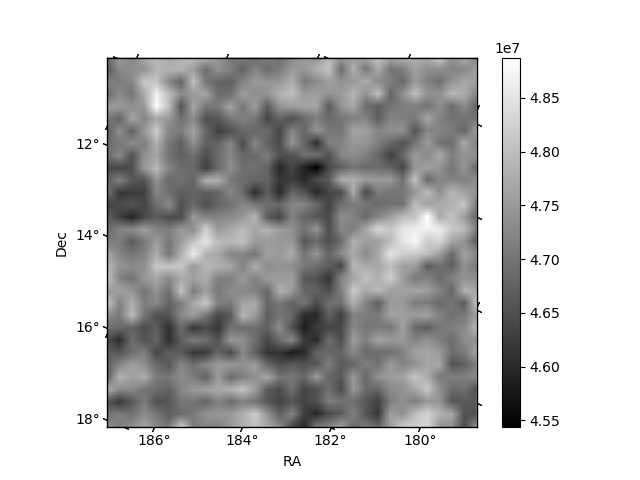
Quadrant B |
|---|---|---|---|
| Quadrant D |  |
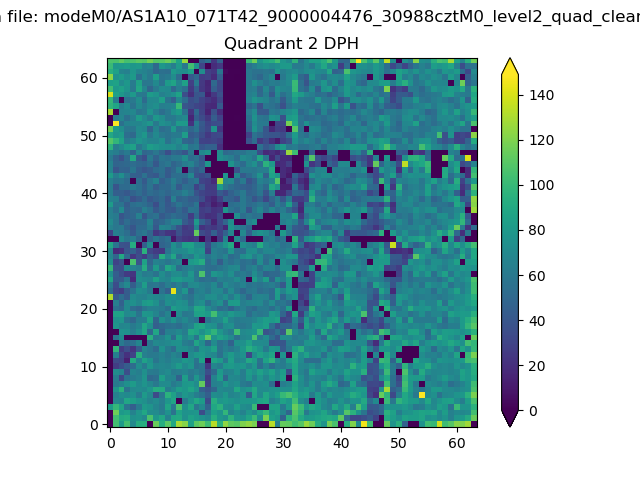 |
Quadrant C |
| Plot type | Count rate plots | Images |
|---|---|---|
| Comparison with Poisson distribution Blue bars denote a histogram of data divided into 1 sec bins. Red curve is a Poisson curve with rate = median count rate of data. |
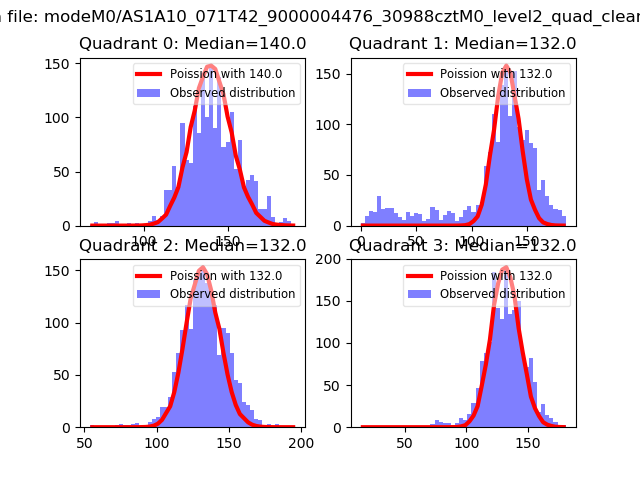 |
 |
| Quadrant-wise count rates Data is divided into 100 sec bins |
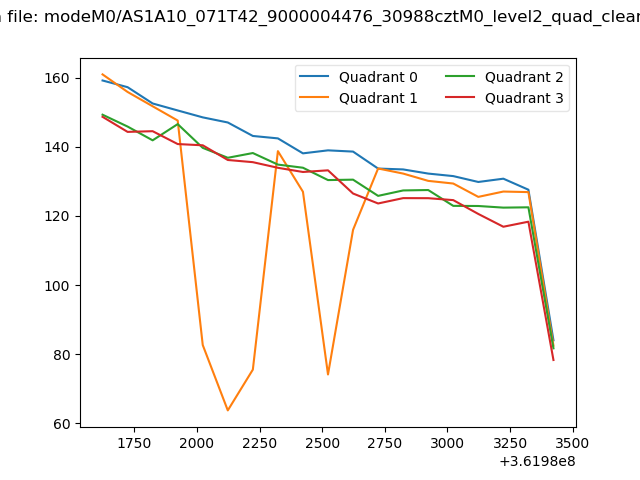 |
|
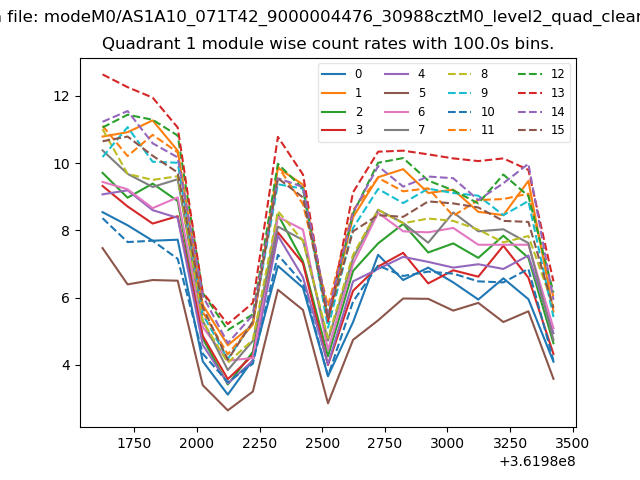
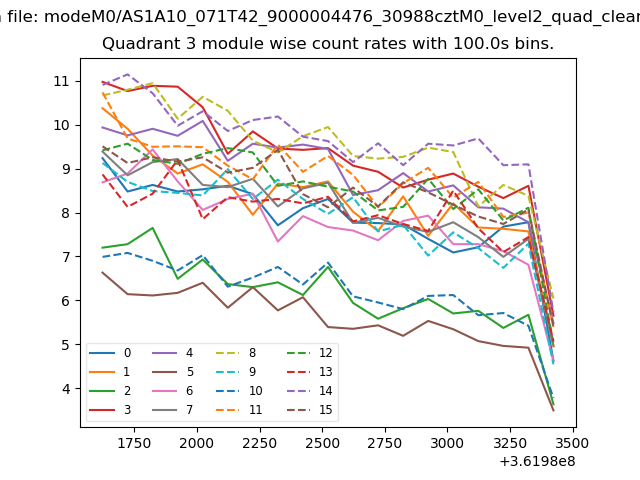
| Module-wise count rates for Quadrant A Data is divided into 100 sec bins |
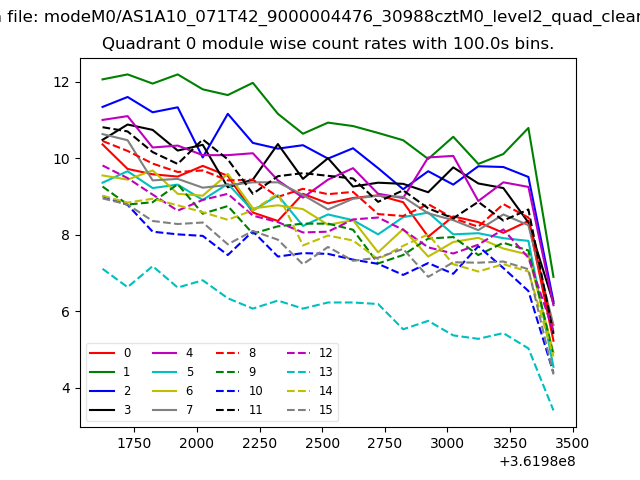 |
 |
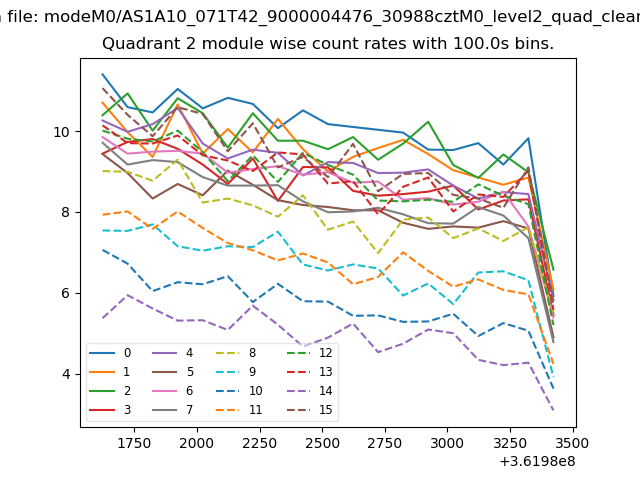
| Module-wise count rates for Quadrant B Data is divided into 100 sec bins |
 |
 |
| Module-wise count rates for Quadrant C Data is divided into 100 sec bins |
 |
 |
| Module-wise count rates for Quadrant D Data is divided into 100 sec bins |
 |
 |
| Parameter | Plot |
|---|---|
| CZT HV Monitor | 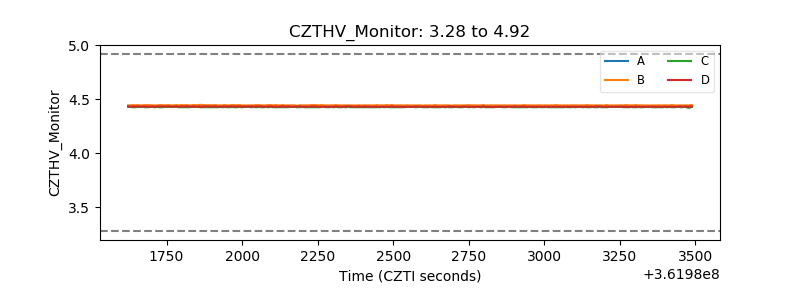 |
| D_VDD |  |
| Temperature 1 |  |
| Veto HV Monitor | 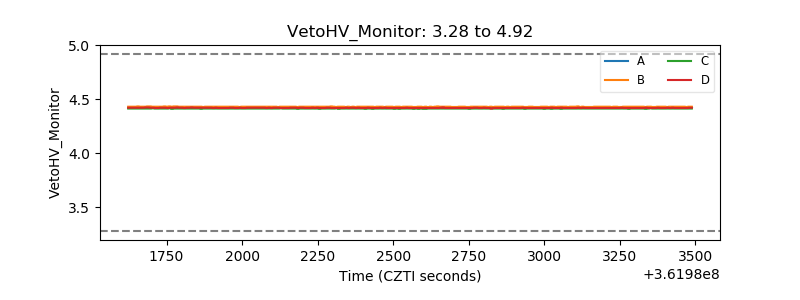 |
| Veto LLD | 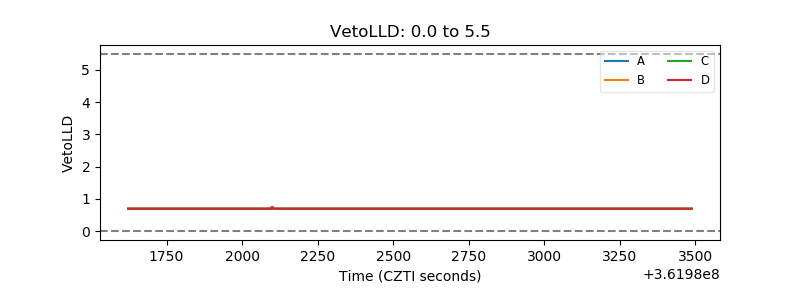 |
| Alpha Counter | 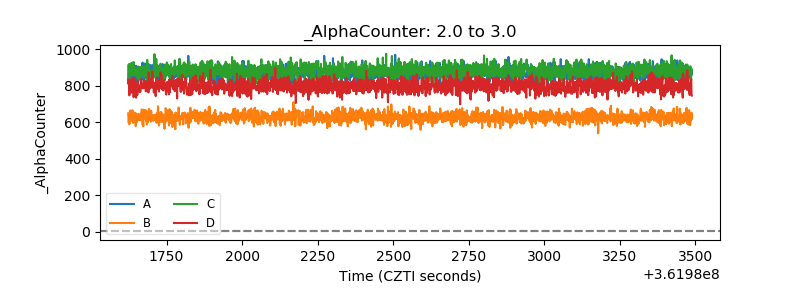 |
| _CPM_Rate | 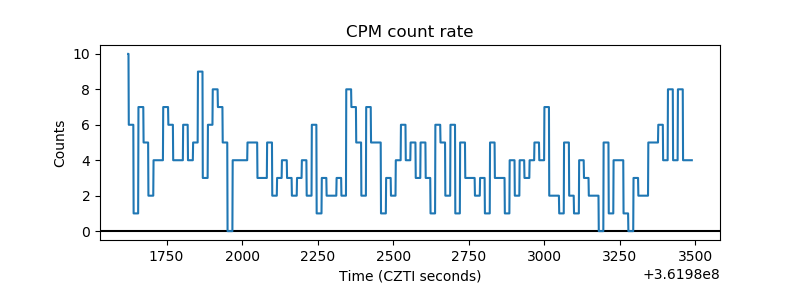 |
| CZT Counter | 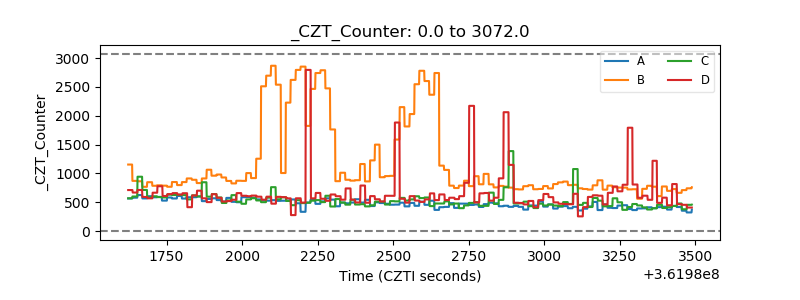 |
| +2.5 Volts monitor |  |
| +5 Volts monitor | 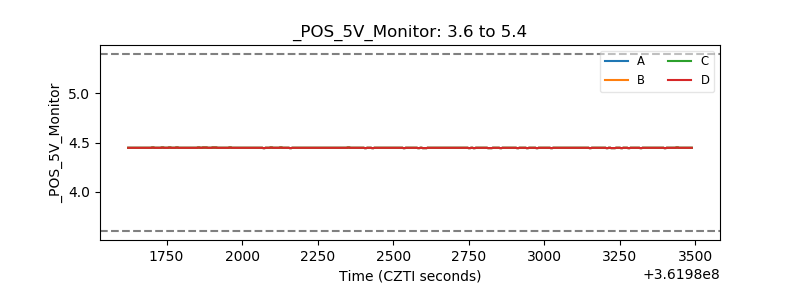 |
| _ROLL_ROT | 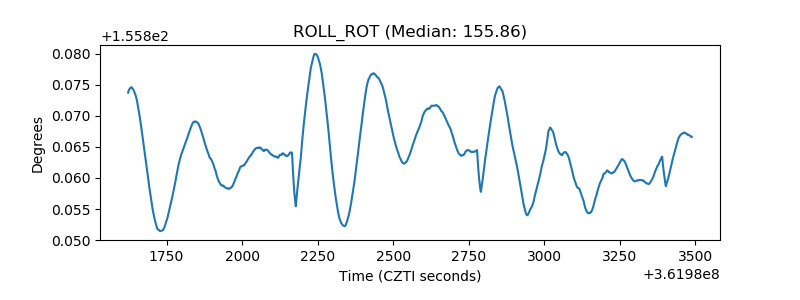 |
| _Roll_DEC | 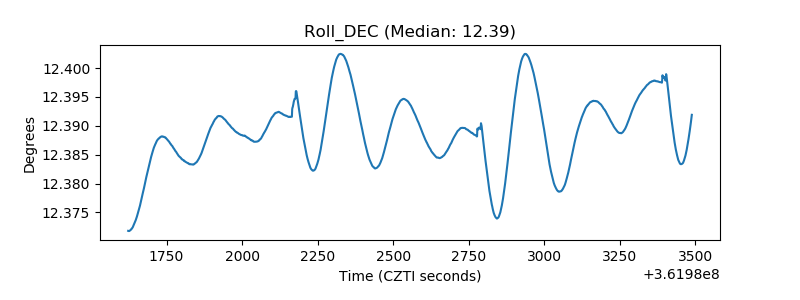 |
| _Roll_RA | 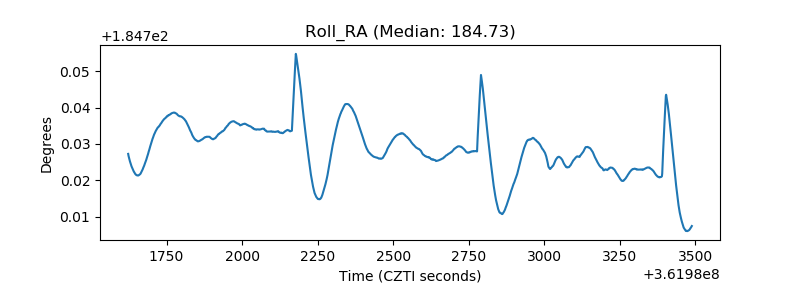 |
| Veto Counter | 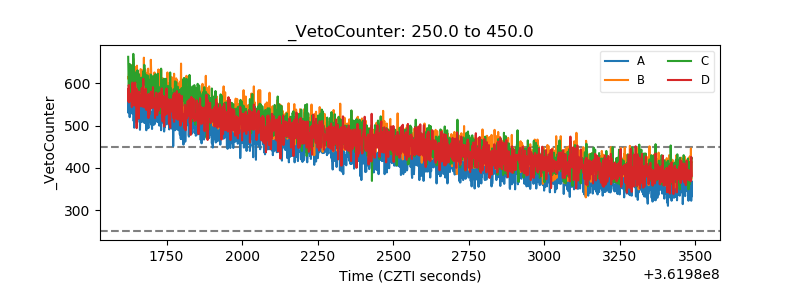 |