| Param | Original file | Final file |
|---|---|---|
| Filename | modeM0/AS1A10_071T48_9000004478cztM0_level2.fits | modeM0/AS1A10_071T48_9000004478cztM0_level2_quad_clean.evt |
| Size (bytes) | 797,803,200 | 576,829,440 |
| Size | 760.8 MB | 550.1 MB |
| Events in quadrant A | 5,032,680 | 3,175,507 |
| Events in quadrant B | 4,660,598 | 3,122,008 |
| Events in quadrant C | 4,769,148 | 2,969,465 |
| Events in quadrant D | 4,235,388 | 2,737,204 |
| Mode SS | |||
|---|---|---|---|
| Quadrant | BADHDUFLAG | Total packets | Discarded packets |
| A | 0 | 1620 | 0 |
| B | 0 | 1620 | 0 |
| C | 0 | 1620 | 0 |
| D | 0 | 1620 | 0 |
| Mode M9 | |||
|---|---|---|---|
| Quadrant | BADHDUFLAG | Total packets | Discarded packets |
| A | 0 | 135 | 0 |
| B | 0 | 135 | 0 |
| C | 0 | 135 | 0 |
| D | 0 | 135 | 0 |
| Mode M0 | |||
|---|---|---|---|
| Quadrant | BADHDUFLAG | Total packets | Discarded packets |
| A | 0 | 166368 | 0 |
| B | 0 | 249971 | 0 |
| C | 0 | 180773 | 0 |
| D | 0 | 194898 | 0 |
| Quadrant | Total seconds | Saturated seconds | Saturation percentage |
|---|---|---|---|
| A | 79687 | 1085 | 1.361577% |
| B | 79687 | 2891 | 3.627944% |
| C | 79687 | 2529 | 3.173667% |
| D | 79687 | 1547 | 1.941346% |
Noise dominated data is calculated using 1-second bins in cleaned event files. If a bin has >2000 counts, and if more than 50% of those come from <1% of pixels, then it is considered to be noise-dominated and hence unusable.
| Quadrant | # 1 sec bins | Bins with >0 counts | Bins with >2000 counts | High rate bins dominated by noise | Noise dominated (total time) | Noise dominated (detector-on time) | Marked lightcurve |
|---|---|---|---|---|---|---|---|
| A | 92982 | 79675 | 0 | 0 | 0.00% | 0.00% |  |
| B | 92982 | 79662 | 0 | 0 | 0.00% | 0.00% |  |
| C | 92982 | 79672 | 0 | 0 | 0.00% | 0.00% |  |
| D | 92982 | 79659 | 0 | 0 | 0.00% | 0.00% |  |
Top three noisy pixels from each quadrant. If the there are fewer than three noisy pixels in the level2.evt file, extra rows are filled as -1
| Pixel properties | Quadrant properties | ||||||
|---|---|---|---|---|---|---|---|
| Quadrant | DetID | PixID | Counts | Sigma | Mean | Median | Sigma |
| A | 0 | 29 | 4838 | 11.23 | 1310 | 1233 | 321.0 |
| A | 7 | 110 | 4003 | 8.63 | 1310 | 1233 | 321.0 |
| A | 0 | 30 | 3723 | 7.76 | 1310 | 1233 | 321.0 |
| B | 2 | 9 | 3633 | 10.14 | 1233 | 1179 | 242.1 |
| B | 3 | 17 | 3131 | 8.06 | 1233 | 1179 | 242.1 |
| B | 2 | 8 | 3082 | 7.86 | 1233 | 1179 | 242.1 |
| C | 12 | 241 | 3334 | 6.72 | 1262 | 1181 | 320.4 |
| C | 3 | 187 | 3259 | 6.49 | 1262 | 1181 | 320.4 |
| C | 9 | 209 | 3219 | 6.36 | 1262 | 1181 | 320.4 |
| D | 10 | 189 | 3034 | 6.05 | 1208 | 1098 | 319.9 |
| D | 6 | 231 | 2945 | 5.77 | 1208 | 1098 | 319.9 |
| D | 6 | 62 | 2918 | 5.69 | 1208 | 1098 | 319.9 |
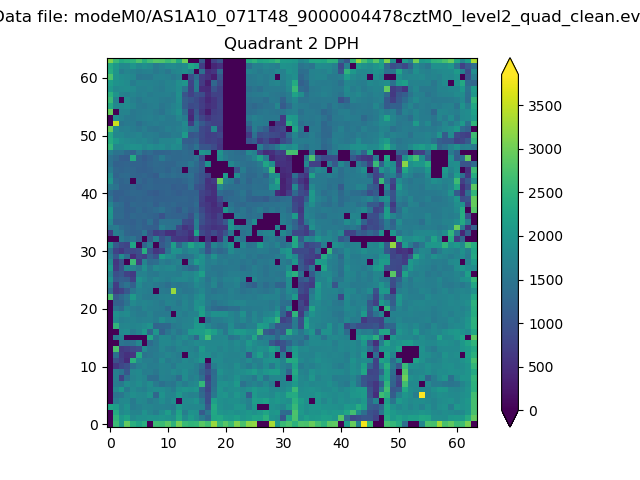
Histogram calculated using DETX and DETY for each event in the final _common_clean file
| Quadrant A |  |
 |
Quadrant B |
|---|---|---|---|
| Quadrant D |  |
 |
Quadrant C |
| Plot type | Count rate plots | Images |
|---|---|---|
| Comparison with Poisson distribution Blue bars denote a histogram of data divided into 1 sec bins. Red curve is a Poisson curve with rate = median count rate of data. |
 |
 |
| Quadrant-wise count rates Data is divided into 100 sec bins |
 |
|
| Module-wise count rates for Quadrant A Data is divided into 100 sec bins |
 |
 |
| Module-wise count rates for Quadrant B Data is divided into 100 sec bins |
 |
 |
| Module-wise count rates for Quadrant C Data is divided into 100 sec bins |
 |
 |
| Module-wise count rates for Quadrant D Data is divided into 100 sec bins |
 |
 |
| Parameter | Plot |
|---|---|
| CZT HV Monitor |  |
| D_VDD |  |
| Temperature 1 |  |
| Veto HV Monitor |  |
| Veto LLD |  |
| Alpha Counter |  |
| _CPM_Rate |  |
| CZT Counter |  |
| +2.5 Volts monitor |  |
| +5 Volts monitor |  |
| _ROLL_ROT |  |
| _Roll_DEC |  |
| _Roll_RA | 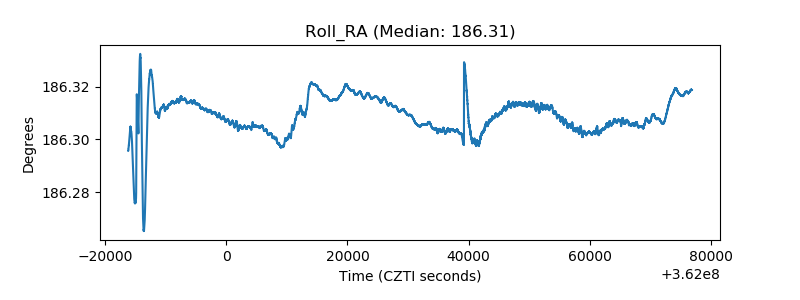 |
| Veto Counter |  |