| Param | Original file | Final file |
|---|---|---|
| Filename | modeM0/AS1A10_071T48_9000004478_30988cztM0_level2.evt | modeM0/AS1A10_071T48_9000004478_30988cztM0_level2_quad_clean.evt |
| Size (bytes) | 377,665,920 | 43,459,200 |
| Size | 360.2 MB | 41.4 MB |
| Events in quadrant A | 2,009,728 | 287,226 |
| Events in quadrant B | 4,353,197 | 209,524 |
| Events in quadrant C | 2,591,043 | 266,224 |
| Events in quadrant D | 2,210,309 | 268,984 |
| Mode SS | |||
|---|---|---|---|
| Quadrant | BADHDUFLAG | Total packets | Discarded packets |
| A | 0 | 82 | 0 |
| B | 0 | 82 | 0 |
| C | 0 | 82 | 0 |
| D | 0 | 82 | 0 |
| Mode M9 | |||
|---|---|---|---|
| Quadrant | BADHDUFLAG | Total packets | Discarded packets |
| A | 0 | 12 | 0 |
| B | 0 | 12 | 0 |
| C | 0 | 12 | 0 |
| D | 0 | 12 | 0 |
| Mode M0 | |||
|---|---|---|---|
| Quadrant | BADHDUFLAG | Total packets | Discarded packets |
| A | 0 | 8560 | 1 |
| B | 0 | 15776 | 1 |
| C | 0 | 10402 | 1 |
| D | 0 | 9123 | 1 |
| Quadrant | Total seconds | Saturated seconds | Saturation percentage |
|---|---|---|---|
| A | 4015 | 39 | 0.971357% |
| B | 4015 | 798 | 19.875467% |
| C | 4015 | 192 | 4.782067% |
| D | 4014 | 50 | 1.245640% |
Noise dominated data is calculated using 1-second bins in cleaned event files. If a bin has >2000 counts, and if more than 50% of those come from <1% of pixels, then it is considered to be noise-dominated and hence unusable.
| Quadrant | # 1 sec bins | Bins with >0 counts | Bins with >2000 counts | High rate bins dominated by noise | Noise dominated (total time) | Noise dominated (detector-on time) | Marked lightcurve |
|---|---|---|---|---|---|---|---|
| A | 5145 | 4015 | 0 | 0 | 0.00% | 0.00% | 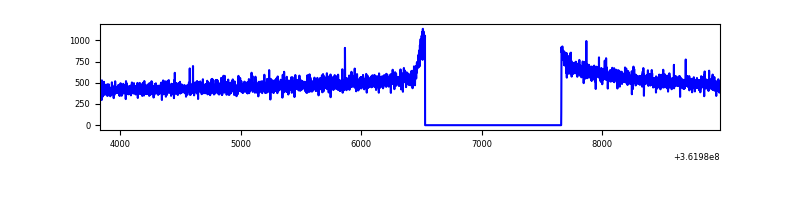 |
| B | 5145 | 4015 | 550 | 550 | 10.69% | 13.70% | 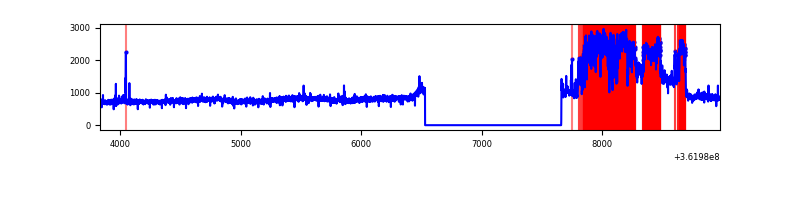 |
| C | 5145 | 4015 | 71 | 71 | 1.38% | 1.77% | 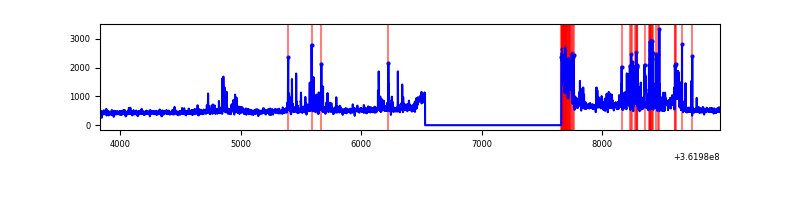 |
| D | 5144 | 4014 | 14 | 14 | 0.27% | 0.35% | 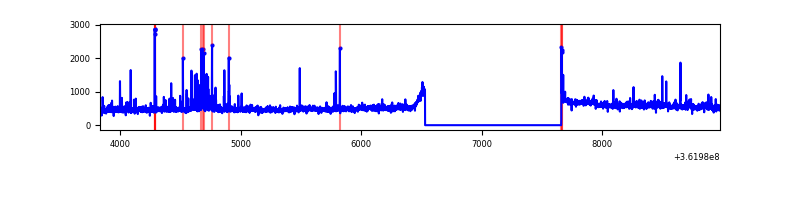 |
Top three noisy pixels from each quadrant. If the there are fewer than three noisy pixels in the level2.evt file, extra rows are filled as -1
| Pixel properties | Quadrant properties | ||||||
|---|---|---|---|---|---|---|---|
| Quadrant | DetID | PixID | Counts | Sigma | Mean | Median | Sigma |
| A | 13 | 254 | 7529 | 66.24 | 520 | 510 | 106.0 |
| A | 3 | 137 | 5188 | 44.15 | 520 | 510 | 106.0 |
| A | 0 | 226 | 4466 | 37.34 | 520 | 510 | 106.0 |
| B | 5 | 172 | 1402211 | 16102.92 | 454 | 443 | 87.1 |
| B | 6 | 159 | 1069797 | 12284.29 | 454 | 443 | 87.1 |
| B | 0 | 155 | 38393 | 435.95 | 454 | 443 | 87.1 |
| C | 0 | 10 | 535110 | 4604.79 | 491 | 494 | 116.1 |
| C | 14 | 238 | 79306 | 678.83 | 491 | 494 | 116.1 |
| C | 3 | 233 | 46135 | 393.12 | 491 | 494 | 116.1 |
| D | 8 | 195 | 169593 | 1388.65 | 502 | 490 | 121.8 |
| D | 2 | 250 | 68550 | 558.9 | 502 | 490 | 121.8 |
| D | 2 | 234 | 20064 | 160.74 | 502 | 490 | 121.8 |
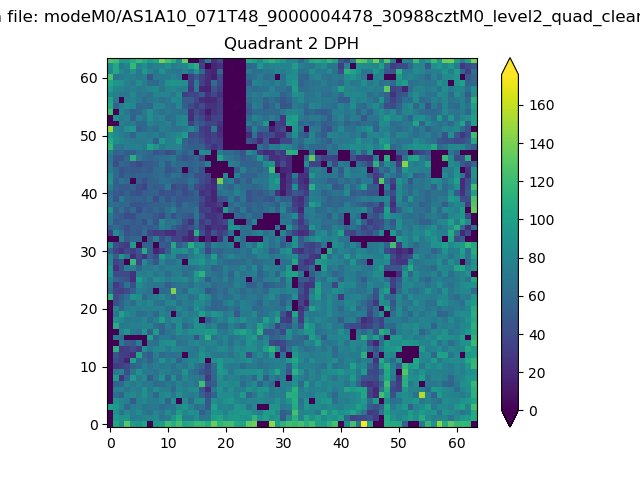
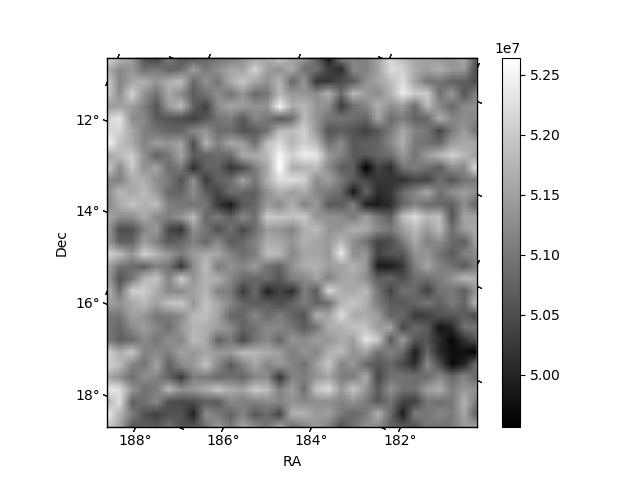
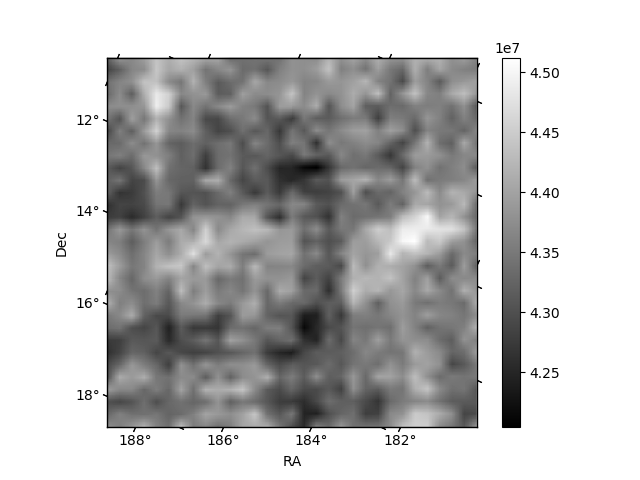
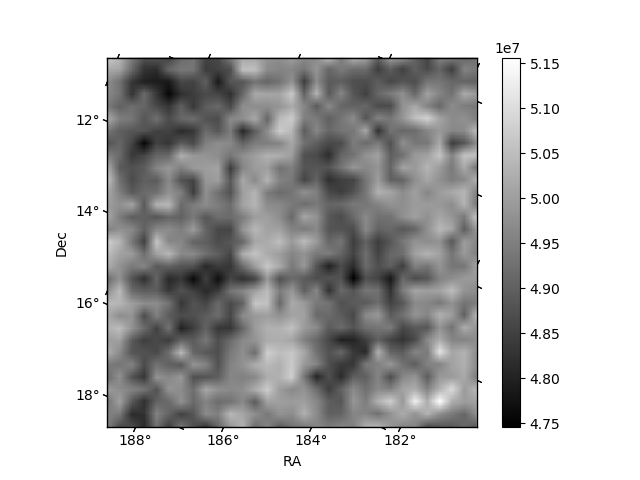
Histogram calculated using DETX and DETY for each event in the final _common_clean file
| Quadrant A | 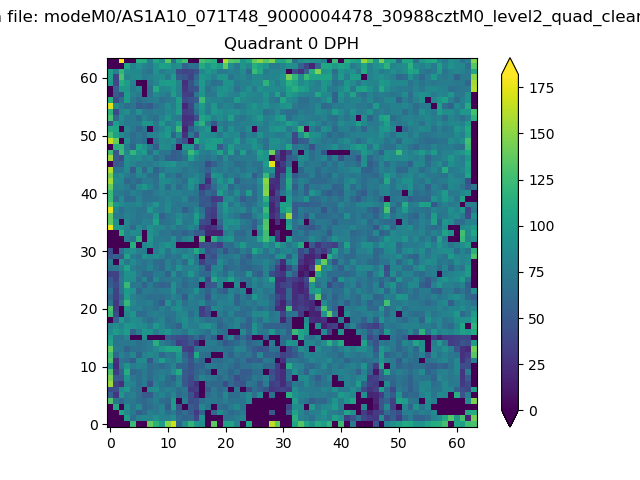 |
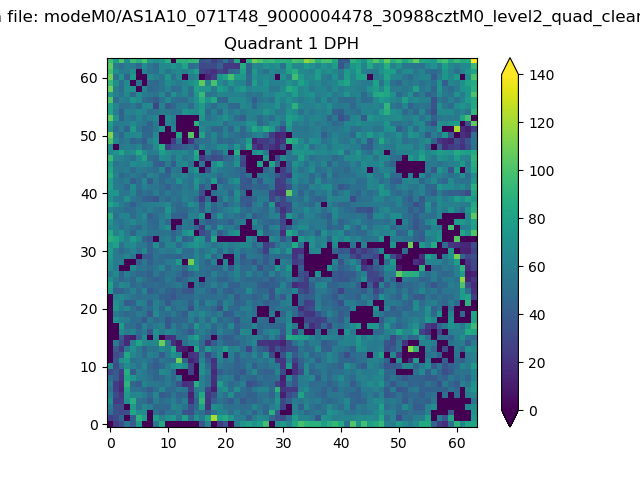 |
Quadrant B |
|---|---|---|---|
| Quadrant D | 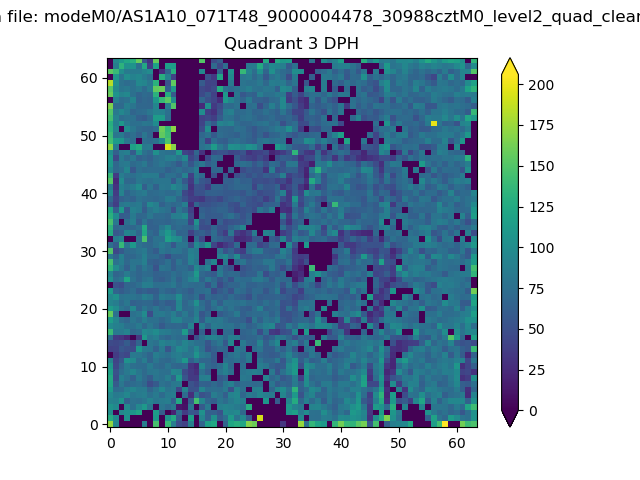 |
 |
Quadrant C |
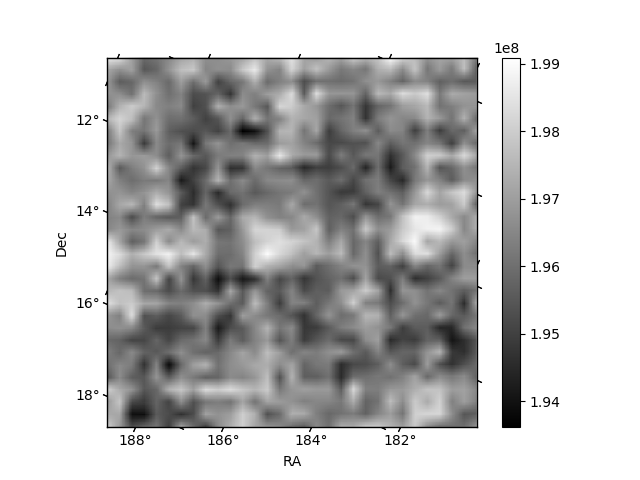
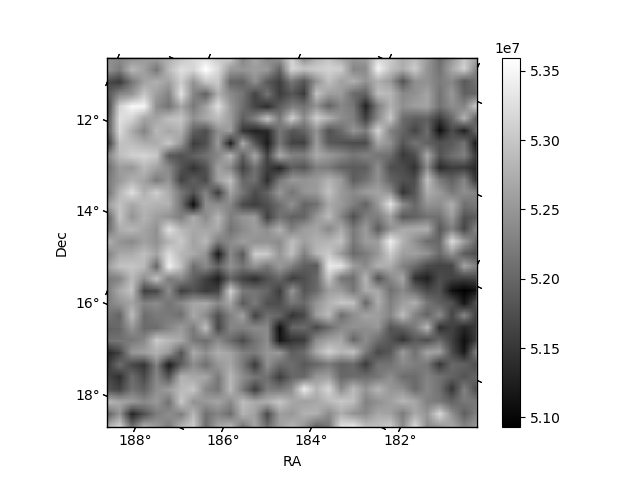
| Plot type | Count rate plots | Images |
|---|---|---|
| Comparison with Poisson distribution Blue bars denote a histogram of data divided into 1 sec bins. Red curve is a Poisson curve with rate = median count rate of data. |
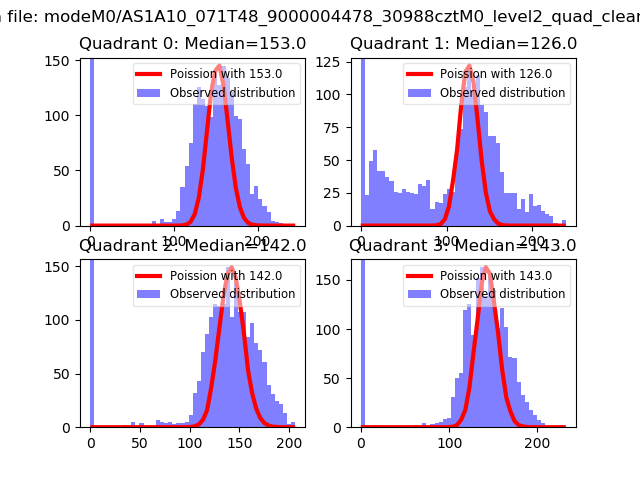 |
 |
| Quadrant-wise count rates Data is divided into 100 sec bins |
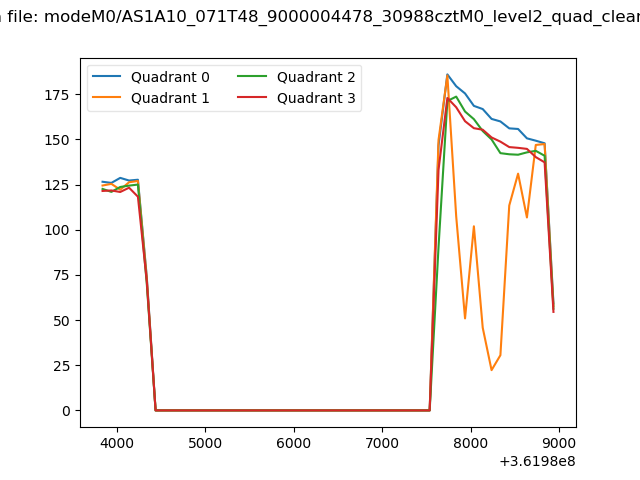 |
|
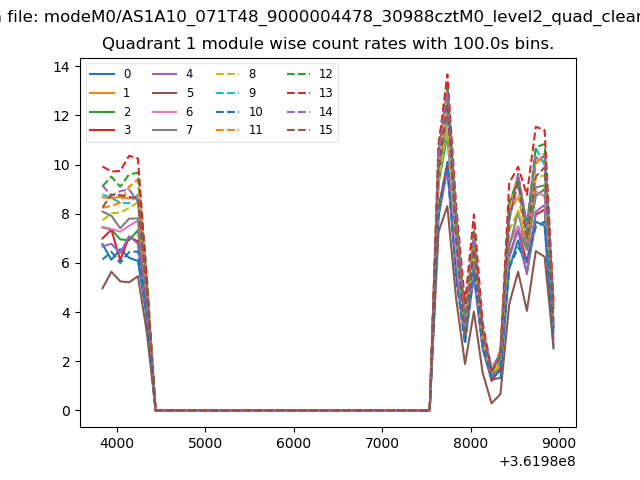
| Module-wise count rates for Quadrant A Data is divided into 100 sec bins |
 |
 |
| Module-wise count rates for Quadrant B Data is divided into 100 sec bins |
 |
 |
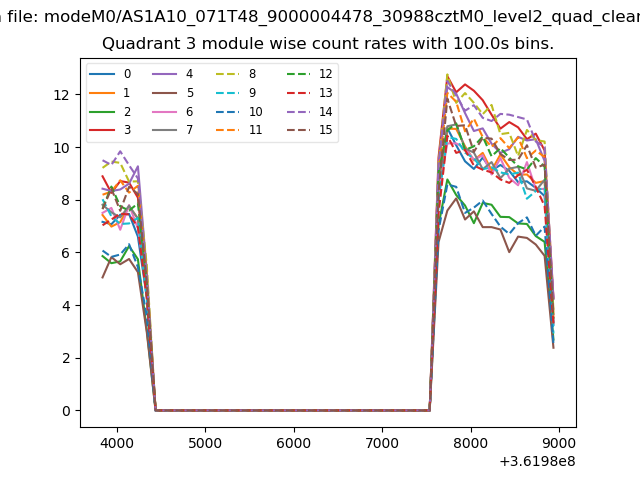
| Module-wise count rates for Quadrant C Data is divided into 100 sec bins |
 |
 |
| Module-wise count rates for Quadrant D Data is divided into 100 sec bins |
 |
 |
| Parameter | Plot |
|---|---|
| CZT HV Monitor |  |
| D_VDD | 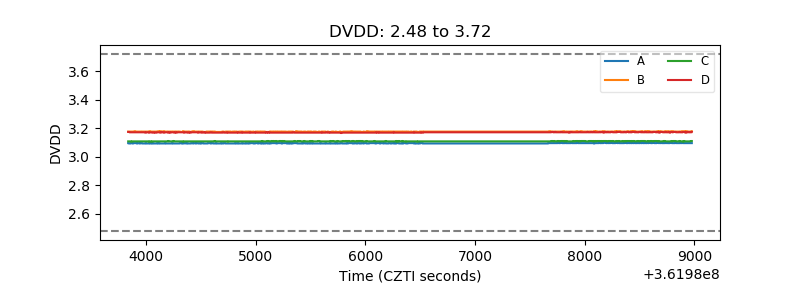 |
| Temperature 1 | 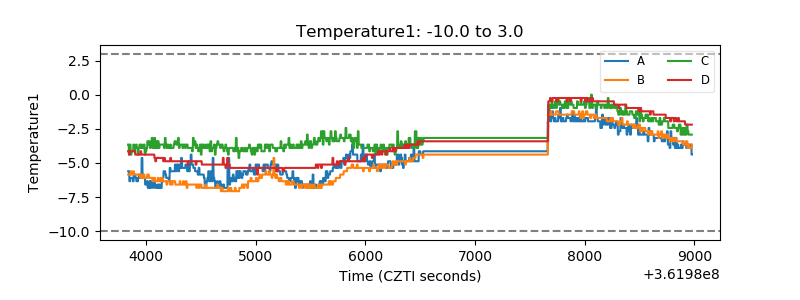 |
| Veto HV Monitor | 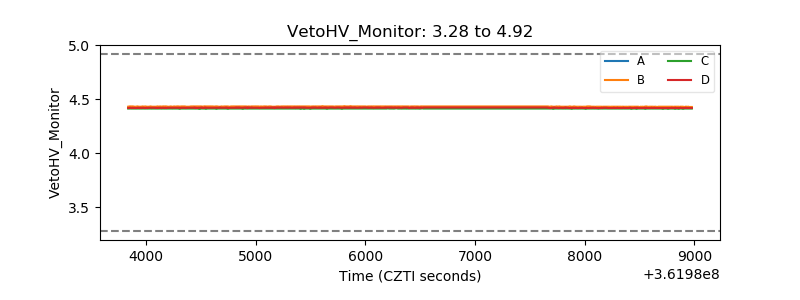 |
| Veto LLD | 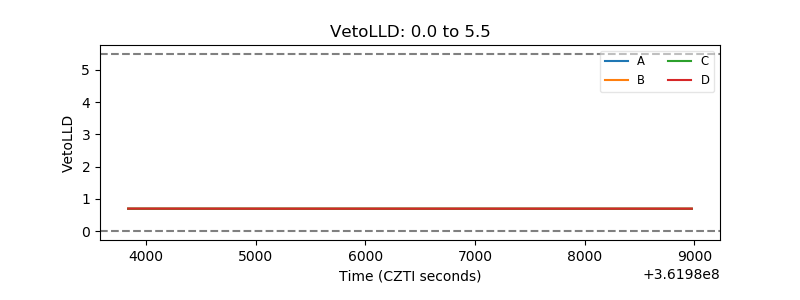 |
| Alpha Counter | 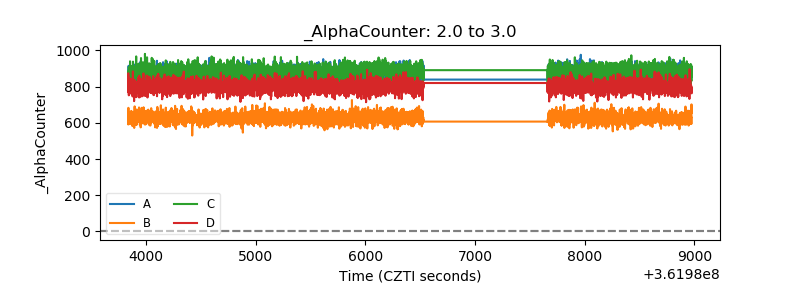 |
| _CPM_Rate | 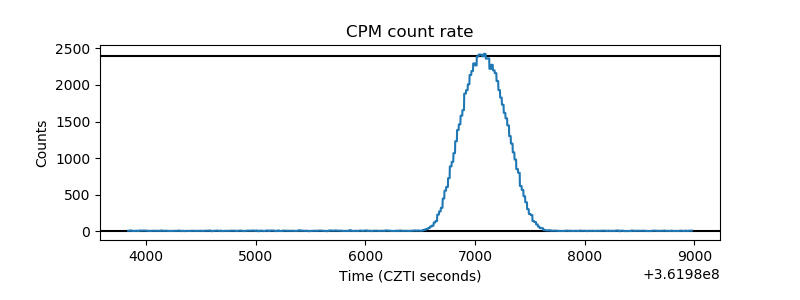 |
| CZT Counter | 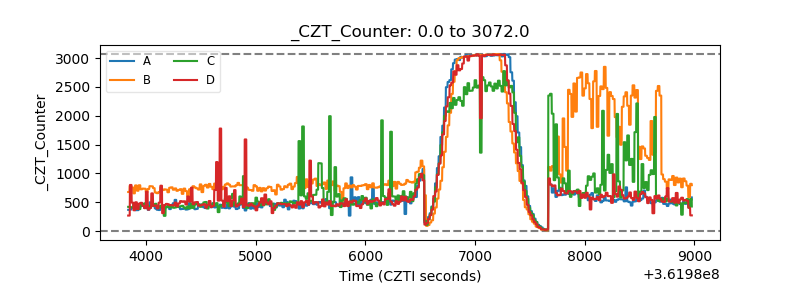 |
| +2.5 Volts monitor | 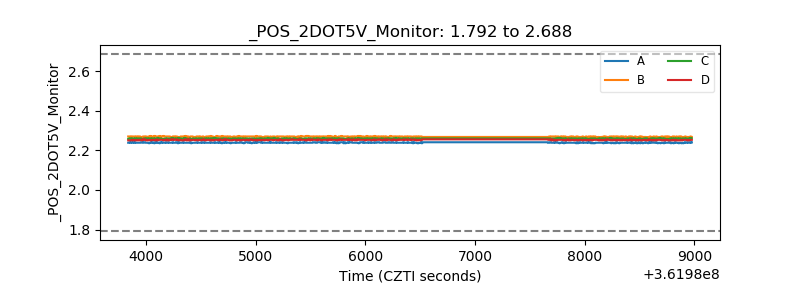 |
| +5 Volts monitor | 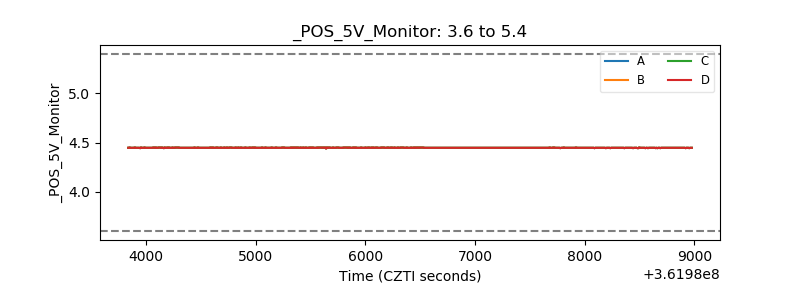 |
| _ROLL_ROT | 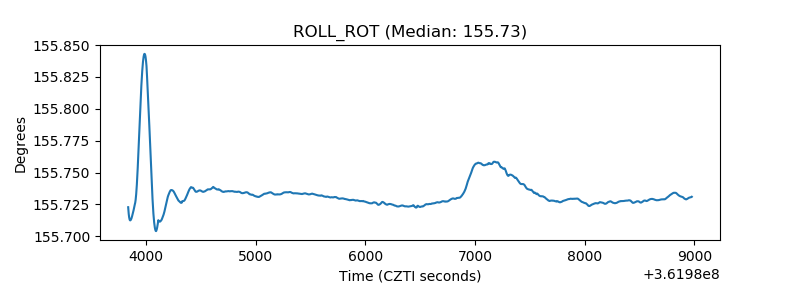 |
| _Roll_DEC | 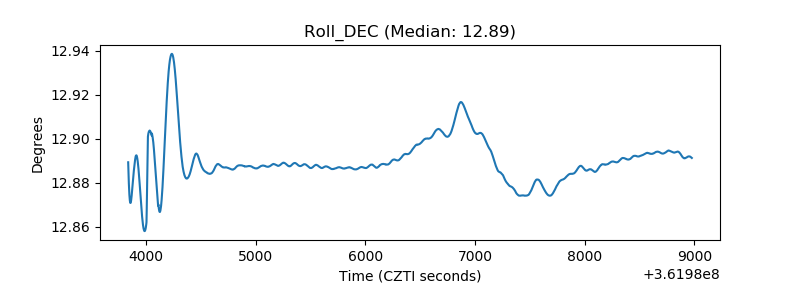 |
| _Roll_RA | 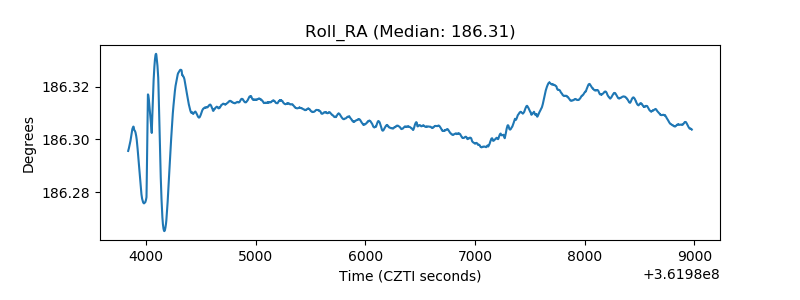 |
| Veto Counter | 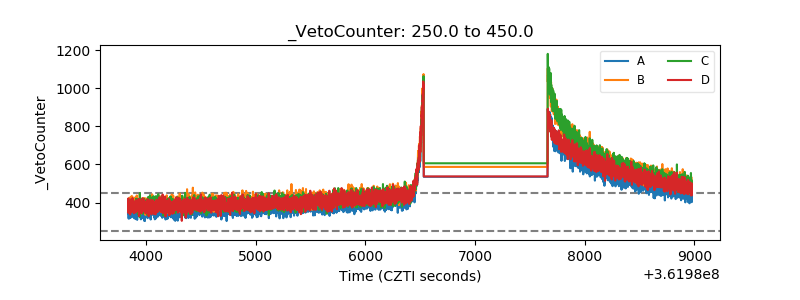 |