| Param | Original file | Final file |
|---|---|---|
| Filename | modeM0/AS1A10_071T48_9000004478_30989cztM0_level2.evt | modeM0/AS1A10_071T48_9000004478_30989cztM0_level2_quad_clean.evt |
| Size (bytes) | 593,795,520 | 94,659,840 |
| Size | 566.3 MB | 90.3 MB |
| Events in quadrant A | 3,235,882 | 648,494 |
| Events in quadrant B | 6,731,574 | 562,772 |
| Events in quadrant C | 4,131,318 | 607,863 |
| Events in quadrant D | 3,454,532 | 603,985 |
| Mode SS | |||
|---|---|---|---|
| Quadrant | BADHDUFLAG | Total packets | Discarded packets |
| A | 0 | 130 | 0 |
| B | 0 | 130 | 0 |
| C | 0 | 130 | 0 |
| D | 0 | 130 | 0 |
| Mode M9 | |||
|---|---|---|---|
| Quadrant | BADHDUFLAG | Total packets | Discarded packets |
| A | 0 | 12 | 0 |
| B | 0 | 13 | 0 |
| C | 0 | 13 | 0 |
| D | 0 | 13 | 0 |
| Mode M0 | |||
|---|---|---|---|
| Quadrant | BADHDUFLAG | Total packets | Discarded packets |
| A | 0 | 13657 | 2 |
| B | 0 | 24359 | 2 |
| C | 0 | 16382 | 2 |
| D | 0 | 14490 | 2 |
| Quadrant | Total seconds | Saturated seconds | Saturation percentage |
|---|---|---|---|
| A | 6346 | 48 | 0.756382% |
| B | 6346 | 992 | 15.631894% |
| C | 6345 | 264 | 4.160757% |
| D | 6345 | 41 | 0.646178% |
Noise dominated data is calculated using 1-second bins in cleaned event files. If a bin has >2000 counts, and if more than 50% of those come from <1% of pixels, then it is considered to be noise-dominated and hence unusable.
| Quadrant | # 1 sec bins | Bins with >0 counts | Bins with >2000 counts | High rate bins dominated by noise | Noise dominated (total time) | Noise dominated (detector-on time) | Marked lightcurve |
|---|---|---|---|---|---|---|---|
| A | 7601 | 6347 | 0 | 0 | 0.00% | 0.00% | 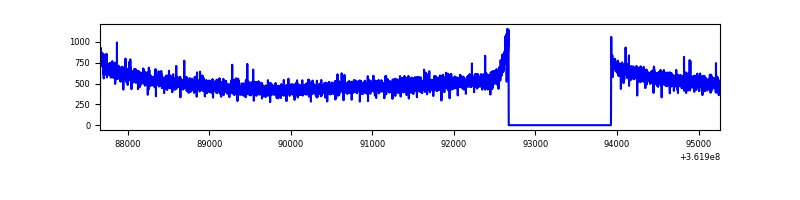 |
| B | 7601 | 6346 | 665 | 665 | 8.75% | 10.48% | 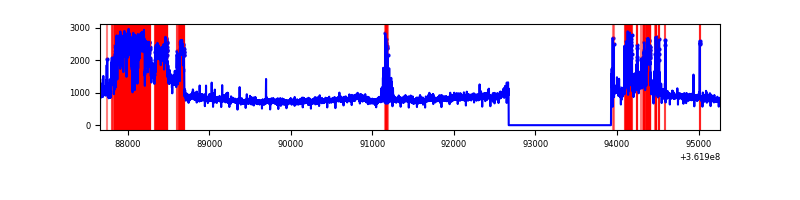 |
| C | 7600 | 6345 | 116 | 116 | 1.53% | 1.83% | 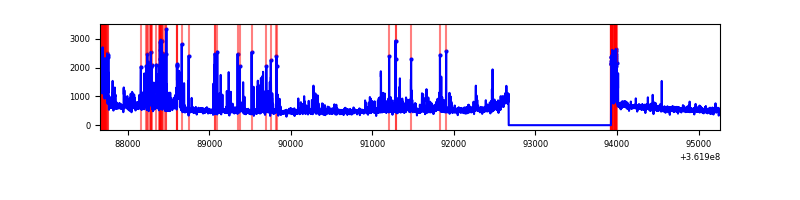 |
| D | 7600 | 6345 | 17 | 17 | 0.22% | 0.27% | 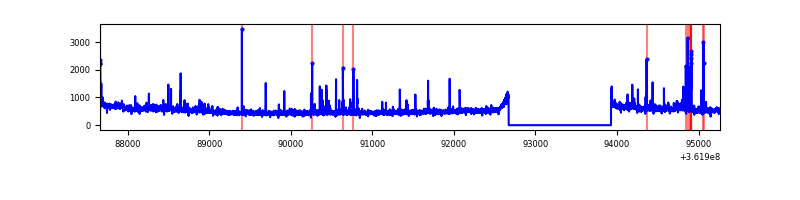 |
Top three noisy pixels from each quadrant. If the there are fewer than three noisy pixels in the level2.evt file, extra rows are filled as -1
| Pixel properties | Quadrant properties | ||||||
|---|---|---|---|---|---|---|---|
| Quadrant | DetID | PixID | Counts | Sigma | Mean | Median | Sigma |
| A | 13 | 254 | 12655 | 70.96 | 838 | 823 | 166.8 |
| A | 3 | 137 | 7811 | 41.91 | 838 | 823 | 166.8 |
| A | 0 | 226 | 7210 | 38.3 | 838 | 823 | 166.8 |
| B | 6 | 159 | 1768380 | 12396.88 | 765 | 749 | 142.6 |
| B | 5 | 172 | 1728433 | 12116.73 | 765 | 749 | 142.6 |
| B | 4 | 80 | 67573 | 468.66 | 765 | 749 | 142.6 |
| C | 0 | 10 | 784211 | 4275.25 | 792 | 798 | 183.2 |
| C | 14 | 238 | 128944 | 699.32 | 792 | 798 | 183.2 |
| C | 3 | 233 | 90640 | 490.29 | 792 | 798 | 183.2 |
| D | 8 | 195 | 206249 | 1082.04 | 806 | 788 | 189.9 |
| D | 2 | 250 | 47211 | 244.48 | 806 | 788 | 189.9 |
| D | 13 | 249 | 39496 | 203.85 | 806 | 788 | 189.9 |
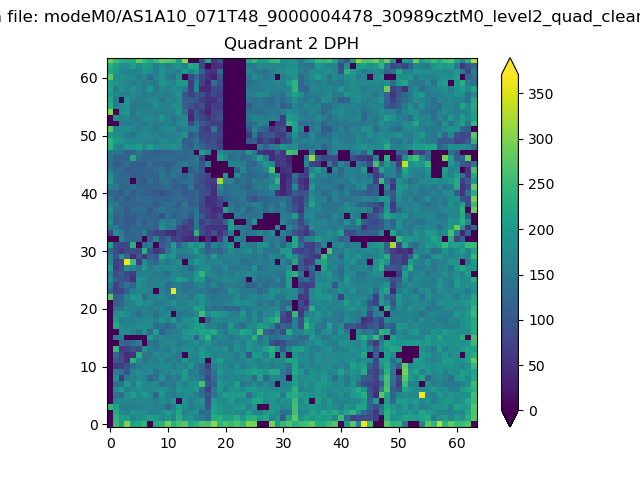
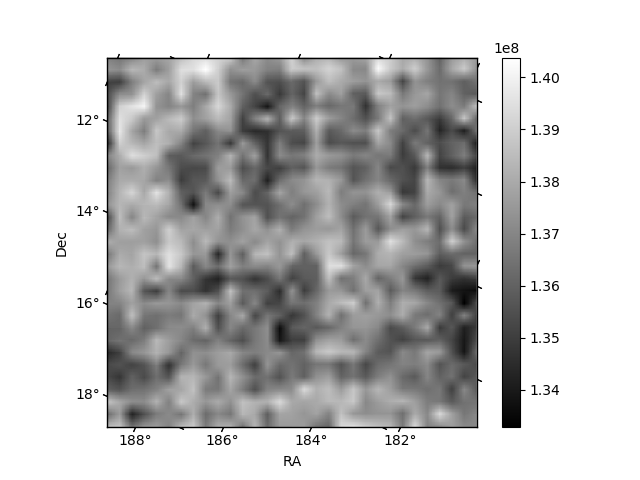
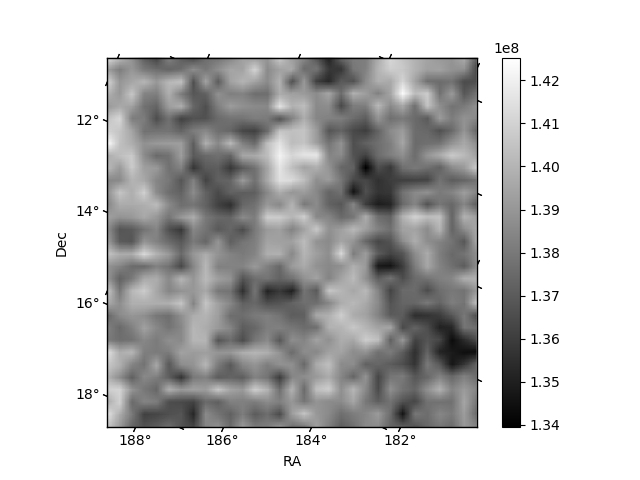
Histogram calculated using DETX and DETY for each event in the final _common_clean file
| Quadrant A | 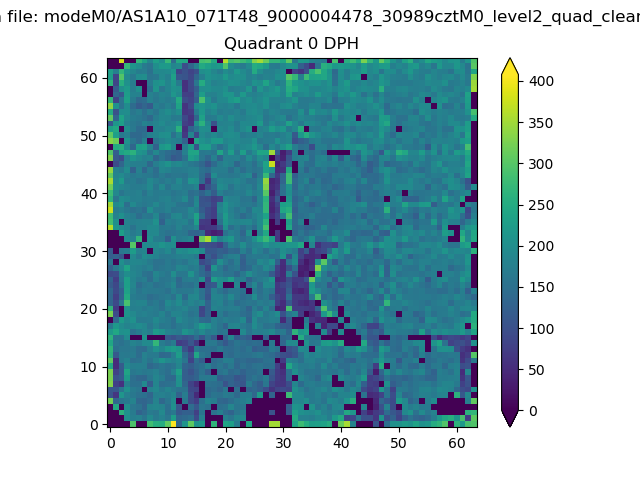 |
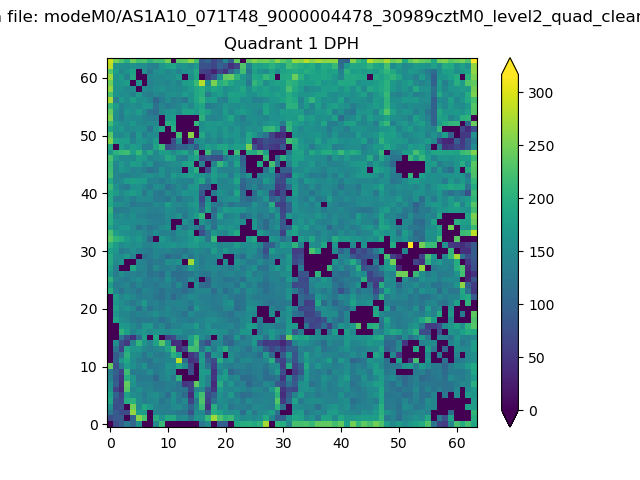 |
Quadrant B |
|---|---|---|---|
| Quadrant D | 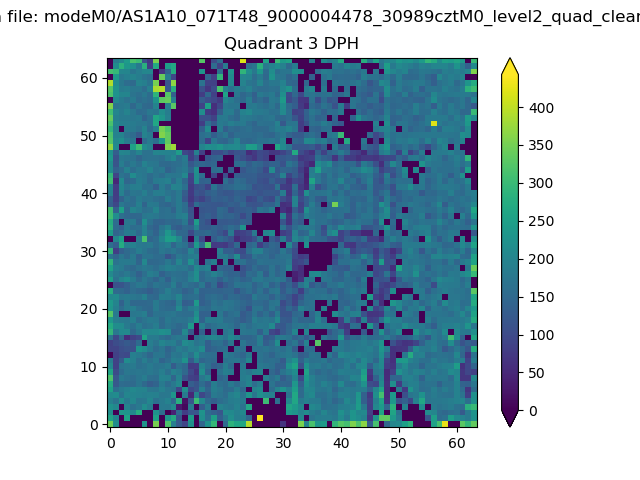 |
 |
Quadrant C |
| Plot type | Count rate plots | Images |
|---|---|---|
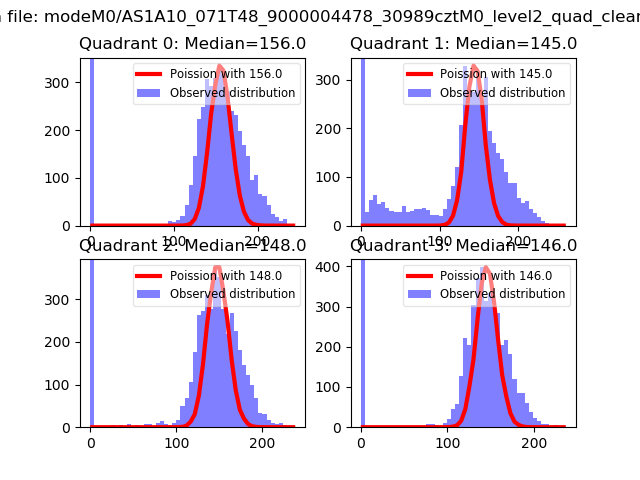
| Comparison with Poisson distribution Blue bars denote a histogram of data divided into 1 sec bins. Red curve is a Poisson curve with rate = median count rate of data. |
 |
 |
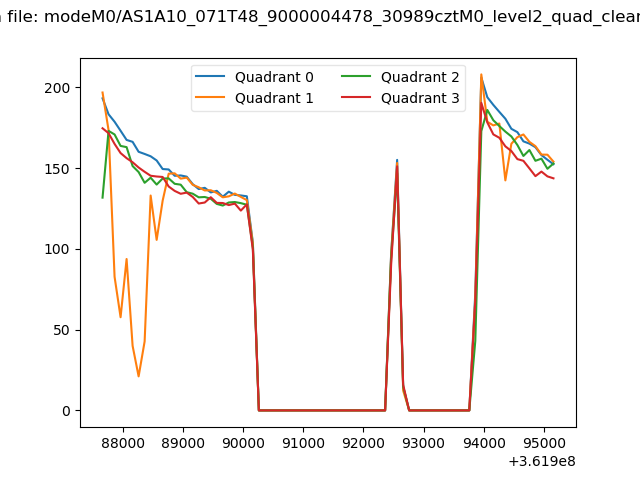
| Quadrant-wise count rates Data is divided into 100 sec bins |
 |
|
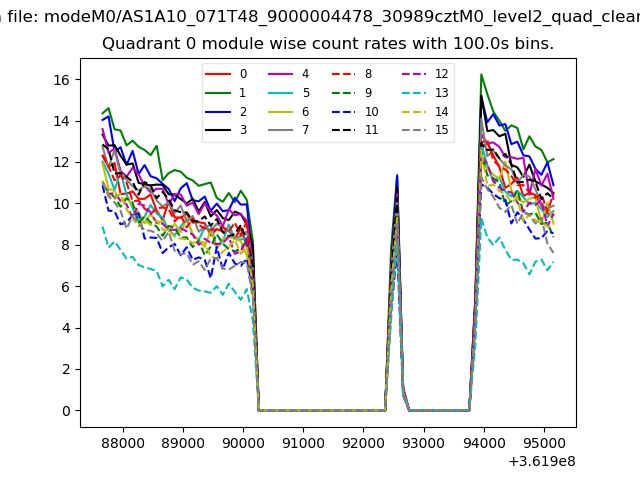
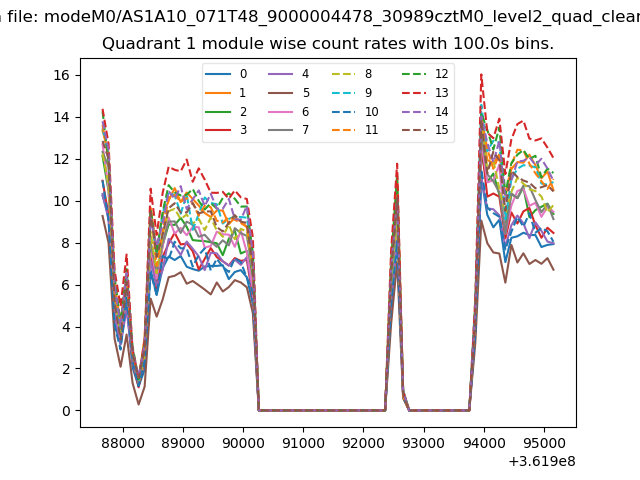
| Module-wise count rates for Quadrant A Data is divided into 100 sec bins |
 |
 |
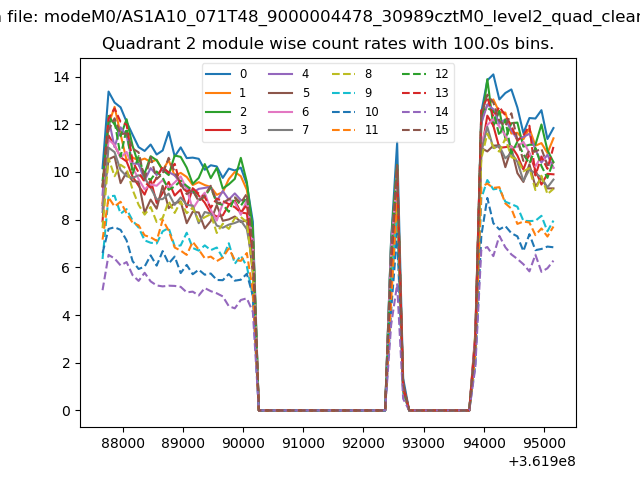
| Module-wise count rates for Quadrant B Data is divided into 100 sec bins |
 |
 |
| Module-wise count rates for Quadrant C Data is divided into 100 sec bins |
 |
 |
| Module-wise count rates for Quadrant D Data is divided into 100 sec bins |
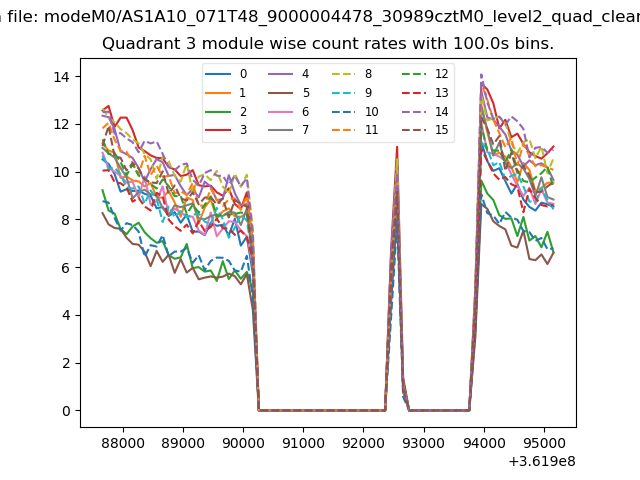 |
 |
| Parameter | Plot |
|---|---|
| CZT HV Monitor | 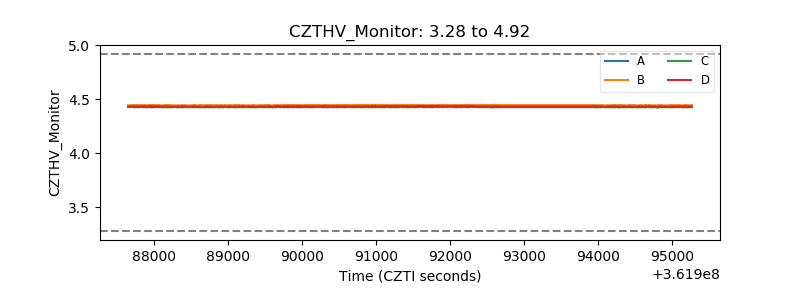 |
| D_VDD | 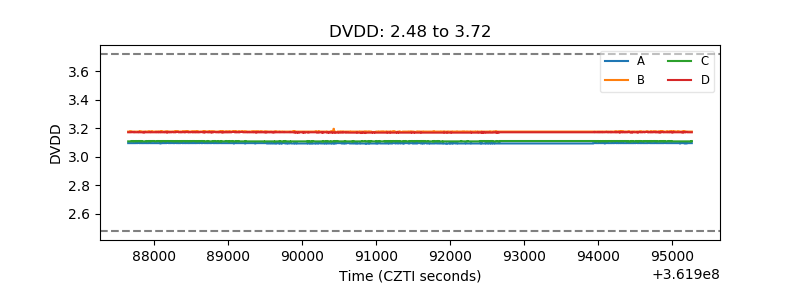 |
| Temperature 1 | 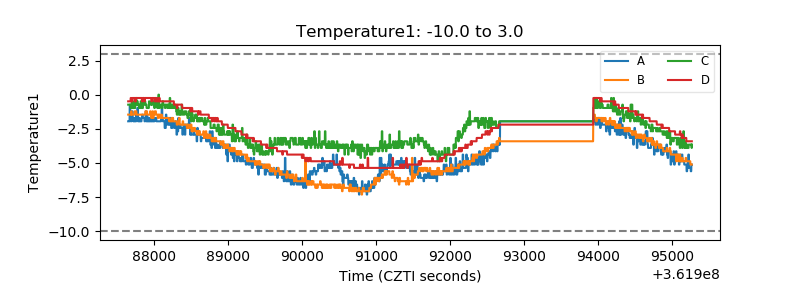 |
| Veto HV Monitor | 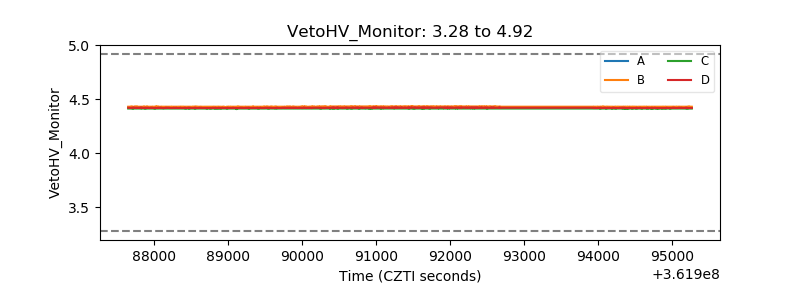 |
| Veto LLD | 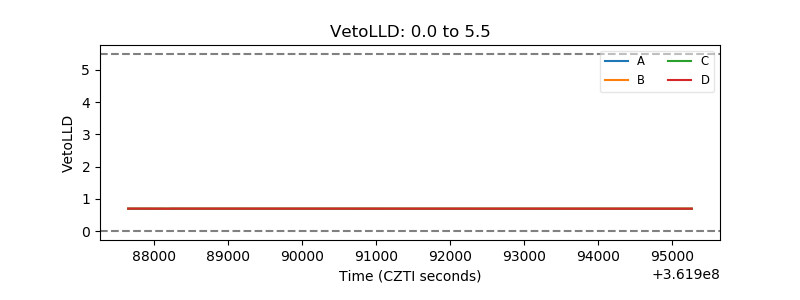 |
| Alpha Counter |  |
| _CPM_Rate |  |
| CZT Counter | 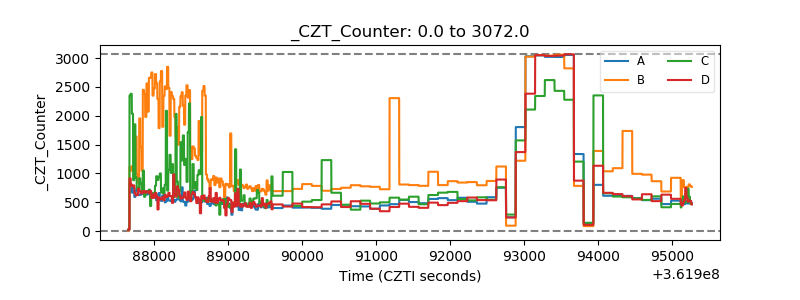 |
| +2.5 Volts monitor |  |
| +5 Volts monitor |  |
| _ROLL_ROT | 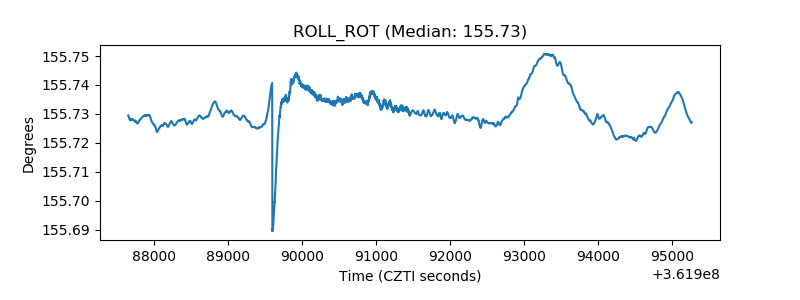 |
| _Roll_DEC | 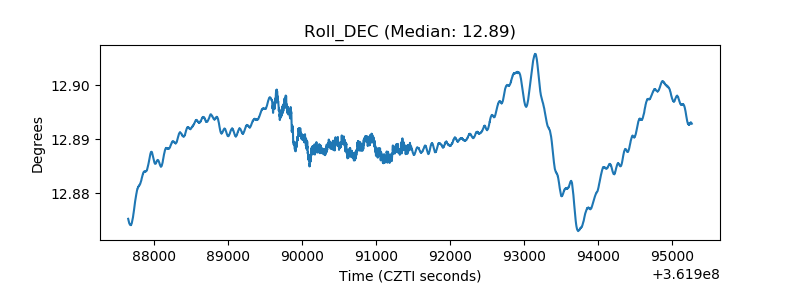 |
| _Roll_RA | 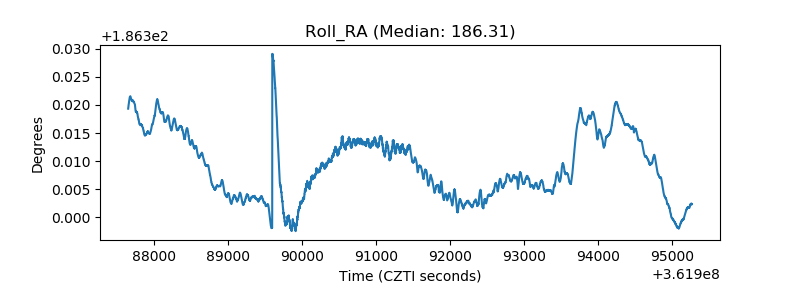 |
| Veto Counter | 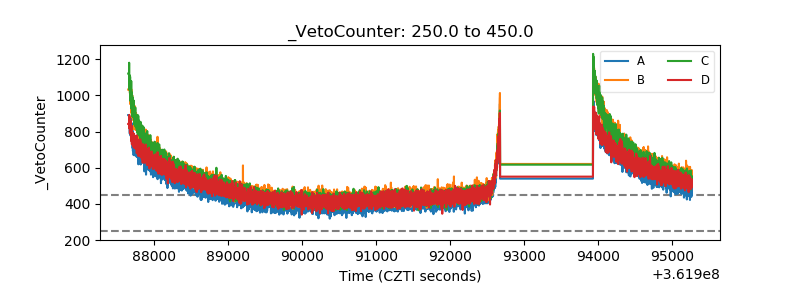 |