| Param | Original file | Final file |
|---|---|---|
| Filename | modeM0/AS1A10_071T48_9000004478_30990cztM0_level2.evt | modeM0/AS1A10_071T48_9000004478_30990cztM0_level2_quad_clean.evt |
| Size (bytes) | 556,171,200 | 95,495,040 |
| Size | 530.4 MB | 91.1 MB |
| Events in quadrant A | 3,186,864 | 642,261 |
| Events in quadrant B | 5,465,905 | 639,927 |
| Events in quadrant C | 3,703,632 | 601,441 |
| Events in quadrant D | 4,075,429 | 583,080 |
| Mode SS | |||
|---|---|---|---|
| Quadrant | BADHDUFLAG | Total packets | Discarded packets |
| A | 0 | 124 | 0 |
| B | 0 | 124 | 0 |
| C | 0 | 124 | 0 |
| D | 0 | 124 | 0 |
| Mode M9 | |||
|---|---|---|---|
| Quadrant | BADHDUFLAG | Total packets | Discarded packets |
| A | 0 | 18 | 0 |
| B | 0 | 19 | 0 |
| C | 0 | 19 | 0 |
| D | 0 | 19 | 0 |
| Mode M0 | |||
|---|---|---|---|
| Quadrant | BADHDUFLAG | Total packets | Discarded packets |
| A | 0 | 13221 | 2 |
| B | 0 | 20215 | 2 |
| C | 0 | 14791 | 2 |
| D | 0 | 16144 | 2 |
| Quadrant | Total seconds | Saturated seconds | Saturation percentage |
|---|---|---|---|
| A | 6088 | 33 | 0.542050% |
| B | 6088 | 257 | 4.221419% |
| C | 6088 | 210 | 3.449409% |
| D | 6088 | 54 | 0.886991% |
Noise dominated data is calculated using 1-second bins in cleaned event files. If a bin has >2000 counts, and if more than 50% of those come from <1% of pixels, then it is considered to be noise-dominated and hence unusable.
| Quadrant | # 1 sec bins | Bins with >0 counts | Bins with >2000 counts | High rate bins dominated by noise | Noise dominated (total time) | Noise dominated (detector-on time) | Marked lightcurve |
|---|---|---|---|---|---|---|---|
| A | 7438 | 6088 | 0 | 0 | 0.00% | 0.00% | 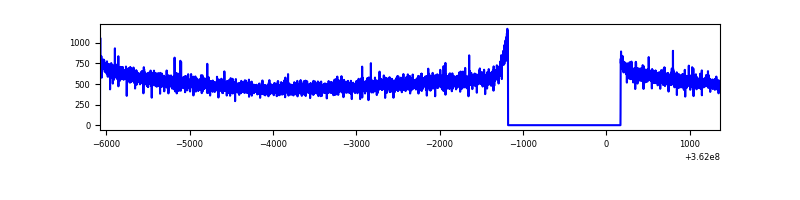 |
| B | 7438 | 6088 | 114 | 114 | 1.53% | 1.87% | 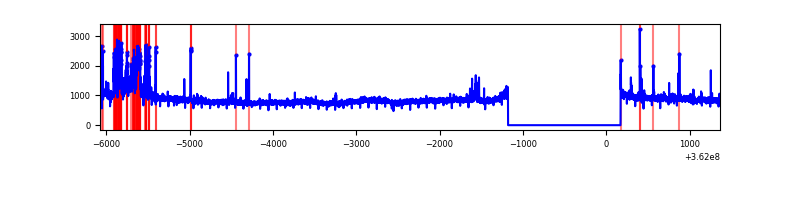 |
| C | 7438 | 6089 | 109 | 109 | 1.47% | 1.79% | 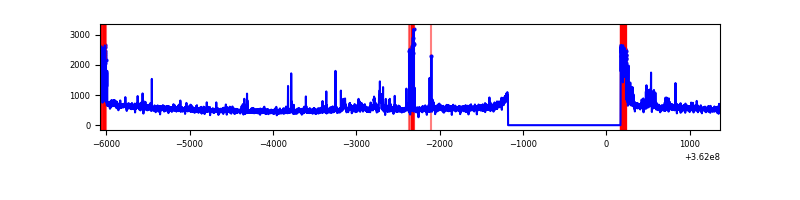 |
| D | 7438 | 6089 | 60 | 60 | 0.81% | 0.99% | 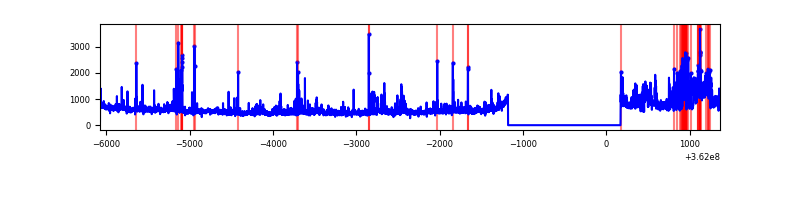 |
Top three noisy pixels from each quadrant. If the there are fewer than three noisy pixels in the level2.evt file, extra rows are filled as -1
| Pixel properties | Quadrant properties | ||||||
|---|---|---|---|---|---|---|---|
| Quadrant | DetID | PixID | Counts | Sigma | Mean | Median | Sigma |
| A | 13 | 254 | 11282 | 63.69 | 825 | 812 | 164.4 |
| A | 3 | 137 | 7668 | 41.7 | 825 | 812 | 164.4 |
| A | 0 | 226 | 7127 | 38.41 | 825 | 812 | 164.4 |
| B | 6 | 159 | 1787330 | 11895.23 | 817 | 799 | 150.2 |
| B | 5 | 172 | 336752 | 2236.87 | 817 | 799 | 150.2 |
| B | 0 | 190 | 37738 | 245.95 | 817 | 799 | 150.2 |
| C | 0 | 10 | 438483 | 2406.07 | 779 | 787 | 181.9 |
| C | 14 | 238 | 130411 | 712.56 | 779 | 787 | 181.9 |
| C | 14 | 67 | 41713 | 224.98 | 779 | 787 | 181.9 |
| D | 12 | 218 | 329472 | 1788.87 | 784 | 766 | 183.8 |
| D | 13 | 174 | 274612 | 1490.32 | 784 | 766 | 183.8 |
| D | 8 | 195 | 247787 | 1344.33 | 784 | 766 | 183.8 |
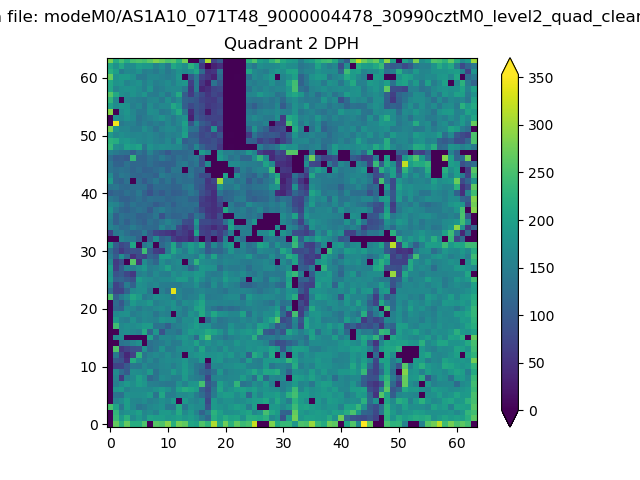
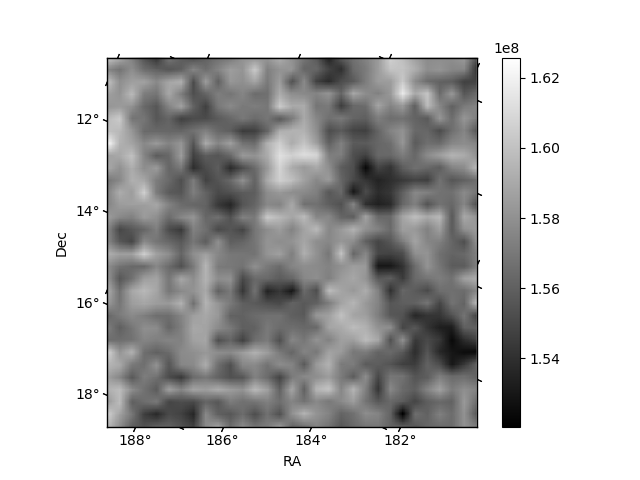
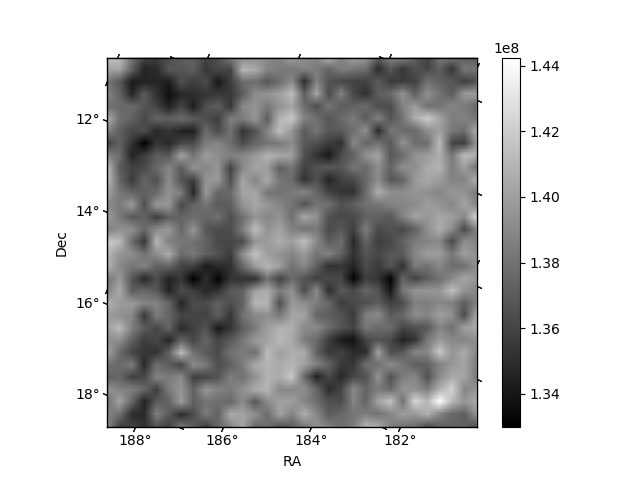
Histogram calculated using DETX and DETY for each event in the final _common_clean file
| Quadrant A | 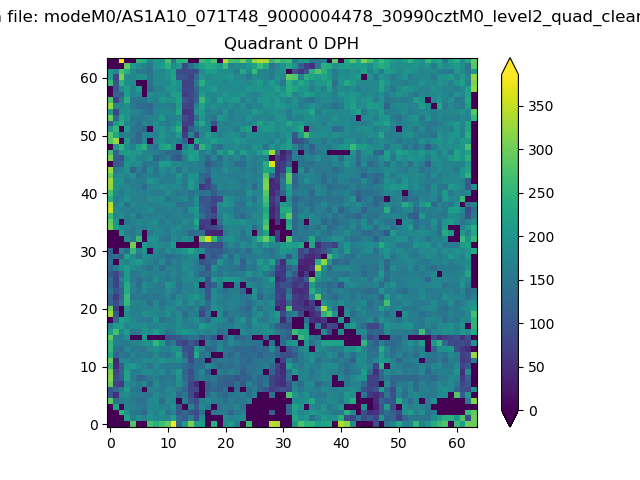 |
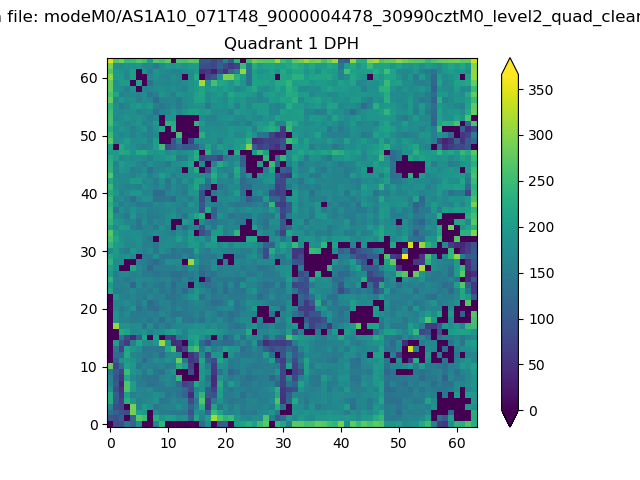 |
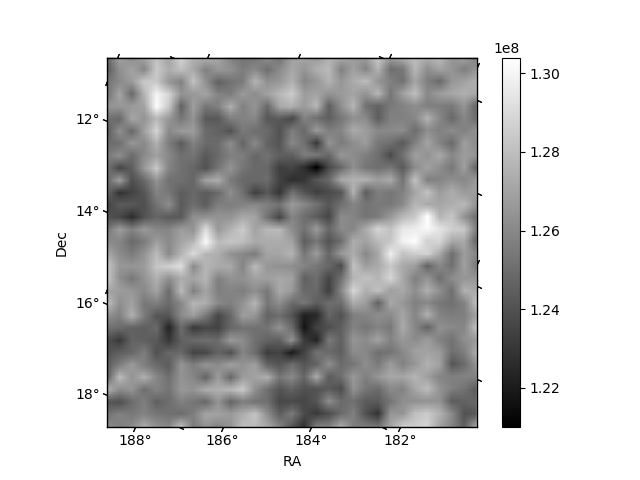
Quadrant B |
|---|---|---|---|
| Quadrant D | 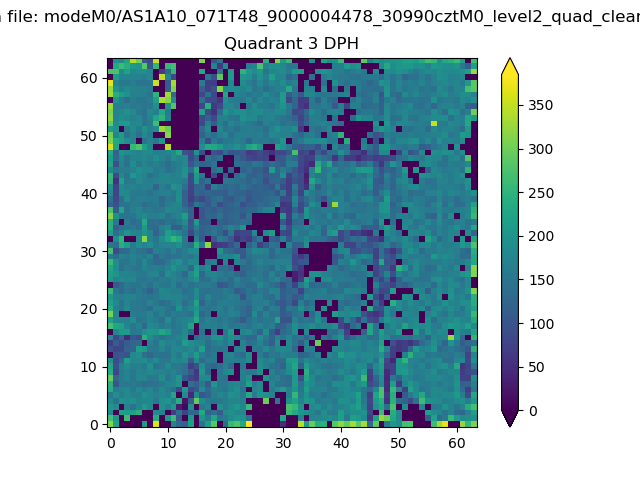 |
 |
Quadrant C |
| Plot type | Count rate plots | Images |
|---|---|---|
| Comparison with Poisson distribution Blue bars denote a histogram of data divided into 1 sec bins. Red curve is a Poisson curve with rate = median count rate of data. |
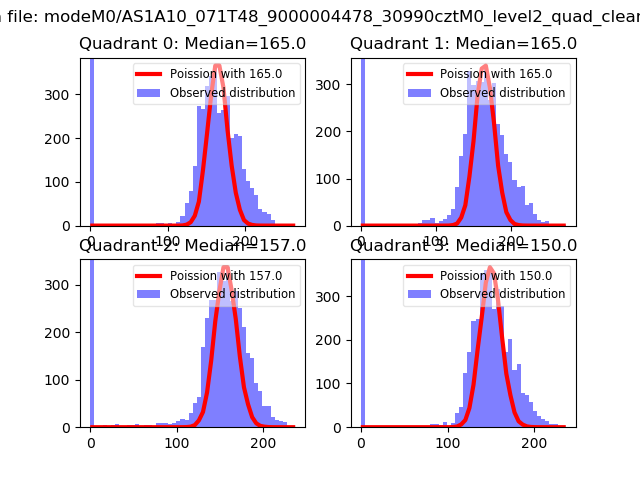 |
 |
| Quadrant-wise count rates Data is divided into 100 sec bins |
 |
|
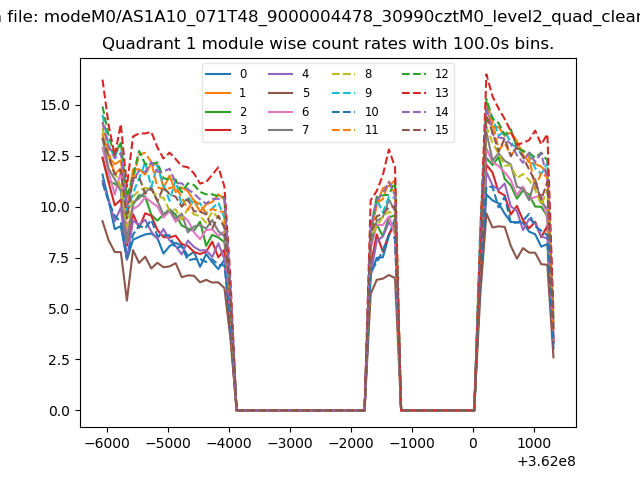
| Module-wise count rates for Quadrant A Data is divided into 100 sec bins |
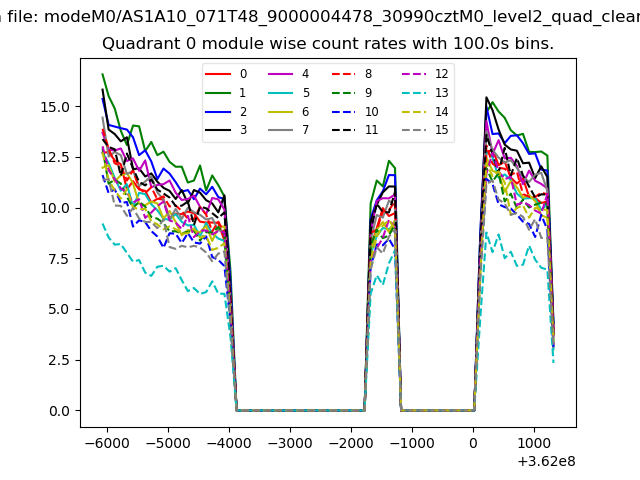 |
 |
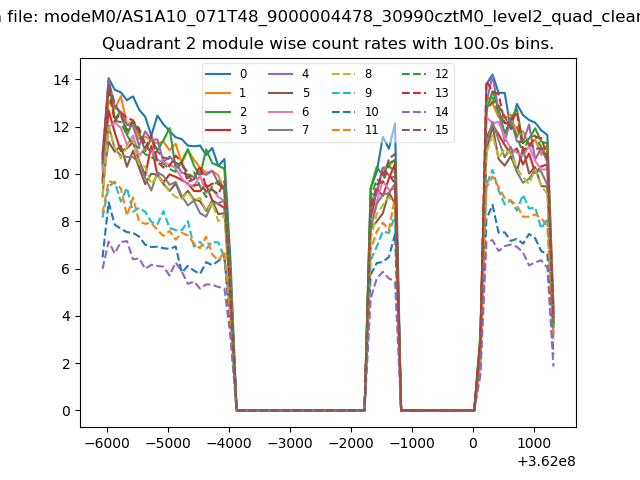
| Module-wise count rates for Quadrant B Data is divided into 100 sec bins |
 |
 |
| Module-wise count rates for Quadrant C Data is divided into 100 sec bins |
 |
 |
| Module-wise count rates for Quadrant D Data is divided into 100 sec bins |
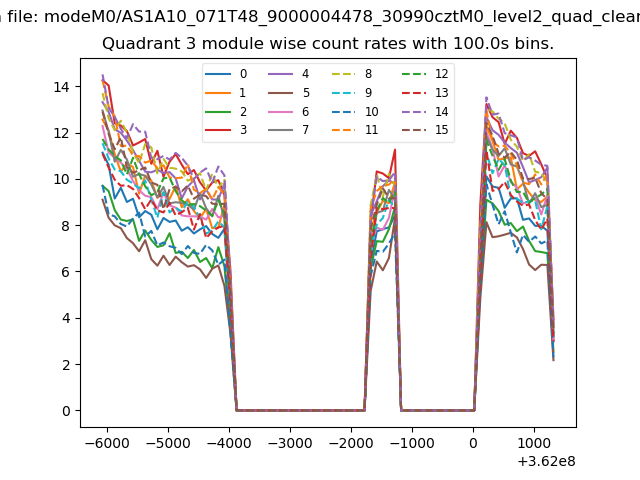 |
 |
| Parameter | Plot |
|---|---|
| CZT HV Monitor | 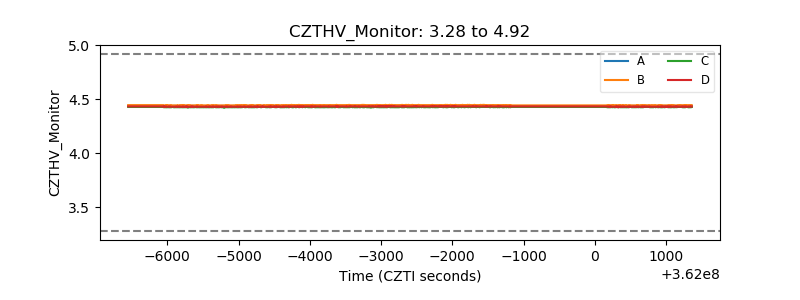 |
| D_VDD | 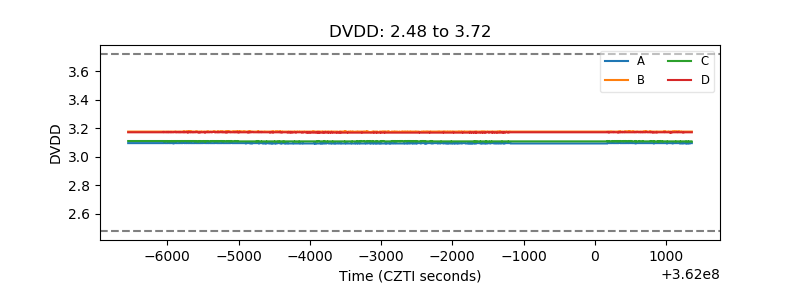 |
| Temperature 1 | 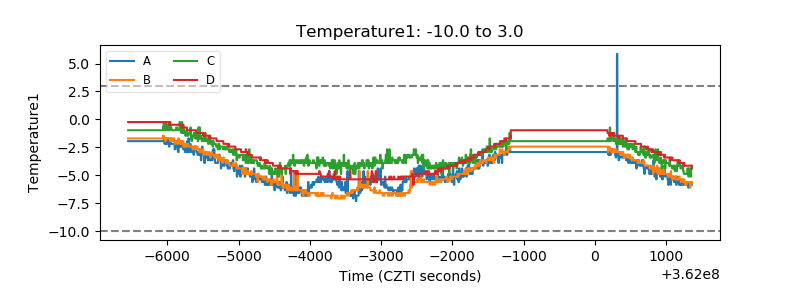 |
| Veto HV Monitor | 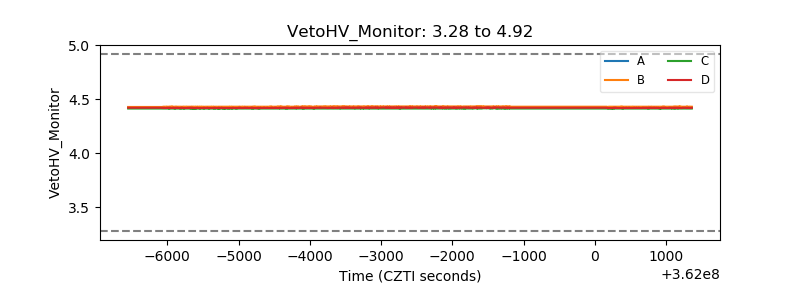 |
| Veto LLD | 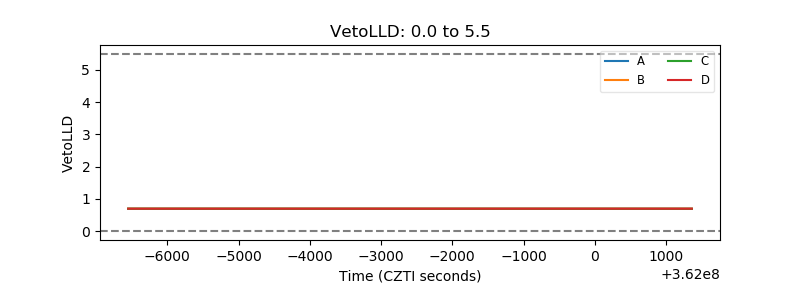 |
| Alpha Counter | 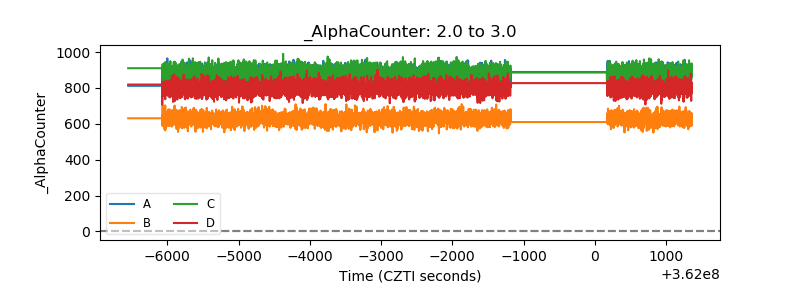 |
| _CPM_Rate | 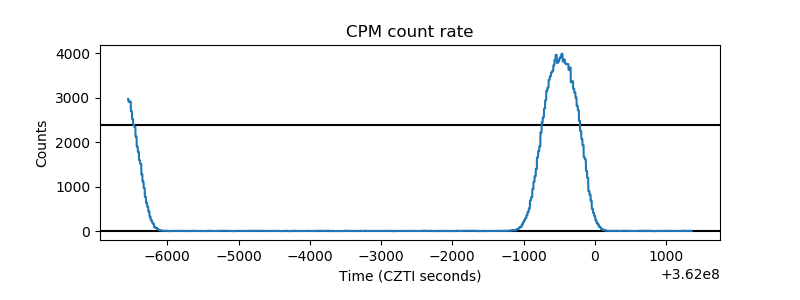 |
| CZT Counter | 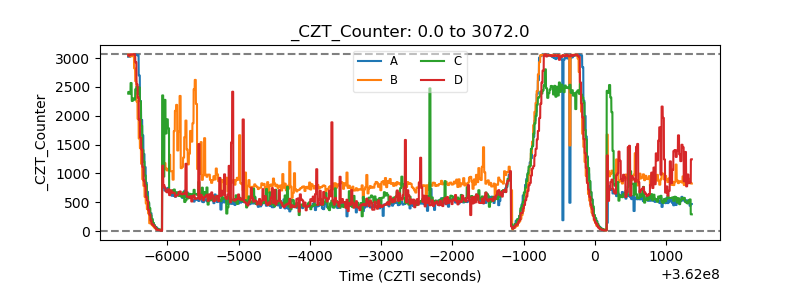 |
| +2.5 Volts monitor |  |
| +5 Volts monitor |  |
| _ROLL_ROT | 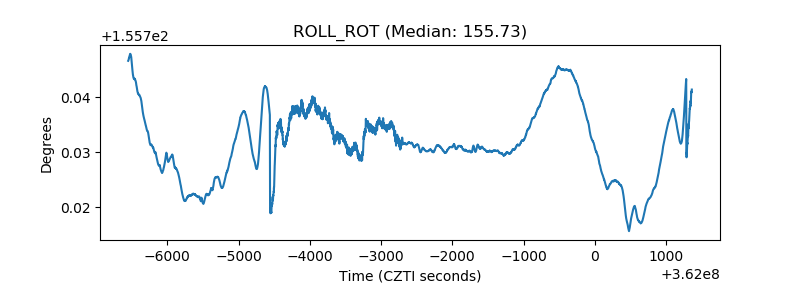 |
| _Roll_DEC | 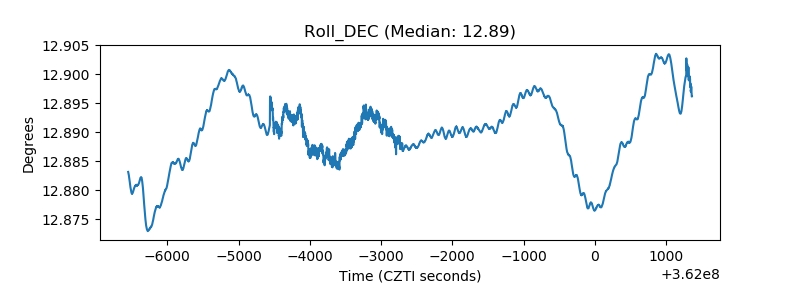 |
| _Roll_RA | 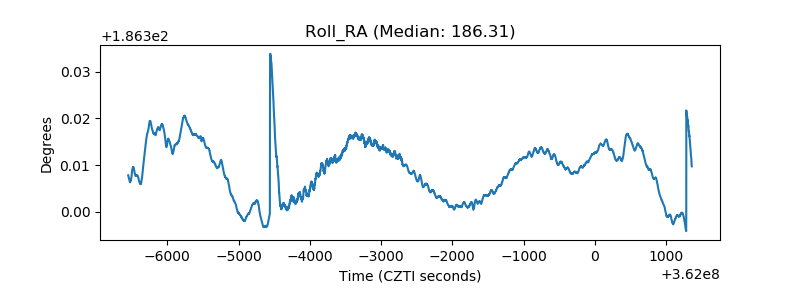 |
| Veto Counter | 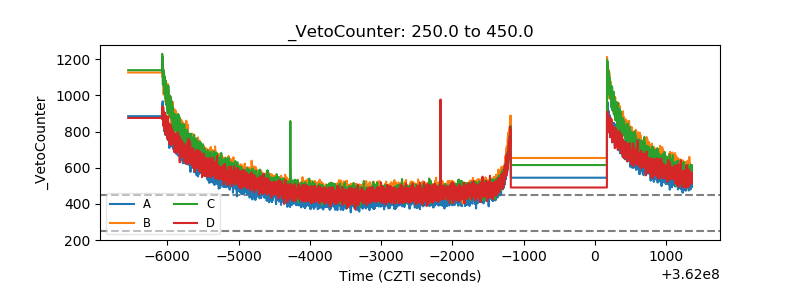 |