| Param | Original file | Final file |
|---|---|---|
| Filename | modeM0/AS1A10_071T48_9000004478_30991cztM0_level2.evt | modeM0/AS1A10_071T48_9000004478_30991cztM0_level2_quad_clean.evt |
| Size (bytes) | 562,285,440 | 97,882,560 |
| Size | 536.2 MB | 93.3 MB |
| Events in quadrant A | 3,248,348 | 659,618 |
| Events in quadrant B | 5,249,062 | 671,780 |
| Events in quadrant C | 3,779,449 | 608,905 |
| Events in quadrant D | 4,334,087 | 592,513 |
| Mode SS | |||
|---|---|---|---|
| Quadrant | BADHDUFLAG | Total packets | Discarded packets |
| A | 0 | 126 | 0 |
| B | 0 | 126 | 0 |
| C | 0 | 126 | 0 |
| D | 0 | 126 | 0 |
| Mode M9 | |||
|---|---|---|---|
| Quadrant | BADHDUFLAG | Total packets | Discarded packets |
| A | 0 | 23 | 0 |
| B | 0 | 24 | 0 |
| C | 0 | 24 | 0 |
| D | 0 | 24 | 0 |
| Mode M0 | |||
|---|---|---|---|
| Quadrant | BADHDUFLAG | Total packets | Discarded packets |
| A | 0 | 13322 | 2 |
| B | 0 | 19389 | 2 |
| C | 0 | 15030 | 2 |
| D | 0 | 16906 | 2 |
| Quadrant | Total seconds | Saturated seconds | Saturation percentage |
|---|---|---|---|
| A | 6178 | 15 | 0.242797% |
| B | 6178 | 84 | 1.359663% |
| C | 6178 | 214 | 3.463904% |
| D | 6178 | 56 | 0.906442% |
Noise dominated data is calculated using 1-second bins in cleaned event files. If a bin has >2000 counts, and if more than 50% of those come from <1% of pixels, then it is considered to be noise-dominated and hence unusable.
| Quadrant | # 1 sec bins | Bins with >0 counts | Bins with >2000 counts | High rate bins dominated by noise | Noise dominated (total time) | Noise dominated (detector-on time) | Marked lightcurve |
|---|---|---|---|---|---|---|---|
| A | 7593 | 6179 | 0 | 0 | 0.00% | 0.00% | 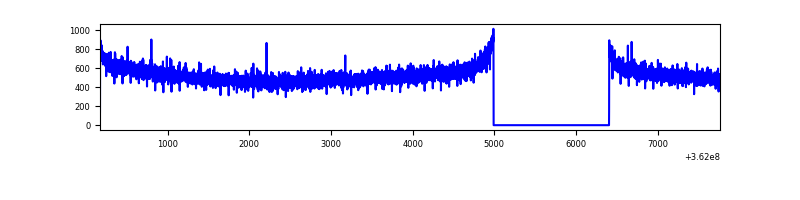 |
| B | 7593 | 6179 | 7 | 7 | 0.09% | 0.11% | 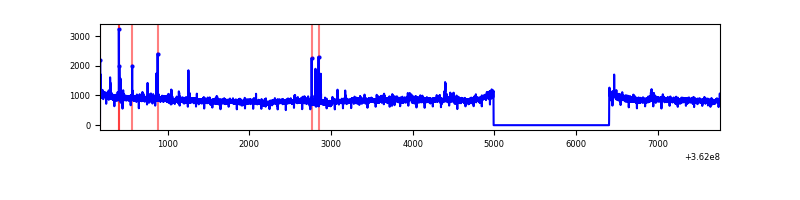 |
| C | 7593 | 6179 | 133 | 133 | 1.75% | 2.15% | 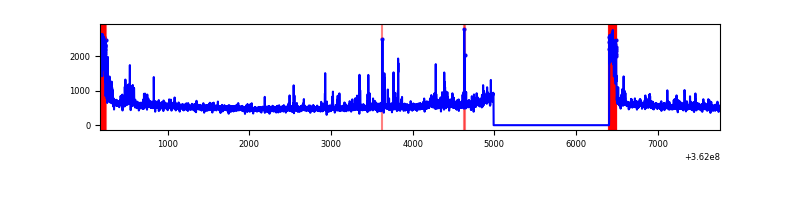 |
| D | 7593 | 6179 | 67 | 67 | 0.88% | 1.08% | 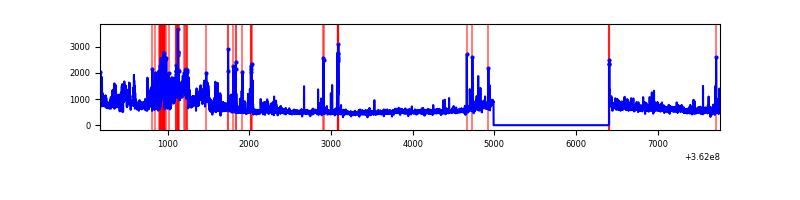 |
Top three noisy pixels from each quadrant. If the there are fewer than three noisy pixels in the level2.evt file, extra rows are filled as -1
| Pixel properties | Quadrant properties | ||||||
|---|---|---|---|---|---|---|---|
| Quadrant | DetID | PixID | Counts | Sigma | Mean | Median | Sigma |
| A | 13 | 254 | 11409 | 63.54 | 841 | 827 | 166.6 |
| A | 3 | 137 | 7844 | 42.13 | 841 | 827 | 166.6 |
| A | 0 | 226 | 7322 | 39.0 | 841 | 827 | 166.6 |
| B | 6 | 159 | 1801860 | 11483.82 | 843 | 827 | 156.8 |
| B | 0 | 229 | 39768 | 248.3 | 843 | 827 | 156.8 |
| B | 0 | 190 | 29069 | 180.08 | 843 | 827 | 156.8 |
| C | 0 | 10 | 484389 | 2638.75 | 788 | 795 | 183.3 |
| C | 14 | 238 | 129895 | 704.44 | 788 | 795 | 183.3 |
| C | 3 | 233 | 38305 | 204.67 | 788 | 795 | 183.3 |
| D | 12 | 218 | 459334 | 2434.55 | 793 | 773 | 188.4 |
| D | 8 | 195 | 277888 | 1471.23 | 793 | 773 | 188.4 |
| D | 13 | 174 | 251109 | 1329.06 | 793 | 773 | 188.4 |
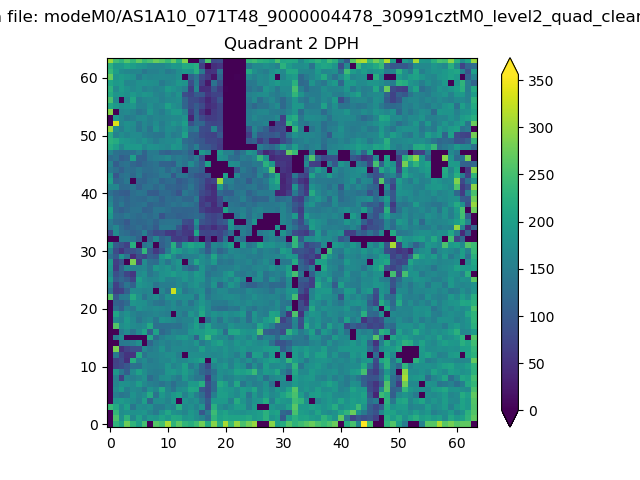
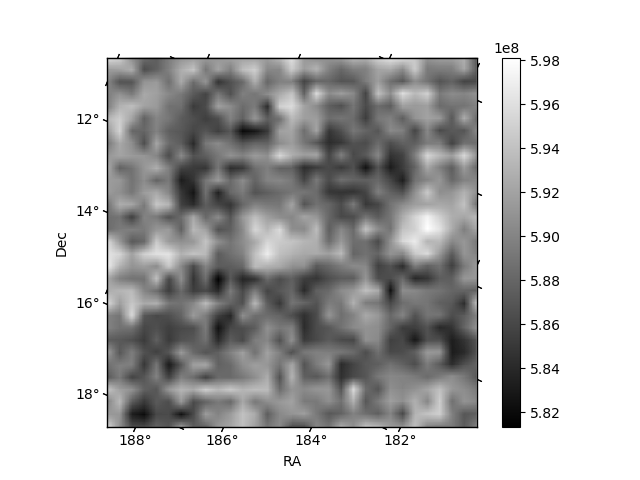
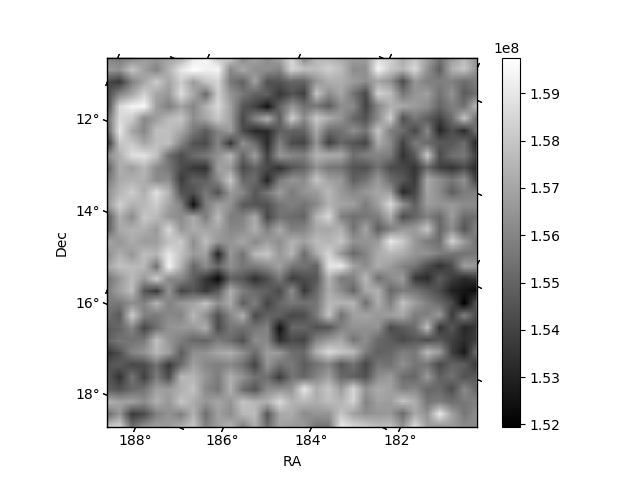
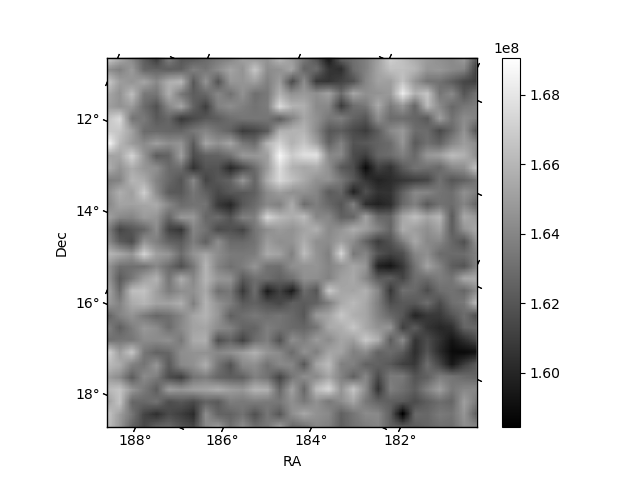
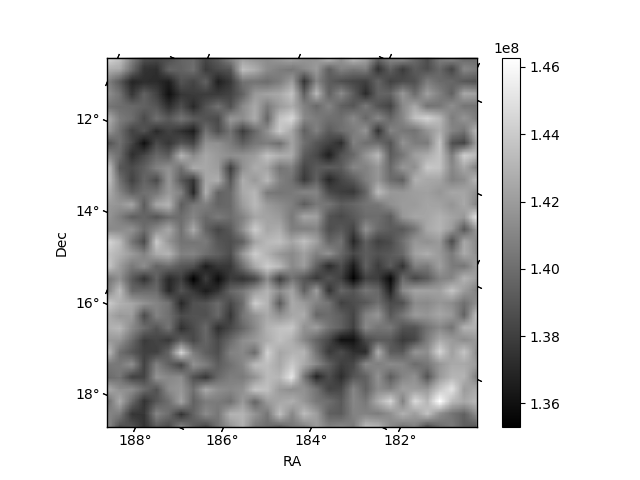
Histogram calculated using DETX and DETY for each event in the final _common_clean file
| Quadrant A | 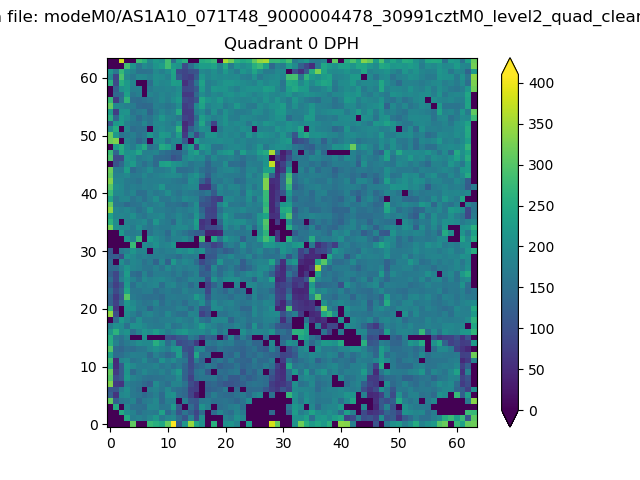 |
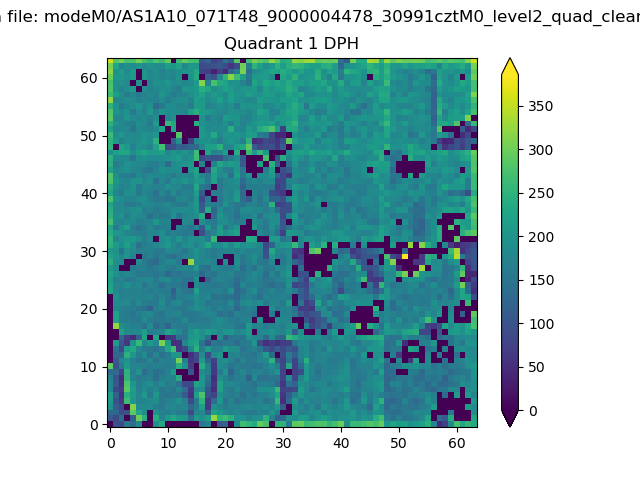 |
Quadrant B |
|---|---|---|---|
| Quadrant D | 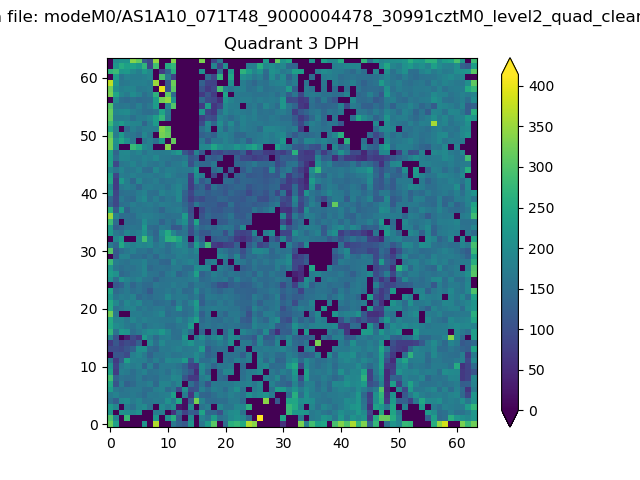 |
 |
Quadrant C |
| Plot type | Count rate plots | Images |
|---|---|---|
| Comparison with Poisson distribution Blue bars denote a histogram of data divided into 1 sec bins. Red curve is a Poisson curve with rate = median count rate of data. |
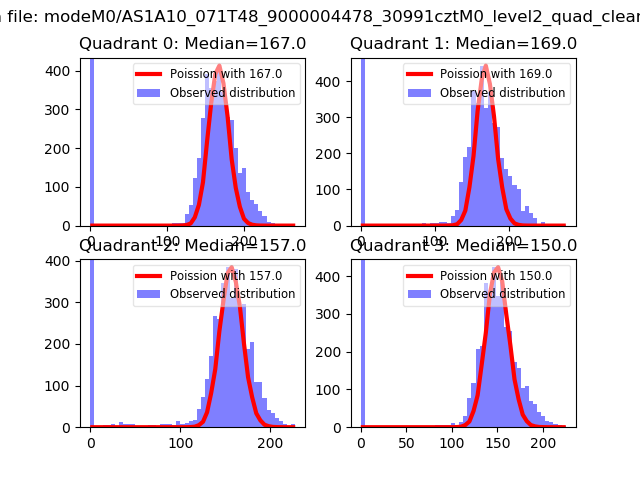 |
 |
| Quadrant-wise count rates Data is divided into 100 sec bins |
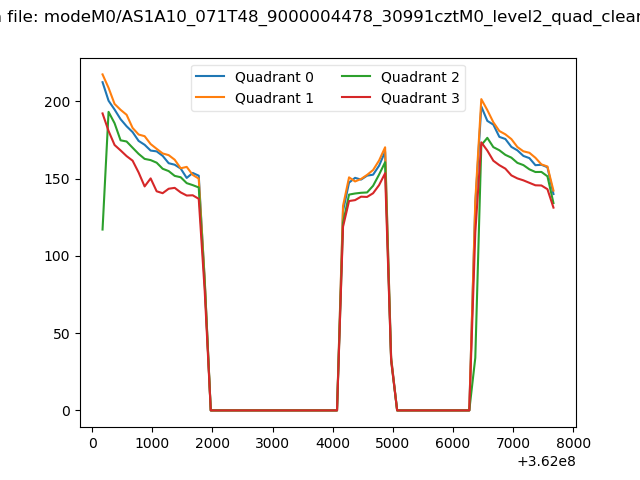 |
|
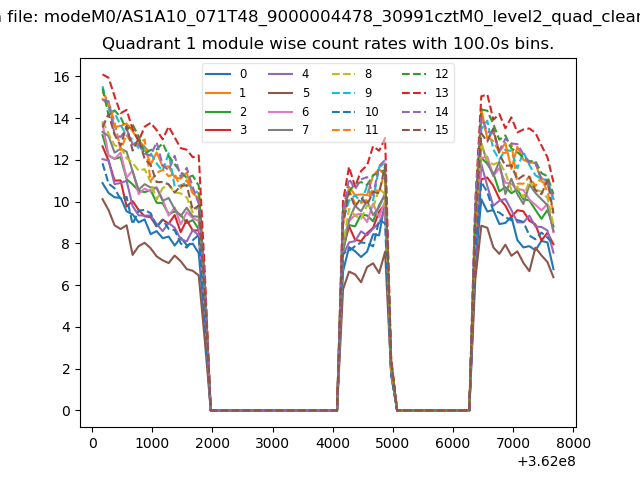
| Module-wise count rates for Quadrant A Data is divided into 100 sec bins |
 |
 |
| Module-wise count rates for Quadrant B Data is divided into 100 sec bins |
 |
 |
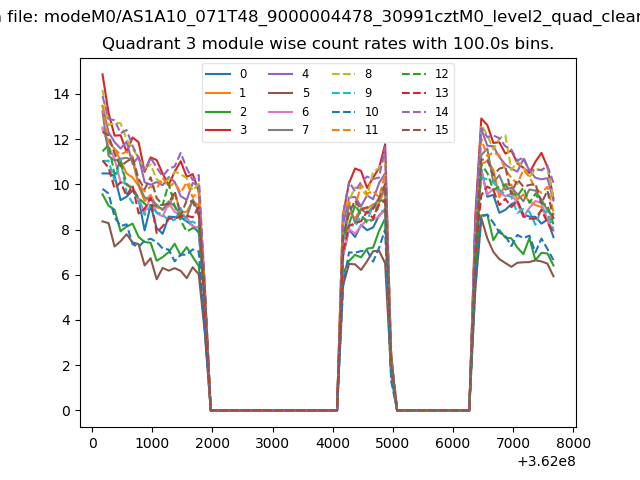
| Module-wise count rates for Quadrant C Data is divided into 100 sec bins |
 |
 |
| Module-wise count rates for Quadrant D Data is divided into 100 sec bins |
 |
 |
| Parameter | Plot |
|---|---|
| CZT HV Monitor |  |
| D_VDD | 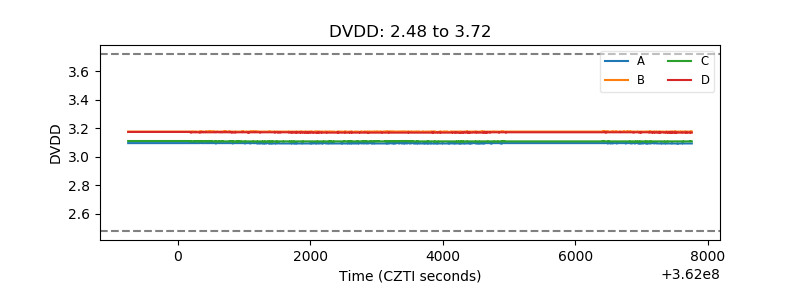 |
| Temperature 1 | 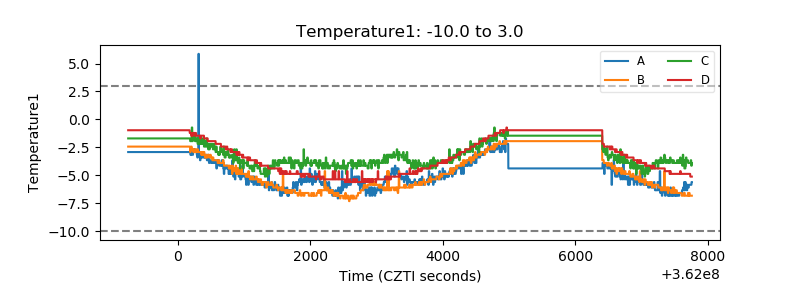 |
| Veto HV Monitor | 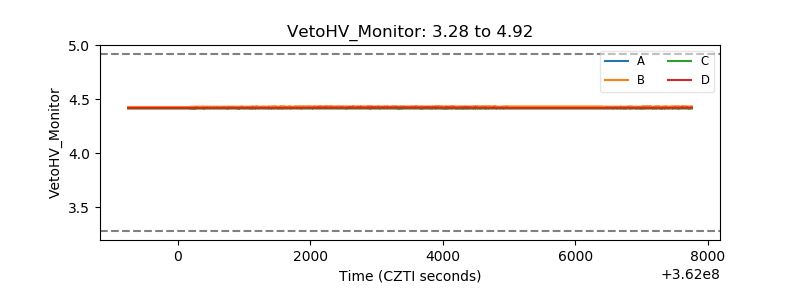 |
| Veto LLD | 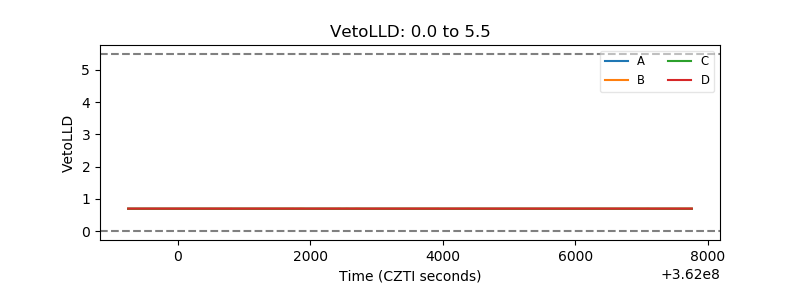 |
| Alpha Counter | 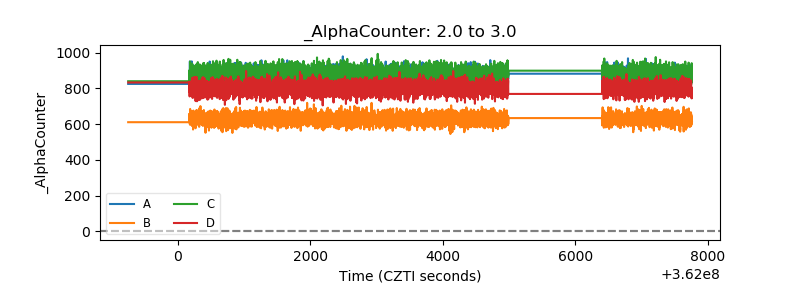 |
| _CPM_Rate | 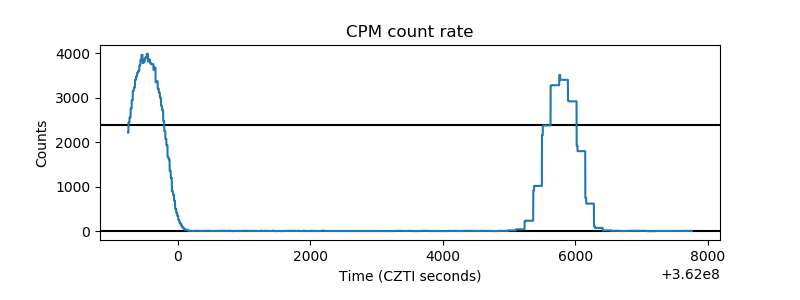 |
| CZT Counter | 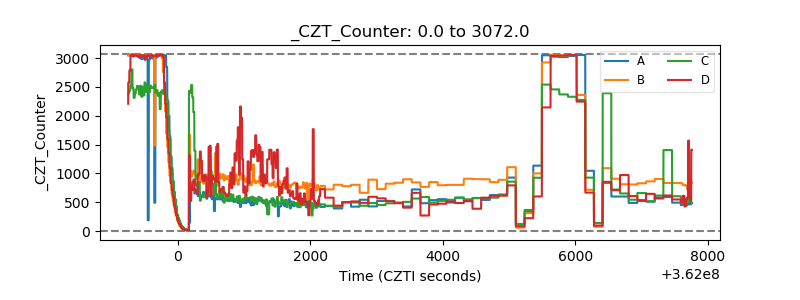 |
| +2.5 Volts monitor |  |
| +5 Volts monitor |  |
| _ROLL_ROT | 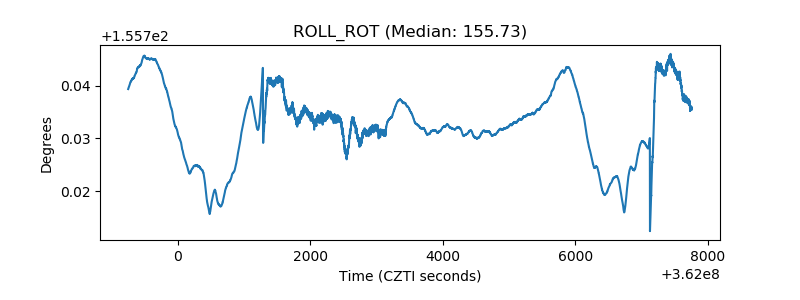 |
| _Roll_DEC | 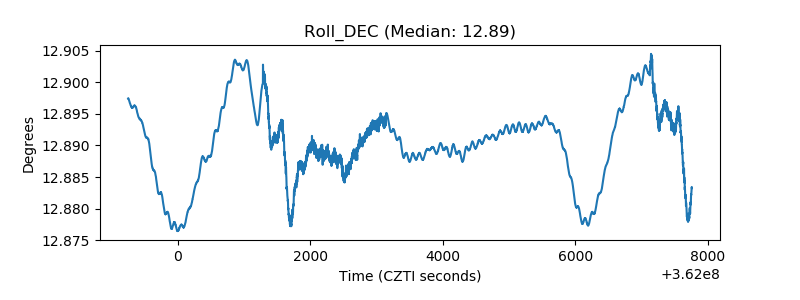 |
| _Roll_RA | 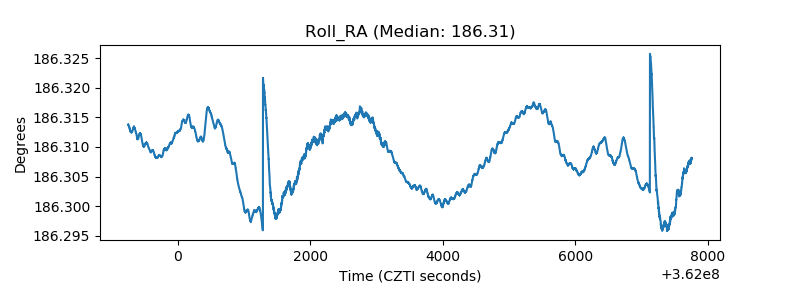 |
| Veto Counter |  |