| Param | Original file | Final file |
|---|---|---|
| Filename | modeM0/AS1A10_071T48_9000004478_30993cztM0_level2.evt | modeM0/AS1A10_071T48_9000004478_30993cztM0_level2_quad_clean.evt |
| Size (bytes) | 596,692,800 | 79,735,680 |
| Size | 569.1 MB | 76.0 MB |
| Events in quadrant A | 3,284,289 | 510,722 |
| Events in quadrant B | 5,347,471 | 513,599 |
| Events in quadrant C | 3,841,881 | 473,999 |
| Events in quadrant D | 5,159,419 | 464,327 |
| Mode SS | |||
|---|---|---|---|
| Quadrant | BADHDUFLAG | Total packets | Discarded packets |
| A | 0 | 132 | 0 |
| B | 0 | 132 | 0 |
| C | 0 | 132 | 0 |
| D | 0 | 132 | 0 |
| Mode M9 | |||
|---|---|---|---|
| Quadrant | BADHDUFLAG | Total packets | Discarded packets |
| A | 0 | 11 | 0 |
| B | 0 | 11 | 0 |
| C | 0 | 11 | 0 |
| D | 0 | 11 | 0 |
| Mode M0 | |||
|---|---|---|---|
| Quadrant | BADHDUFLAG | Total packets | Discarded packets |
| A | 0 | 13566 | 3 |
| B | 0 | 20197 | 3 |
| C | 0 | 15240 | 3 |
| D | 0 | 20053 | 3 |
| Quadrant | Total seconds | Saturated seconds | Saturation percentage |
|---|---|---|---|
| A | 6473 | 42 | 0.648849% |
| B | 6473 | 144 | 2.224625% |
| C | 6473 | 256 | 3.954890% |
| D | 6474 | 123 | 1.899907% |
Noise dominated data is calculated using 1-second bins in cleaned event files. If a bin has >2000 counts, and if more than 50% of those come from <1% of pixels, then it is considered to be noise-dominated and hence unusable.
| Quadrant | # 1 sec bins | Bins with >0 counts | Bins with >2000 counts | High rate bins dominated by noise | Noise dominated (total time) | Noise dominated (detector-on time) | Marked lightcurve |
|---|---|---|---|---|---|---|---|
| A | 7608 | 6474 | 0 | 0 | 0.00% | 0.00% | 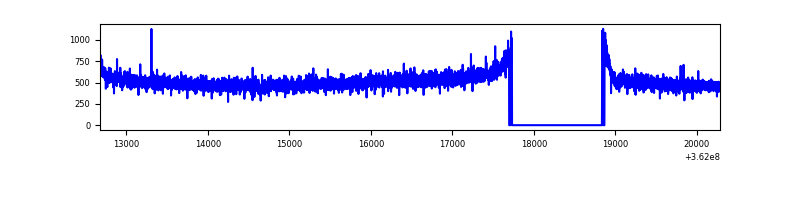 |
| B | 7608 | 6475 | 32 | 32 | 0.42% | 0.49% | 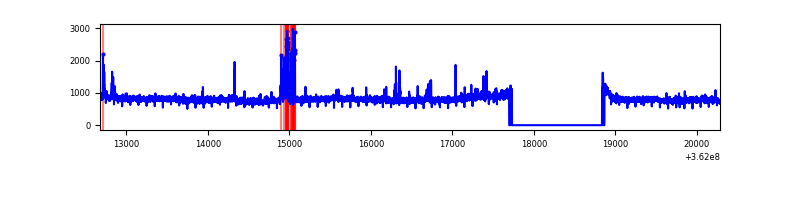 |
| C | 7608 | 6475 | 108 | 108 | 1.42% | 1.67% | 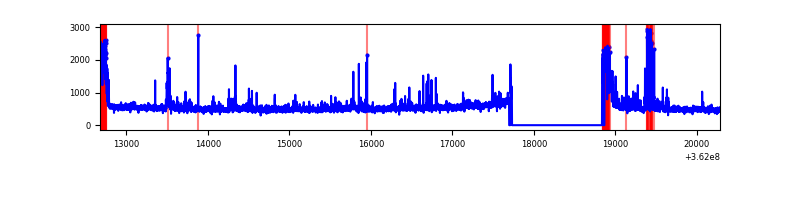 |
| D | 7609 | 6477 | 39 | 39 | 0.51% | 0.60% | 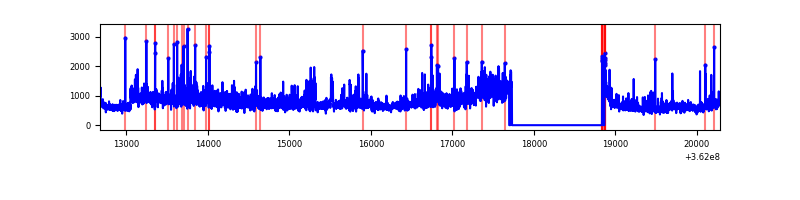 |
Top three noisy pixels from each quadrant. If the there are fewer than three noisy pixels in the level2.evt file, extra rows are filled as -1
| Pixel properties | Quadrant properties | ||||||
|---|---|---|---|---|---|---|---|
| Quadrant | DetID | PixID | Counts | Sigma | Mean | Median | Sigma |
| A | 11 | 47 | 45027 | 262.78 | 840 | 823 | 168.2 |
| A | 13 | 254 | 11647 | 64.35 | 840 | 823 | 168.2 |
| A | 3 | 137 | 8231 | 44.04 | 840 | 823 | 168.2 |
| B | 6 | 159 | 1833216 | 11534.62 | 832 | 812 | 158.9 |
| B | 4 | 80 | 153902 | 963.67 | 832 | 812 | 158.9 |
| B | 0 | 190 | 31304 | 191.94 | 832 | 812 | 158.9 |
| C | 0 | 10 | 556893 | 3025.04 | 787 | 793 | 183.8 |
| C | 14 | 238 | 128816 | 696.41 | 787 | 793 | 183.8 |
| C | 3 | 233 | 45050 | 240.75 | 787 | 793 | 183.8 |
| D | 13 | 174 | 1592311 | 8426.7 | 792 | 774 | 188.9 |
| D | 1 | 239 | 175379 | 924.48 | 792 | 774 | 188.9 |
| D | 8 | 195 | 170359 | 897.9 | 792 | 774 | 188.9 |
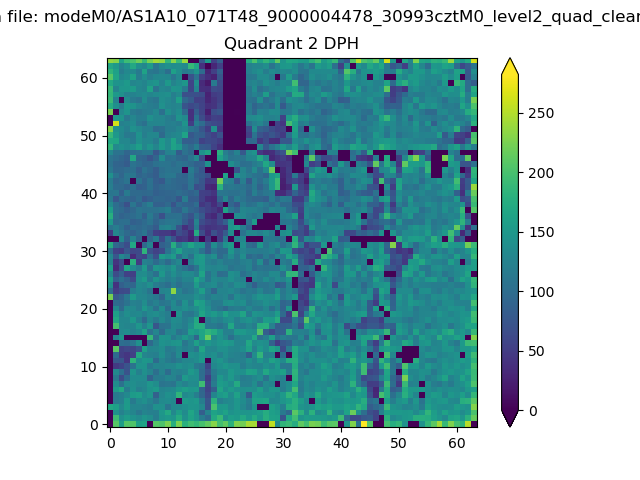
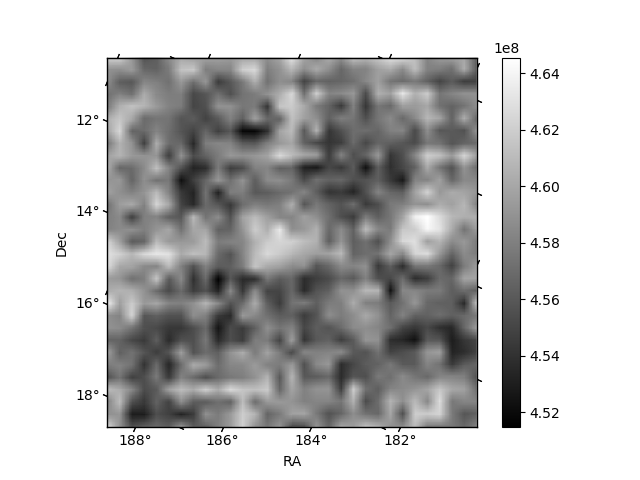
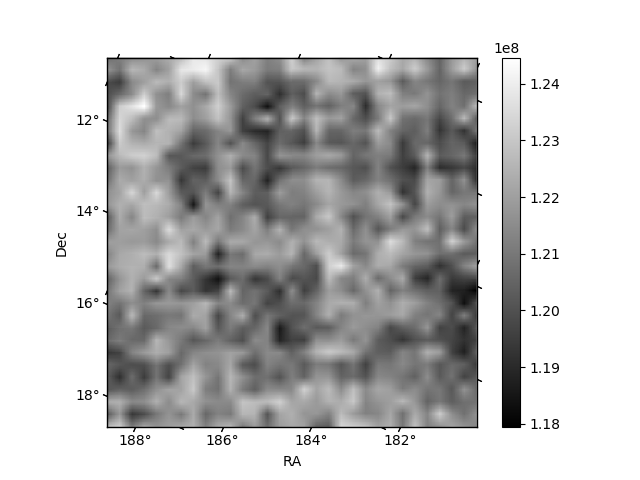
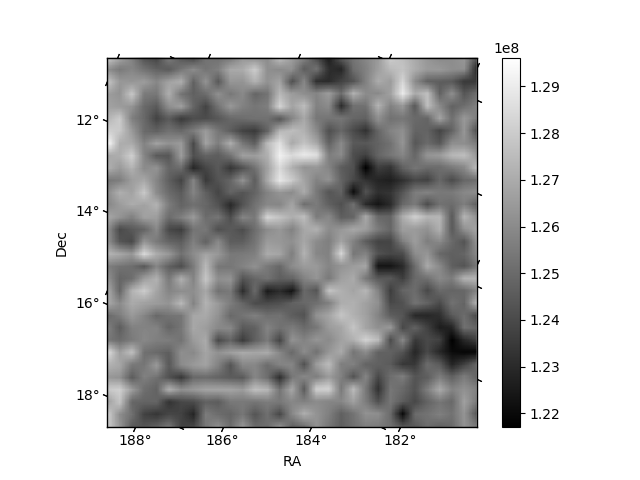
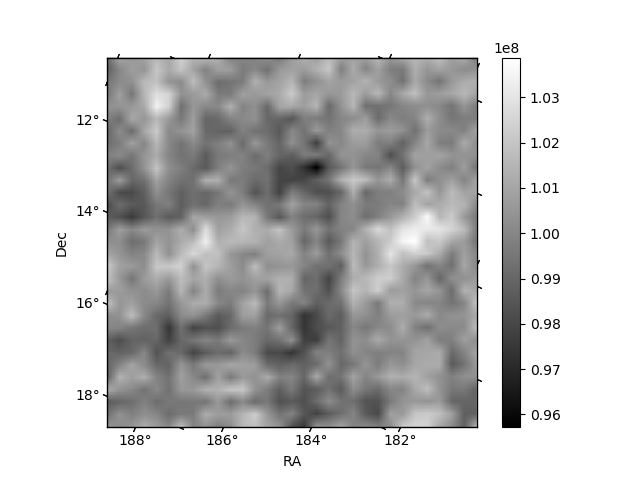
Histogram calculated using DETX and DETY for each event in the final _common_clean file
| Quadrant A | 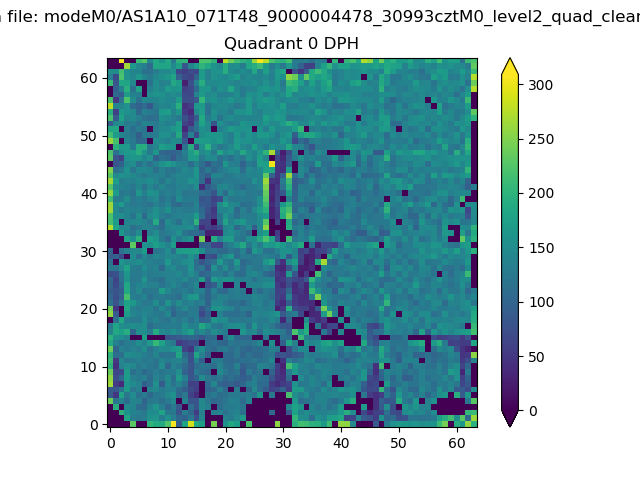 |
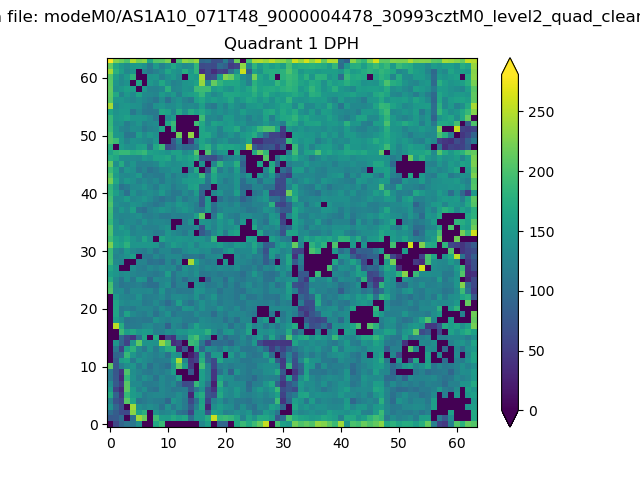 |
Quadrant B |
|---|---|---|---|
| Quadrant D | 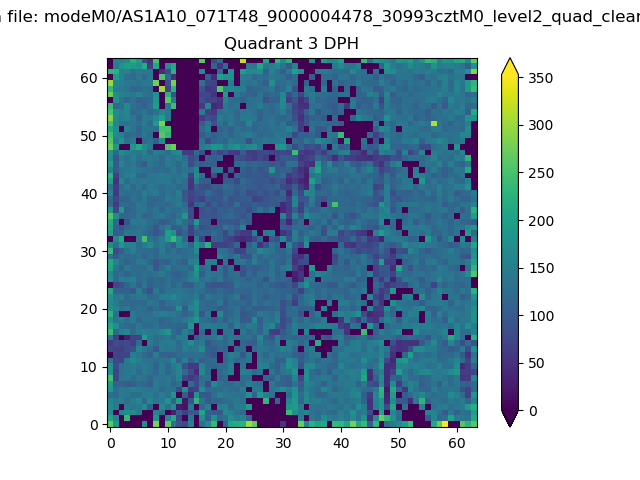 |
 |
Quadrant C |
| Plot type | Count rate plots | Images |
|---|---|---|
| Comparison with Poisson distribution Blue bars denote a histogram of data divided into 1 sec bins. Red curve is a Poisson curve with rate = median count rate of data. |
 |
 |
| Quadrant-wise count rates Data is divided into 100 sec bins |
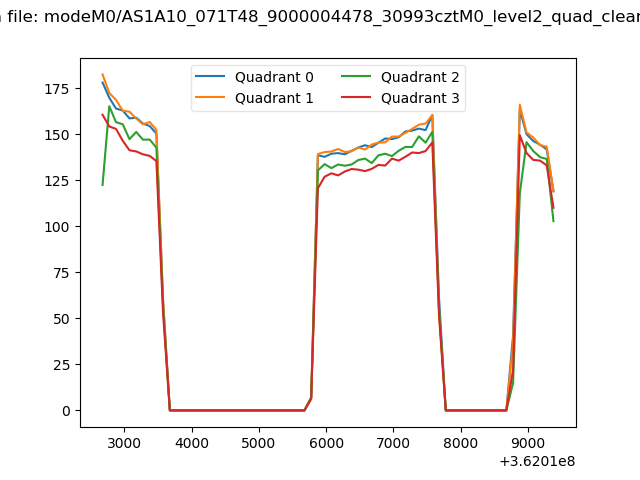 |
|
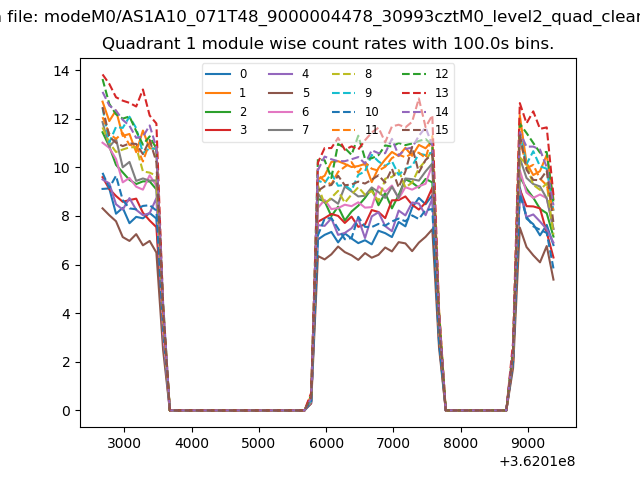
| Module-wise count rates for Quadrant A Data is divided into 100 sec bins |
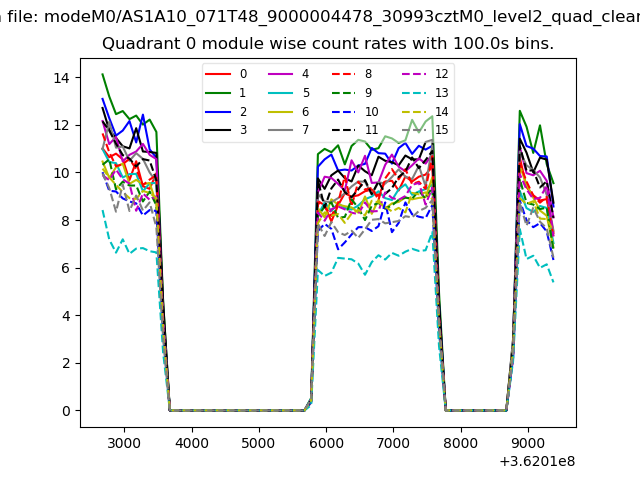 |
 |
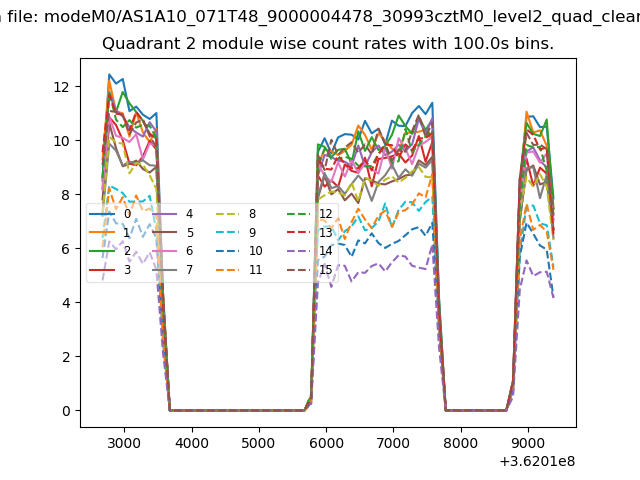
| Module-wise count rates for Quadrant B Data is divided into 100 sec bins |
 |
 |
| Module-wise count rates for Quadrant C Data is divided into 100 sec bins |
 |
 |
| Module-wise count rates for Quadrant D Data is divided into 100 sec bins |
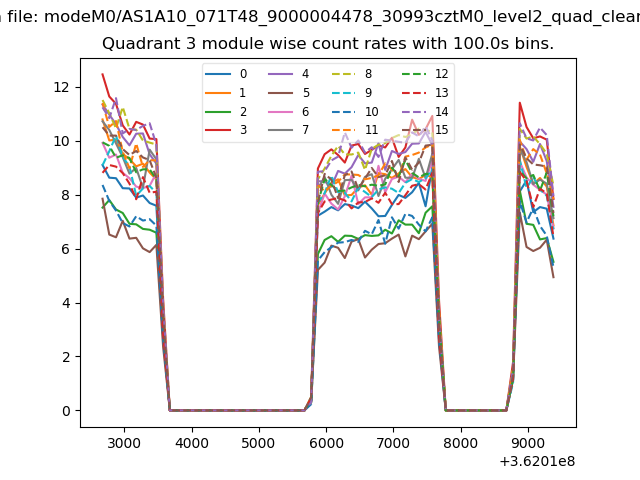 |
 |
| Parameter | Plot |
|---|---|
| CZT HV Monitor | 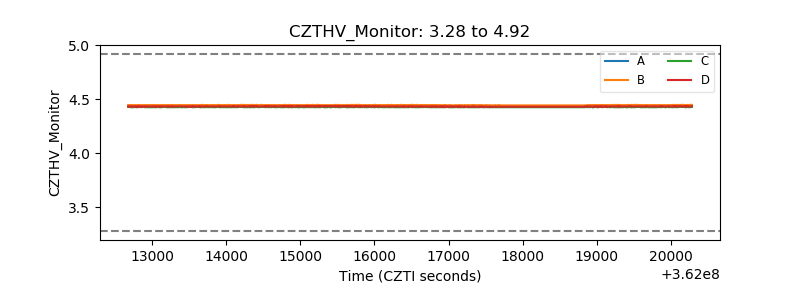 |
| D_VDD | 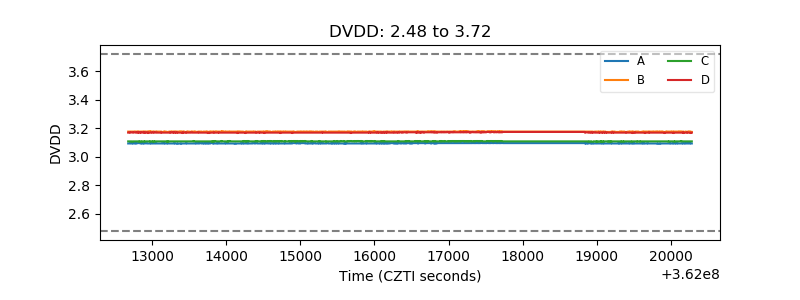 |
| Temperature 1 | 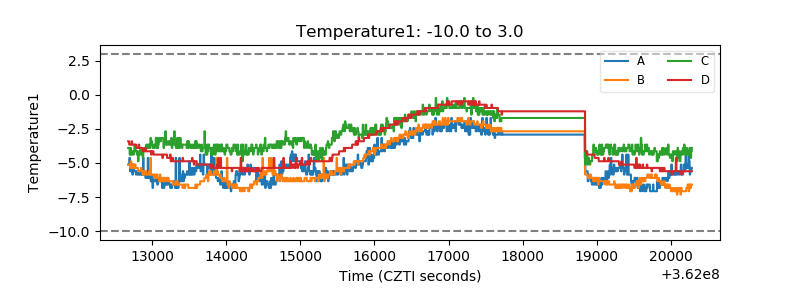 |
| Veto HV Monitor |  |
| Veto LLD | 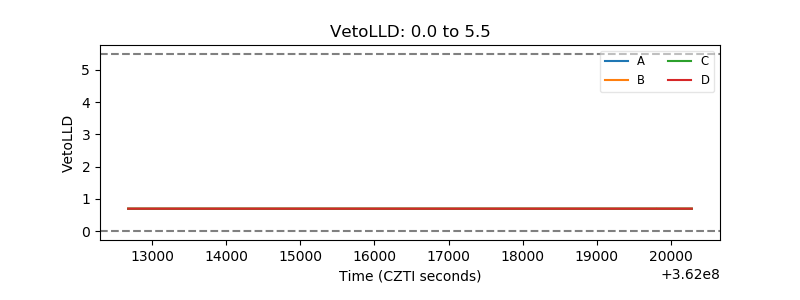 |
| Alpha Counter |  |
| _CPM_Rate | 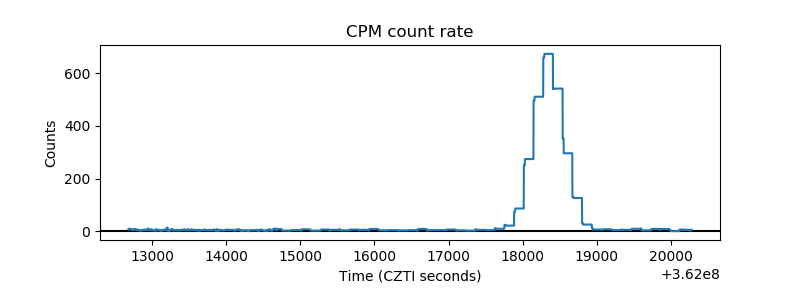 |
| CZT Counter | 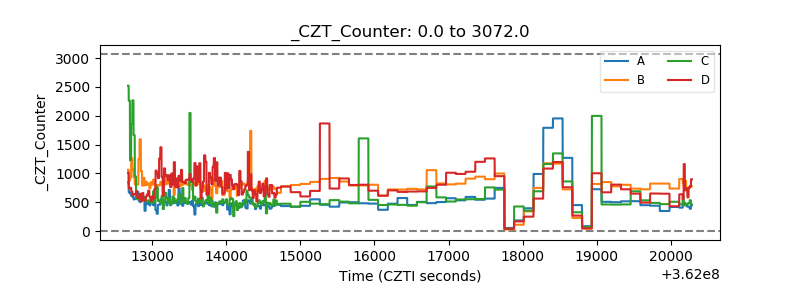 |
| +2.5 Volts monitor |  |
| +5 Volts monitor |  |
| _ROLL_ROT | 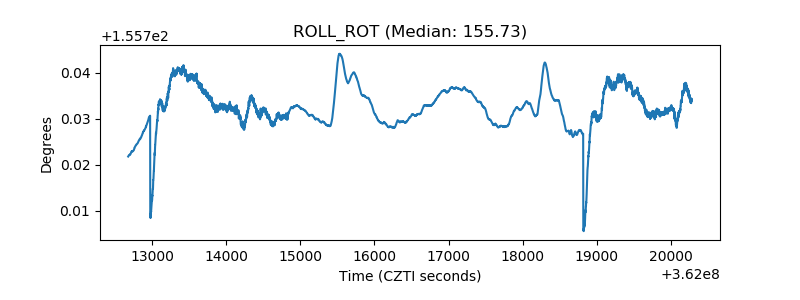 |
| _Roll_DEC | 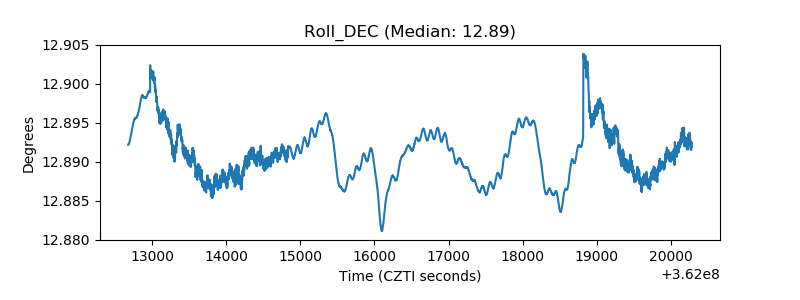 |
| _Roll_RA | 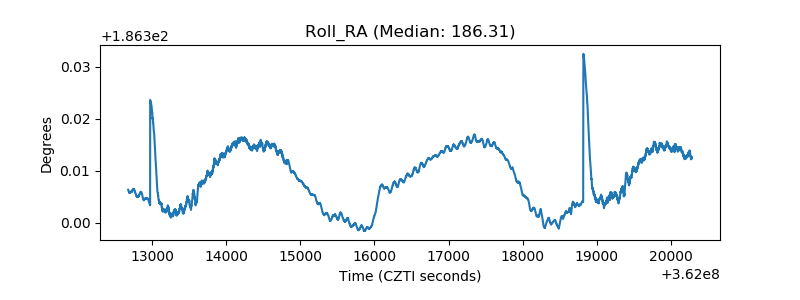 |
| Veto Counter | 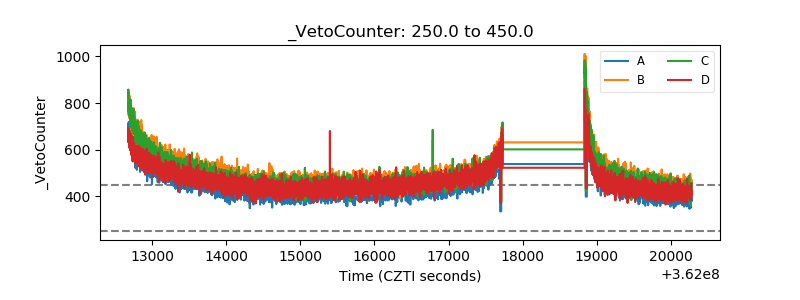 |