| Param | Original file | Final file |
|---|---|---|
| Filename | modeM0/AS1A10_071T48_9000004478_30994cztM0_level2.evt | modeM0/AS1A10_071T48_9000004478_30994cztM0_level2_quad_clean.evt |
| Size (bytes) | 580,561,920 | 77,489,280 |
| Size | 553.7 MB | 73.9 MB |
| Events in quadrant A | 3,374,913 | 484,198 |
| Events in quadrant B | 5,375,117 | 485,198 |
| Events in quadrant C | 4,061,393 | 451,156 |
| Events in quadrant D | 4,306,054 | 447,123 |
| Mode SS | |||
|---|---|---|---|
| Quadrant | BADHDUFLAG | Total packets | Discarded packets |
| A | 0 | 140 | 0 |
| B | 0 | 140 | 0 |
| C | 0 | 140 | 0 |
| D | 0 | 140 | 0 |
| Mode M9 | |||
|---|---|---|---|
| Quadrant | BADHDUFLAG | Total packets | Discarded packets |
| A | 0 | 14 | 0 |
| B | 0 | 15 | 0 |
| C | 0 | 15 | 0 |
| D | 0 | 15 | 0 |
| Mode M0 | |||
|---|---|---|---|
| Quadrant | BADHDUFLAG | Total packets | Discarded packets |
| A | 0 | 14177 | 3 |
| B | 0 | 20909 | 3 |
| C | 0 | 16230 | 3 |
| D | 0 | 17302 | 3 |
| Quadrant | Total seconds | Saturated seconds | Saturation percentage |
|---|---|---|---|
| A | 6867 | 56 | 0.815494% |
| B | 6867 | 131 | 1.907674% |
| C | 6866 | 248 | 3.612001% |
| D | 6866 | 121 | 1.762307% |
Noise dominated data is calculated using 1-second bins in cleaned event files. If a bin has >2000 counts, and if more than 50% of those come from <1% of pixels, then it is considered to be noise-dominated and hence unusable.
| Quadrant | # 1 sec bins | Bins with >0 counts | Bins with >2000 counts | High rate bins dominated by noise | Noise dominated (total time) | Noise dominated (detector-on time) | Marked lightcurve |
|---|---|---|---|---|---|---|---|
| A | 7652 | 6867 | 0 | 0 | 0.00% | 0.00% |  |
| B | 7652 | 6867 | 5 | 5 | 0.07% | 0.07% |  |
| C | 7651 | 6866 | 81 | 81 | 1.06% | 1.18% |  |
| D | 7651 | 6868 | 84 | 84 | 1.10% | 1.22% |  |
Top three noisy pixels from each quadrant. If the there are fewer than three noisy pixels in the level2.evt file, extra rows are filled as -1
| Pixel properties | Quadrant properties | ||||||
|---|---|---|---|---|---|---|---|
| Quadrant | DetID | PixID | Counts | Sigma | Mean | Median | Sigma |
| A | 11 | 47 | 23159 | 127.15 | 868 | 849 | 175.5 |
| A | 13 | 254 | 12473 | 66.25 | 868 | 849 | 175.5 |
| A | 3 | 137 | 8580 | 44.06 | 868 | 849 | 175.5 |
| B | 6 | 159 | 1887029 | 11320.4 | 860 | 838 | 166.6 |
| B | 0 | 190 | 32749 | 191.52 | 860 | 838 | 166.6 |
| B | 0 | 230 | 27688 | 161.15 | 860 | 838 | 166.6 |
| C | 0 | 10 | 623036 | 3226.84 | 816 | 824 | 192.8 |
| C | 14 | 238 | 134000 | 690.66 | 816 | 824 | 192.8 |
| C | 3 | 233 | 85696 | 440.15 | 816 | 824 | 192.8 |
| D | 13 | 174 | 447190 | 2280.15 | 824 | 803 | 195.8 |
| D | 8 | 195 | 246093 | 1252.94 | 824 | 803 | 195.8 |
| D | 1 | 239 | 234206 | 1192.22 | 824 | 803 | 195.8 |
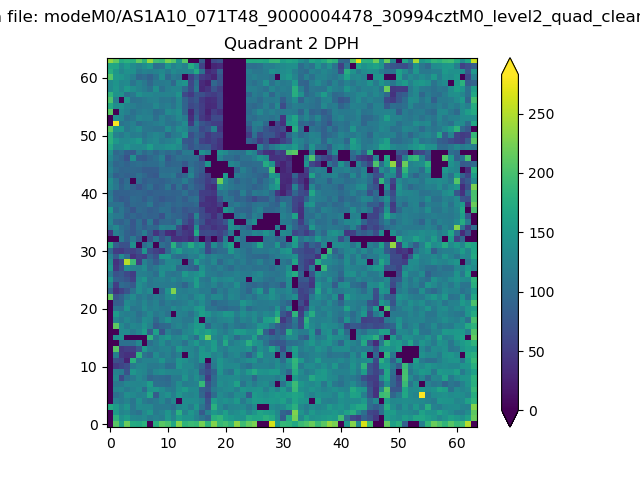
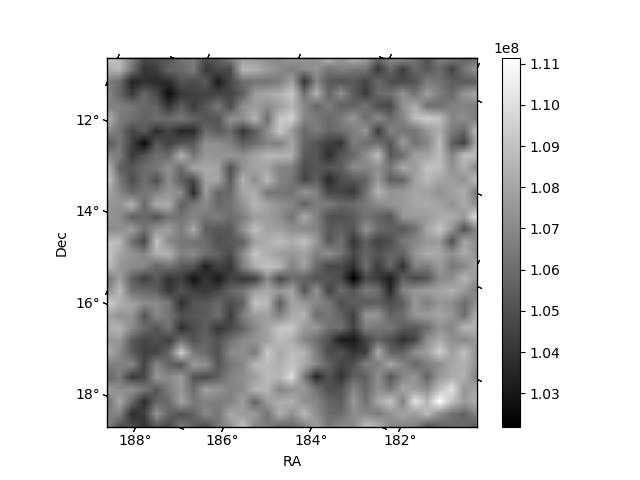
Histogram calculated using DETX and DETY for each event in the final _common_clean file
| Quadrant A | 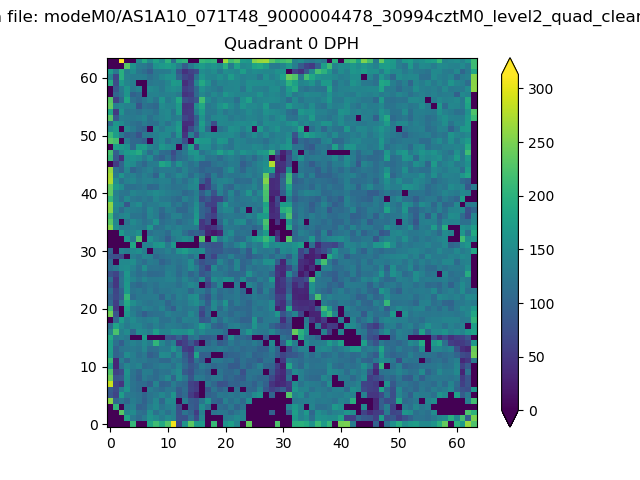 |
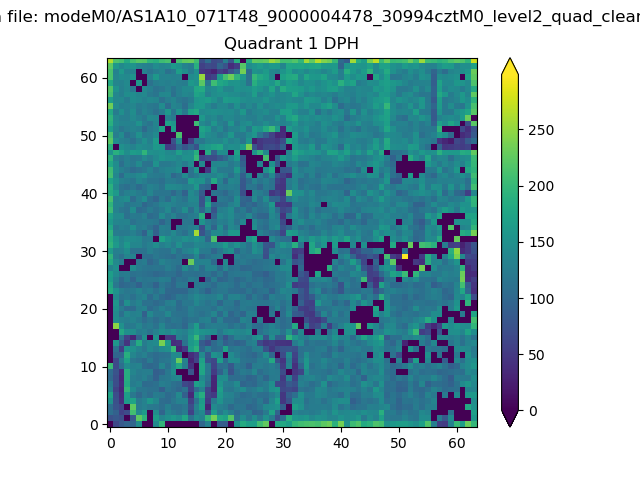 |
Quadrant B |
|---|---|---|---|
| Quadrant D | 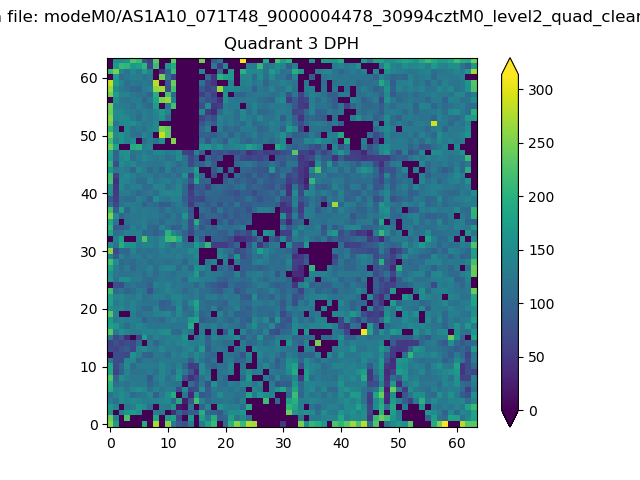 |
 |
Quadrant C |
| Plot type | Count rate plots | Images |
|---|---|---|
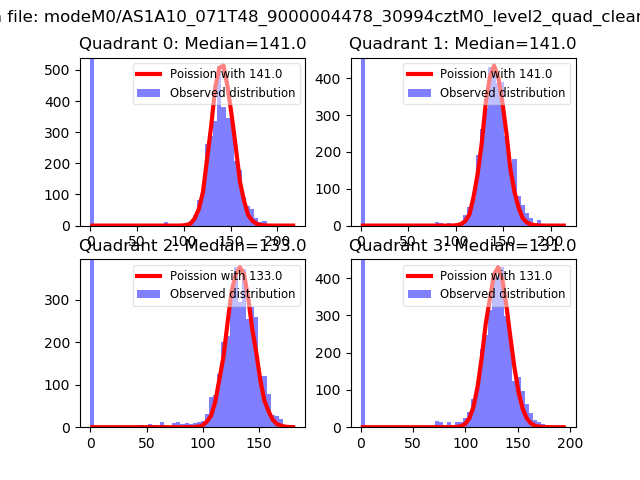
| Comparison with Poisson distribution Blue bars denote a histogram of data divided into 1 sec bins. Red curve is a Poisson curve with rate = median count rate of data. |
 |
 |
| Quadrant-wise count rates Data is divided into 100 sec bins |
 |
|
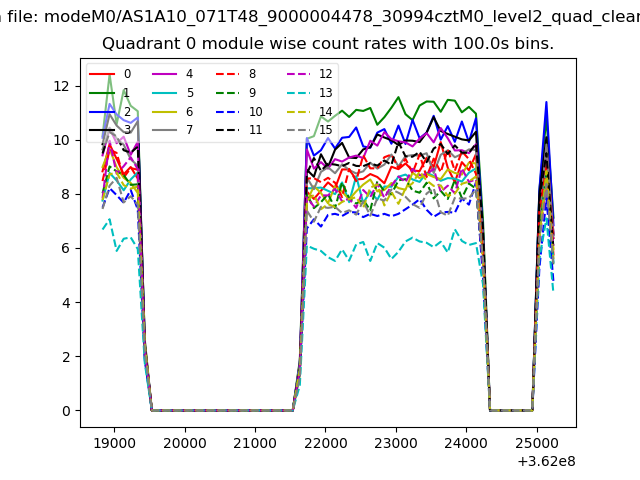
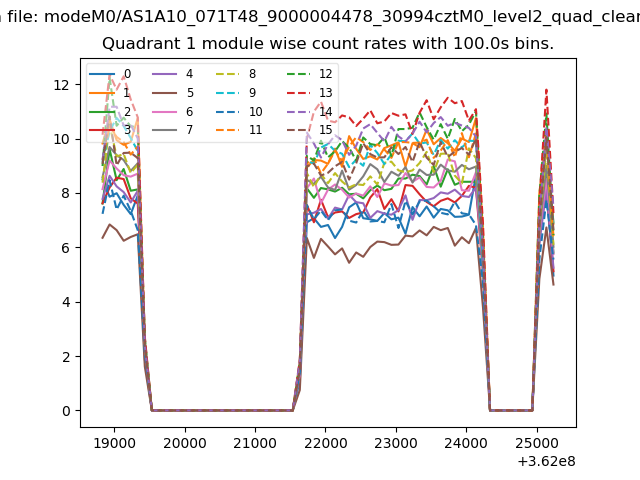
| Module-wise count rates for Quadrant A Data is divided into 100 sec bins |
 |
 |
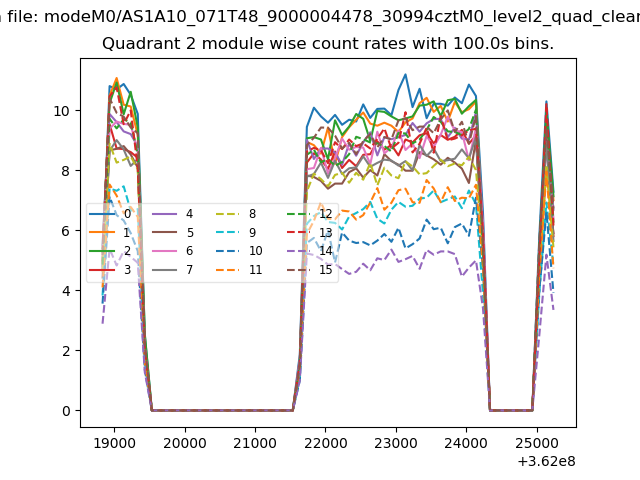
| Module-wise count rates for Quadrant B Data is divided into 100 sec bins |
 |
 |
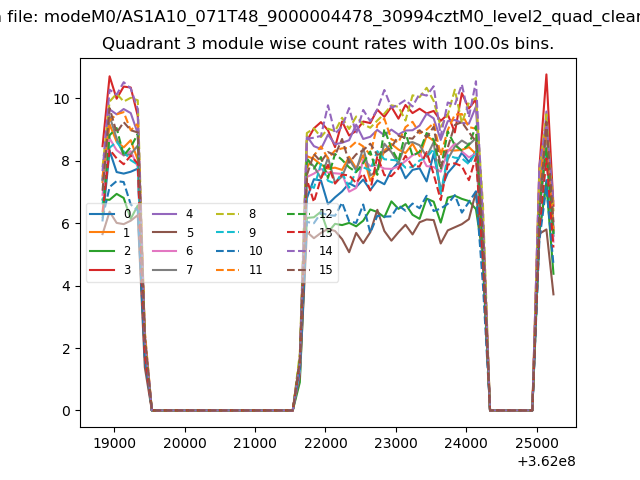
| Module-wise count rates for Quadrant C Data is divided into 100 sec bins |
 |
 |
| Module-wise count rates for Quadrant D Data is divided into 100 sec bins |
 |
 |
| Parameter | Plot |
|---|---|
| CZT HV Monitor | 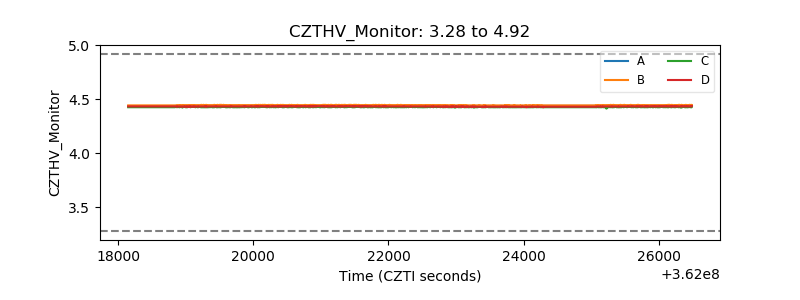 |
| D_VDD | 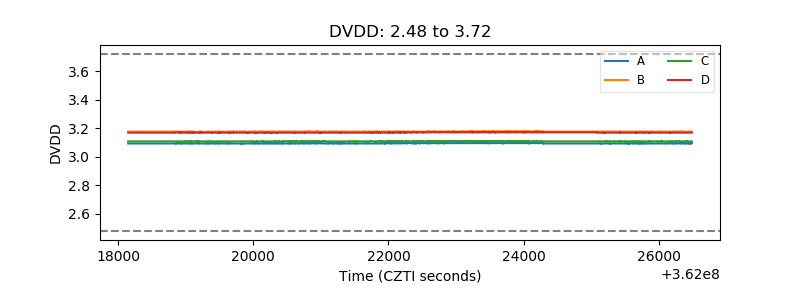 |
| Temperature 1 | 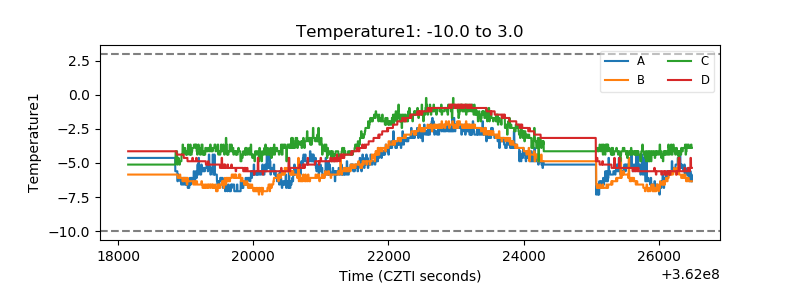 |
| Veto HV Monitor | 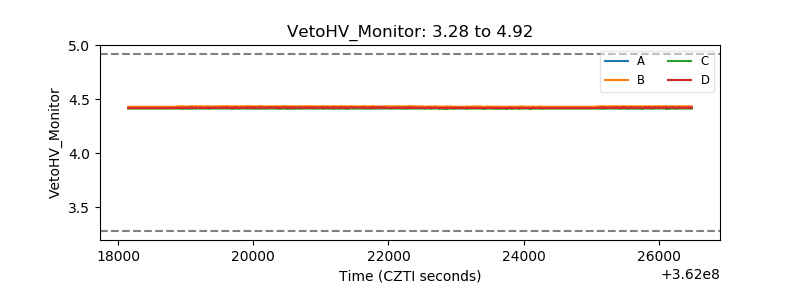 |
| Veto LLD | 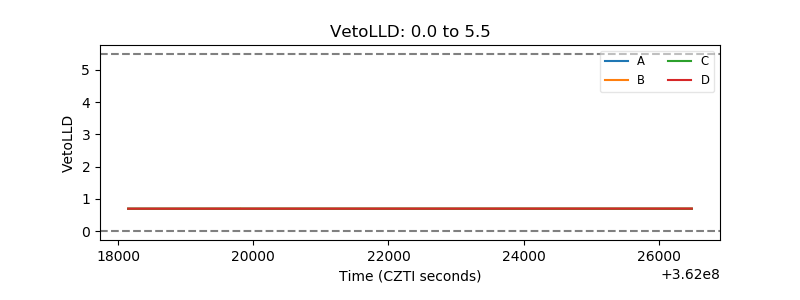 |
| Alpha Counter |  |
| _CPM_Rate | 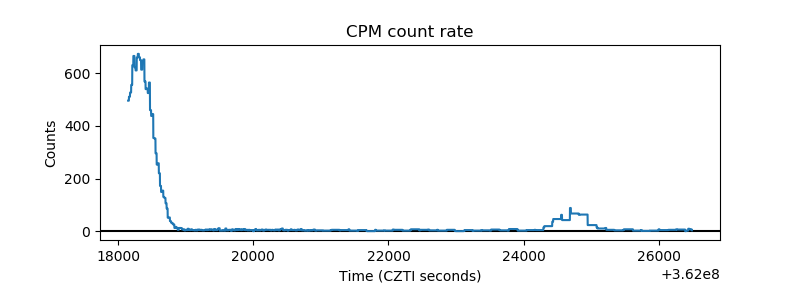 |
| CZT Counter | 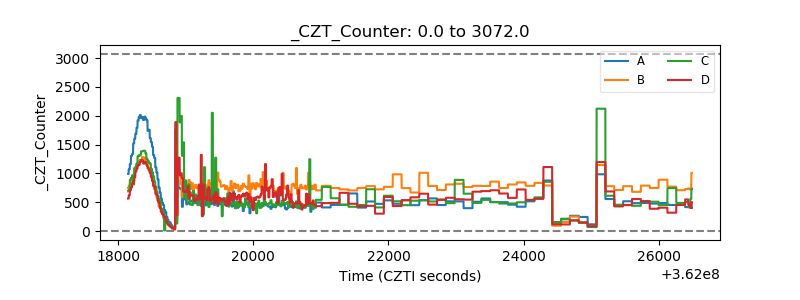 |
| +2.5 Volts monitor |  |
| +5 Volts monitor |  |
| _ROLL_ROT | 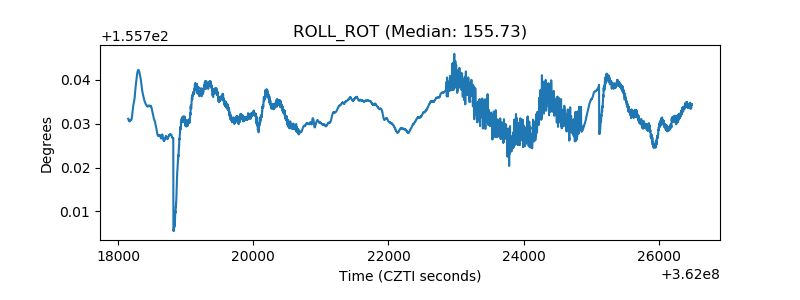 |
| _Roll_DEC | 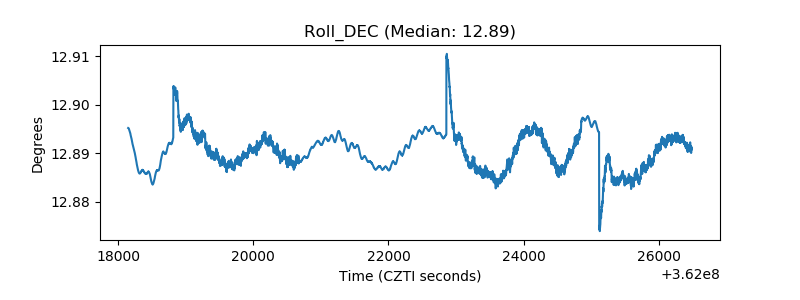 |
| _Roll_RA | 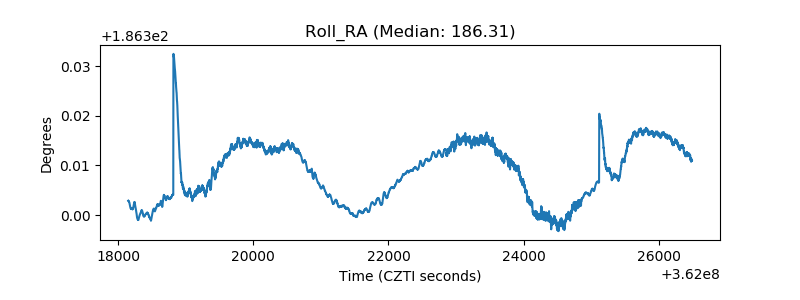 |
| Veto Counter | 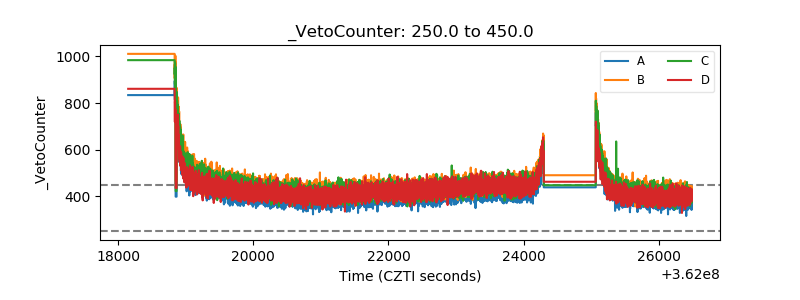 |