| Param | Original file | Final file |
|---|---|---|
| Filename | modeM0/AS1A10_071T48_9000004478_30995cztM0_level2.evt | modeM0/AS1A10_071T48_9000004478_30995cztM0_level2_quad_clean.evt |
| Size (bytes) | 572,662,080 | 76,345,920 |
| Size | 546.1 MB | 72.8 MB |
| Events in quadrant A | 3,570,933 | 464,930 |
| Events in quadrant B | 5,687,800 | 460,293 |
| Events in quadrant C | 3,742,821 | 443,763 |
| Events in quadrant D | 3,850,860 | 438,539 |
| Mode SS | |||
|---|---|---|---|
| Quadrant | BADHDUFLAG | Total packets | Discarded packets |
| A | 0 | 148 | 0 |
| B | 0 | 148 | 0 |
| C | 0 | 148 | 0 |
| D | 0 | 148 | 0 |
| Mode M9 | |||
|---|---|---|---|
| Quadrant | BADHDUFLAG | Total packets | Discarded packets |
| A | 0 | 2 | 0 |
| B | 0 | 2 | 0 |
| C | 0 | 2 | 0 |
| D | 0 | 2 | 0 |
| Mode M0 | |||
|---|---|---|---|
| Quadrant | BADHDUFLAG | Total packets | Discarded packets |
| A | 0 | 15023 | 1 |
| B | 0 | 22229 | 3 |
| C | 0 | 15526 | 1 |
| D | 0 | 16140 | 1 |
| Quadrant | Total seconds | Saturated seconds | Saturation percentage |
|---|---|---|---|
| A | 7236 | 177 | 2.446103% |
| B | 7236 | 270 | 3.731343% |
| C | 7236 | 217 | 2.998894% |
| D | 7236 | 153 | 2.114428% |
Noise dominated data is calculated using 1-second bins in cleaned event files. If a bin has >2000 counts, and if more than 50% of those come from <1% of pixels, then it is considered to be noise-dominated and hence unusable.
| Quadrant | # 1 sec bins | Bins with >0 counts | Bins with >2000 counts | High rate bins dominated by noise | Noise dominated (total time) | Noise dominated (detector-on time) | Marked lightcurve |
|---|---|---|---|---|---|---|---|
| A | 7446 | 7236 | 0 | 0 | 0.00% | 0.00% | 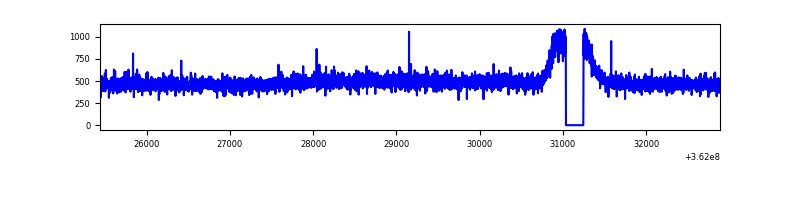 |
| B | 7446 | 7236 | 9 | 9 | 0.12% | 0.12% | 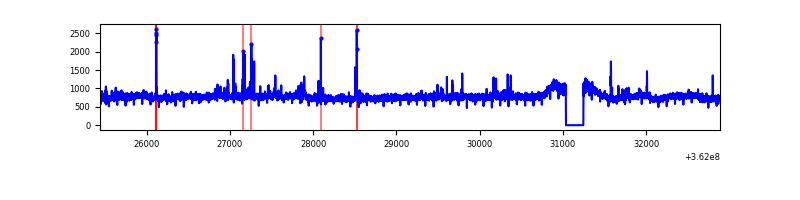 |
| C | 7446 | 7236 | 2 | 2 | 0.03% | 0.03% | 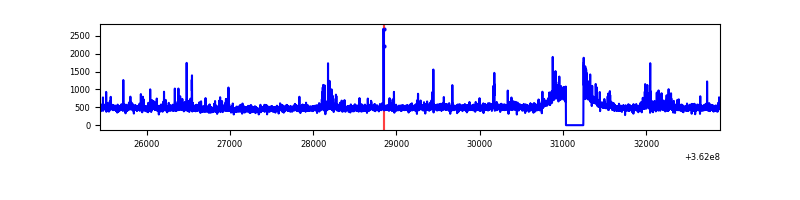 |
| D | 7446 | 7236 | 36 | 36 | 0.48% | 0.50% | 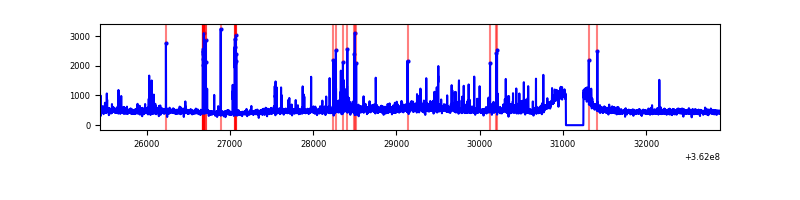 |
Top three noisy pixels from each quadrant. If the there are fewer than three noisy pixels in the level2.evt file, extra rows are filled as -1
| Pixel properties | Quadrant properties | ||||||
|---|---|---|---|---|---|---|---|
| Quadrant | DetID | PixID | Counts | Sigma | Mean | Median | Sigma |
| A | 11 | 47 | 62714 | 332.47 | 909 | 888 | 186.0 |
| A | 13 | 254 | 13179 | 66.1 | 909 | 888 | 186.0 |
| A | 3 | 137 | 9443 | 46.0 | 909 | 888 | 186.0 |
| B | 6 | 159 | 1991957 | 11320.78 | 895 | 869 | 175.9 |
| B | 4 | 80 | 72389 | 406.64 | 895 | 869 | 175.9 |
| B | 0 | 230 | 30612 | 169.11 | 895 | 869 | 175.9 |
| C | 0 | 10 | 181111 | 878.49 | 866 | 871 | 205.2 |
| C | 14 | 238 | 139000 | 673.24 | 866 | 871 | 205.2 |
| C | 2 | 114 | 16828 | 77.77 | 866 | 871 | 205.2 |
| D | 1 | 239 | 247810 | 1178.5 | 873 | 850 | 209.6 |
| D | 8 | 195 | 143702 | 681.7 | 873 | 850 | 209.6 |
| D | 2 | 250 | 124732 | 591.17 | 873 | 850 | 209.6 |
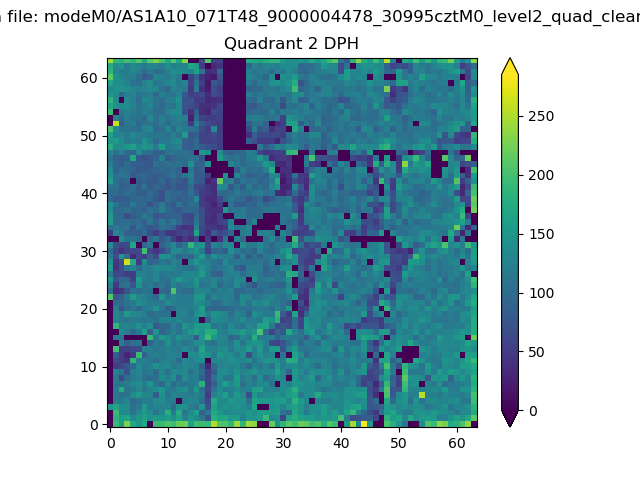
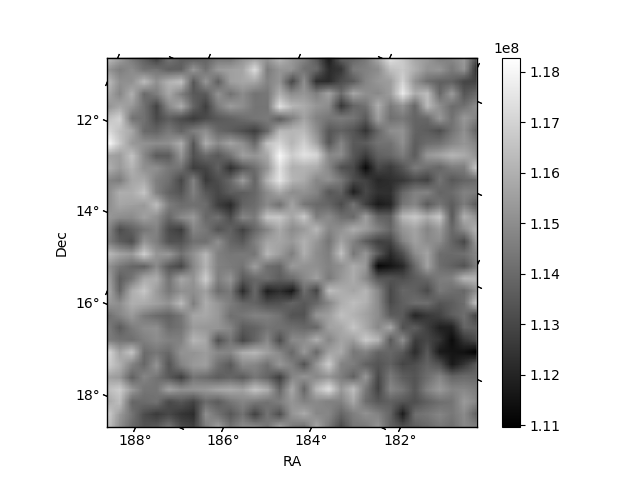
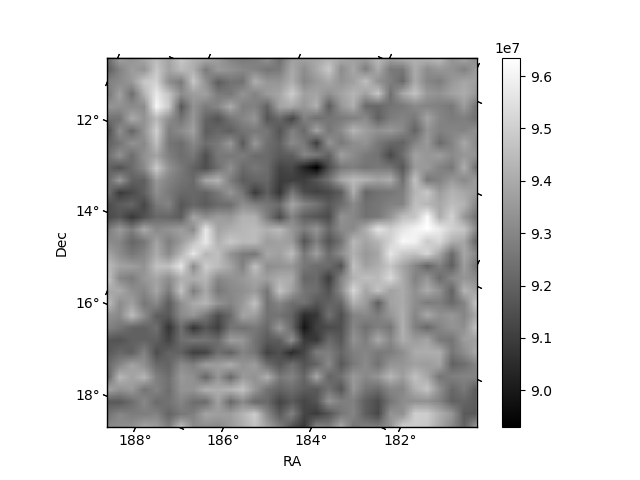
Histogram calculated using DETX and DETY for each event in the final _common_clean file
| Quadrant A | 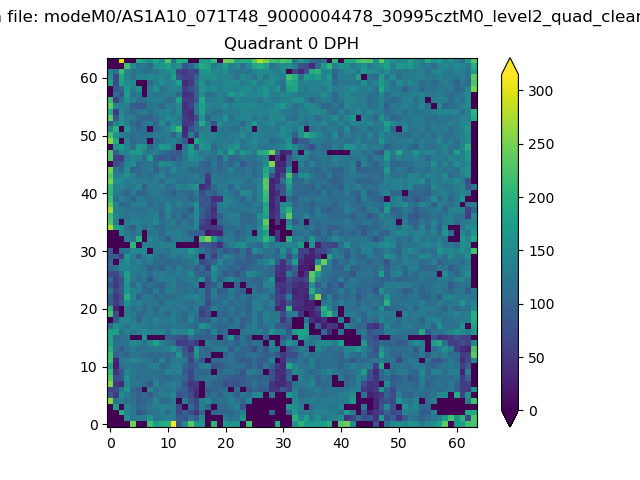 |
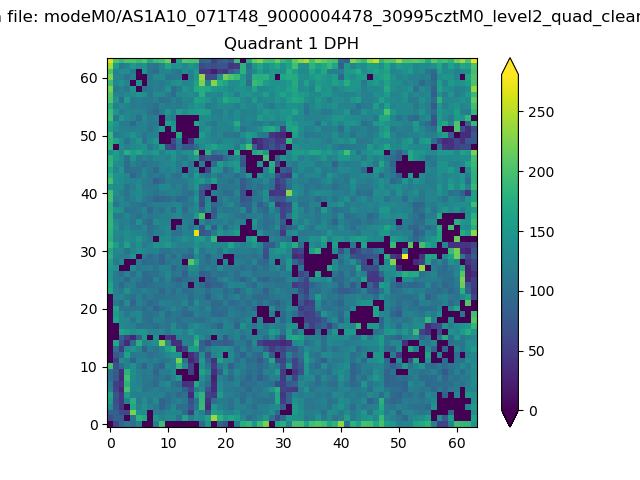 |
Quadrant B |
|---|---|---|---|
| Quadrant D | 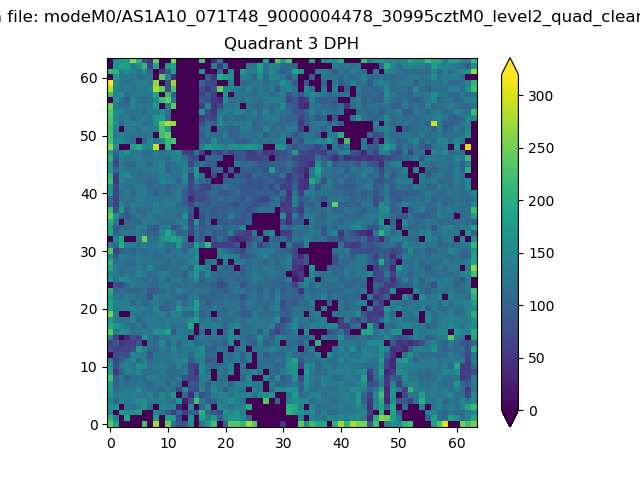 |
 |
Quadrant C |
| Plot type | Count rate plots | Images |
|---|---|---|
| Comparison with Poisson distribution Blue bars denote a histogram of data divided into 1 sec bins. Red curve is a Poisson curve with rate = median count rate of data. |
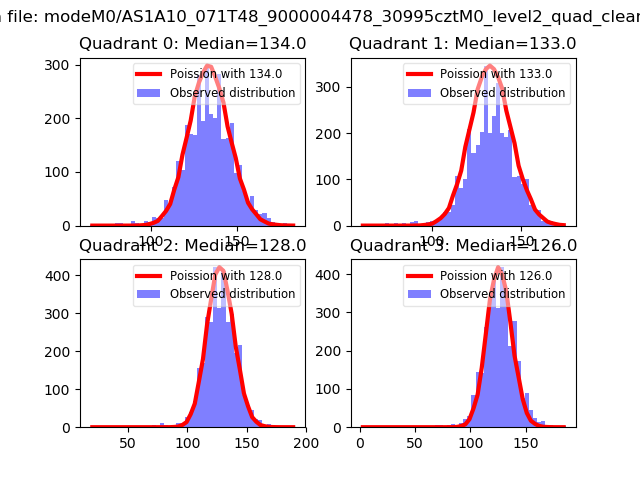 |
 |
| Quadrant-wise count rates Data is divided into 100 sec bins |
 |
|
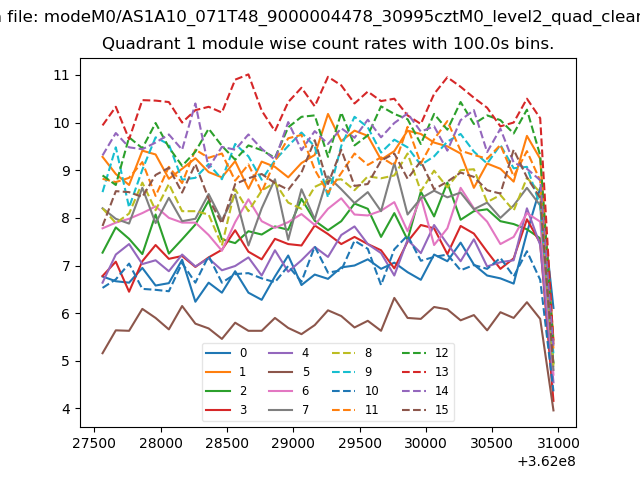
| Module-wise count rates for Quadrant A Data is divided into 100 sec bins |
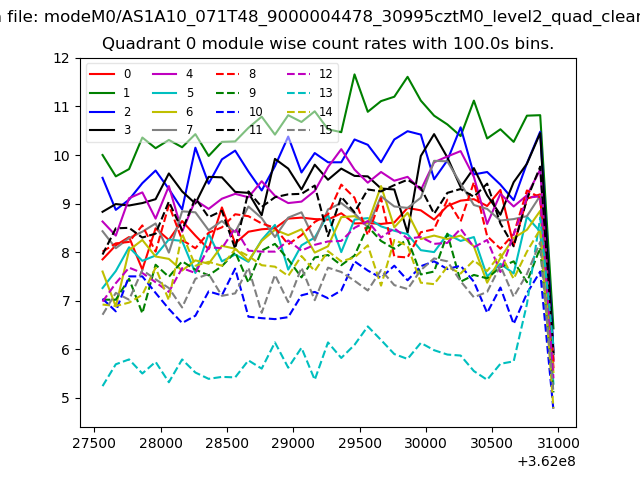 |
 |
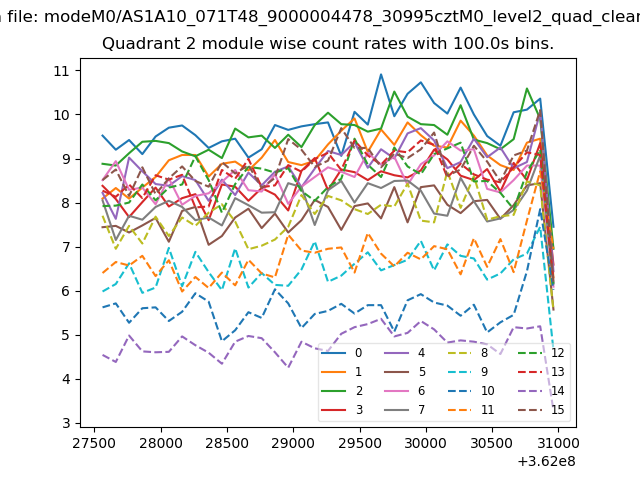
| Module-wise count rates for Quadrant B Data is divided into 100 sec bins |
 |
 |
| Module-wise count rates for Quadrant C Data is divided into 100 sec bins |
 |
 |
| Module-wise count rates for Quadrant D Data is divided into 100 sec bins |
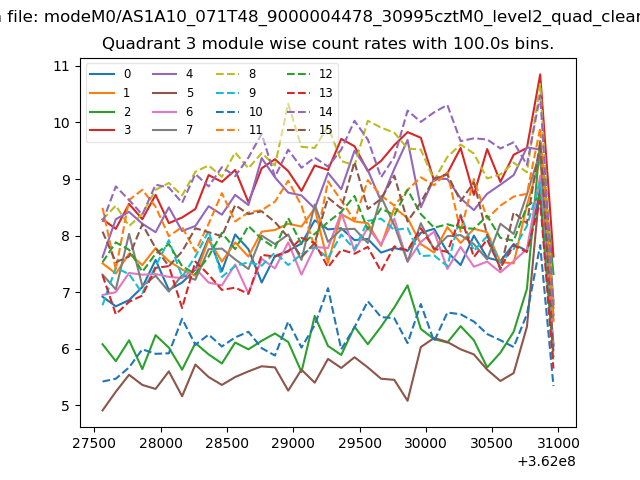 |
 |
| Parameter | Plot |
|---|---|
| CZT HV Monitor |  |
| D_VDD | 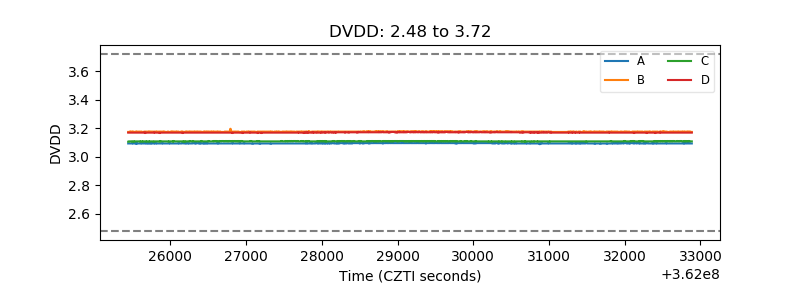 |
| Temperature 1 | 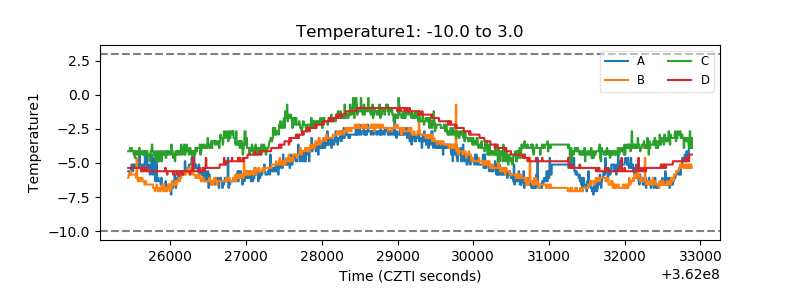 |
| Veto HV Monitor | 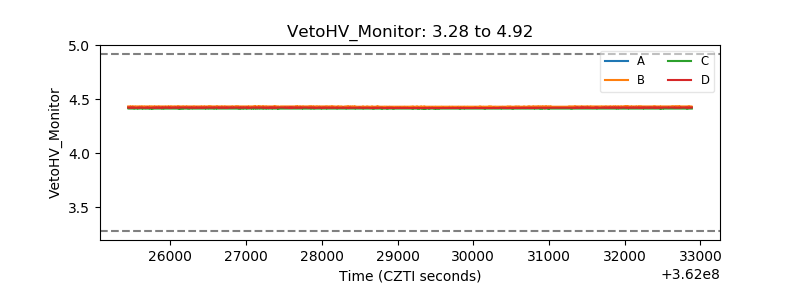 |
| Veto LLD | 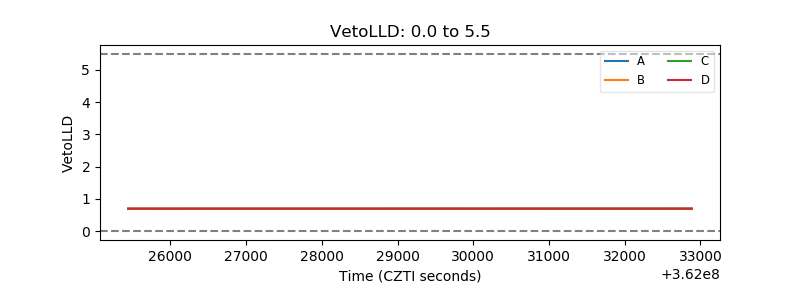 |
| Alpha Counter | 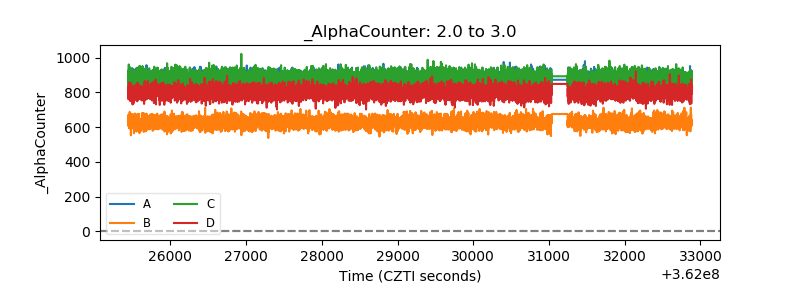 |
| _CPM_Rate | 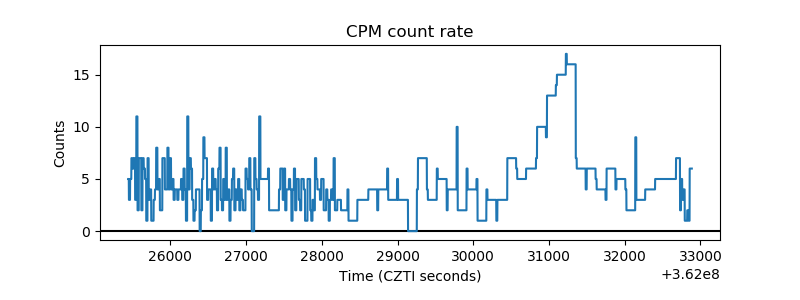 |
| CZT Counter | 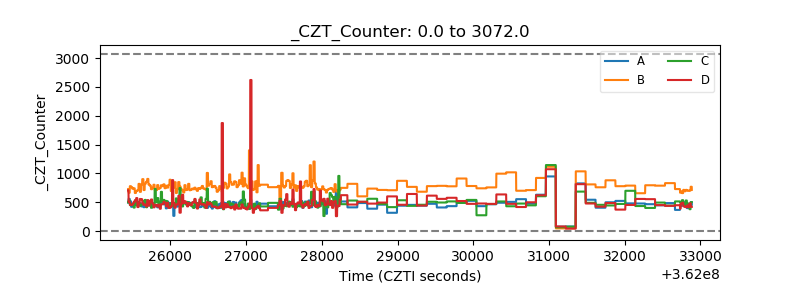 |
| +2.5 Volts monitor |  |
| +5 Volts monitor |  |
| _ROLL_ROT | 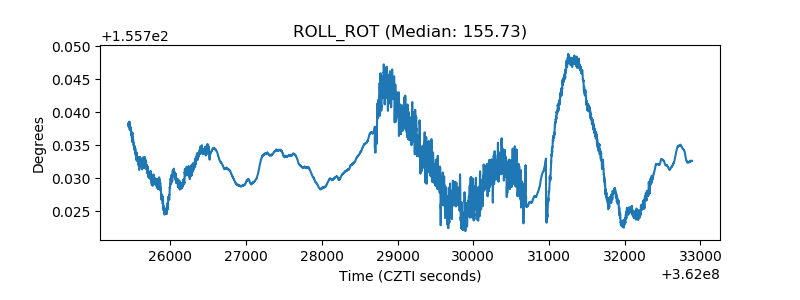 |
| _Roll_DEC | 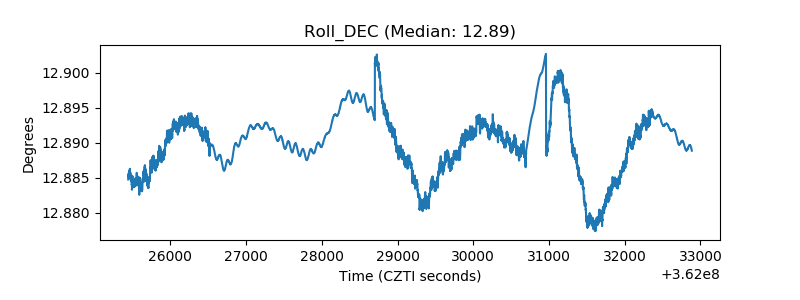 |
| _Roll_RA | 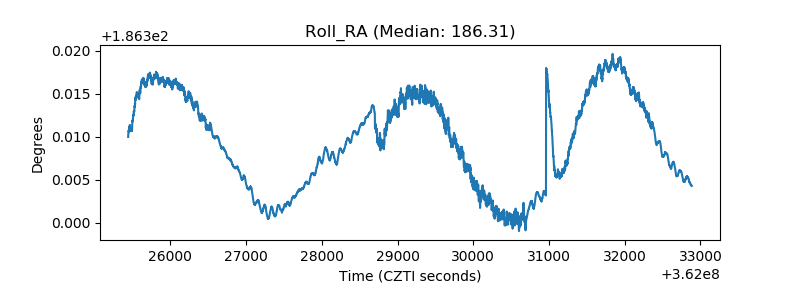 |
| Veto Counter | 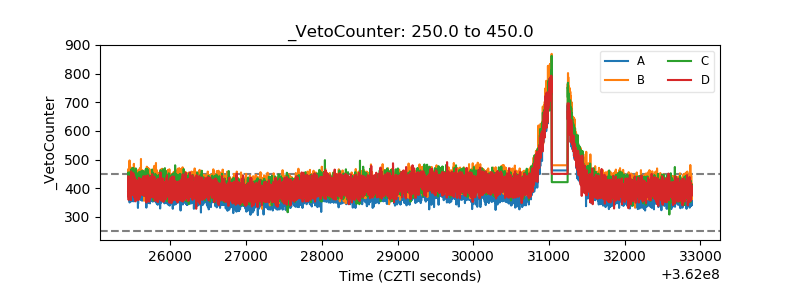 |