| Param | Original file | Final file |
|---|---|---|
| Filename | modeM0/AS1A10_071T48_9000004478_30996cztM0_level2.evt | modeM0/AS1A10_071T48_9000004478_30996cztM0_level2_quad_clean.evt |
| Size (bytes) | 648,201,600 | 80,907,840 |
| Size | 618.2 MB | 77.2 MB |
| Events in quadrant A | 4,021,370 | 484,575 |
| Events in quadrant B | 6,375,070 | 480,012 |
| Events in quadrant C | 4,217,944 | 465,753 |
| Events in quadrant D | 4,470,290 | 459,330 |
| Mode SS | |||
|---|---|---|---|
| Quadrant | BADHDUFLAG | Total packets | Discarded packets |
| A | 0 | 164 | 0 |
| B | 0 | 164 | 0 |
| C | 0 | 164 | 0 |
| D | 0 | 164 | 0 |
| Mode M9 | |||
|---|---|---|---|
| Quadrant | BADHDUFLAG | Total packets | Discarded packets |
| A | 0 | 2 | 0 |
| B | 0 | 2 | 0 |
| C | 0 | 2 | 0 |
| D | 0 | 2 | 0 |
| Mode M0 | |||
|---|---|---|---|
| Quadrant | BADHDUFLAG | Total packets | Discarded packets |
| A | 0 | 17039 | 2 |
| B | 0 | 24880 | 2 |
| C | 0 | 17467 | 2 |
| D | 0 | 18485 | 2 |
| Quadrant | Total seconds | Saturated seconds | Saturation percentage |
|---|---|---|---|
| A | 8055 | 427 | 5.301055% |
| B | 8056 | 583 | 7.236842% |
| C | 8056 | 436 | 5.412115% |
| D | 8056 | 327 | 4.059086% |
Noise dominated data is calculated using 1-second bins in cleaned event files. If a bin has >2000 counts, and if more than 50% of those come from <1% of pixels, then it is considered to be noise-dominated and hence unusable.
| Quadrant | # 1 sec bins | Bins with >0 counts | Bins with >2000 counts | High rate bins dominated by noise | Noise dominated (total time) | Noise dominated (detector-on time) | Marked lightcurve |
|---|---|---|---|---|---|---|---|
| A | 8280 | 8055 | 0 | 0 | 0.00% | 0.00% | 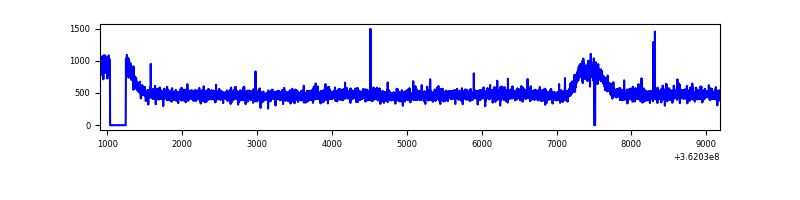 |
| B | 8280 | 8055 | 11 | 11 | 0.13% | 0.14% | 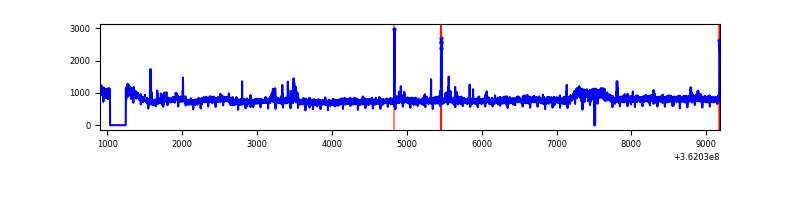 |
| C | 8281 | 8056 | 4 | 4 | 0.05% | 0.05% | 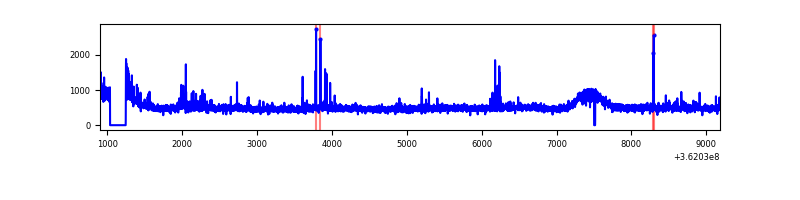 |
| D | 8281 | 8056 | 28 | 28 | 0.34% | 0.35% | 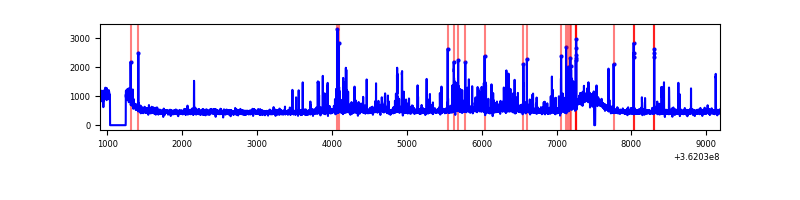 |
Top three noisy pixels from each quadrant. If the there are fewer than three noisy pixels in the level2.evt file, extra rows are filled as -1
| Pixel properties | Quadrant properties | ||||||
|---|---|---|---|---|---|---|---|
| Quadrant | DetID | PixID | Counts | Sigma | Mean | Median | Sigma |
| A | 11 | 47 | 16584 | 73.4 | 1038 | 1015 | 212.1 |
| A | 13 | 254 | 14751 | 64.76 | 1038 | 1015 | 212.1 |
| A | 3 | 137 | 11280 | 48.4 | 1038 | 1015 | 212.1 |
| B | 6 | 159 | 2217970 | 11022.5 | 1014 | 987 | 201.1 |
| B | 0 | 190 | 46523 | 226.4 | 1014 | 987 | 201.1 |
| B | 4 | 80 | 30674 | 147.6 | 1014 | 987 | 201.1 |
| C | 14 | 238 | 154882 | 651.93 | 989 | 995 | 236.0 |
| C | 0 | 10 | 141657 | 595.9 | 989 | 995 | 236.0 |
| C | 10 | 22 | 23468 | 95.21 | 989 | 995 | 236.0 |
| D | 8 | 195 | 238039 | 977.74 | 1005 | 977 | 242.5 |
| D | 2 | 250 | 189305 | 776.74 | 1005 | 977 | 242.5 |
| D | 1 | 239 | 168317 | 690.18 | 1005 | 977 | 242.5 |
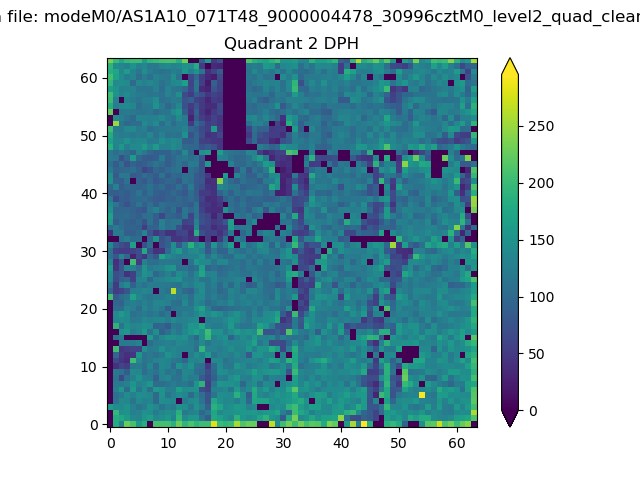
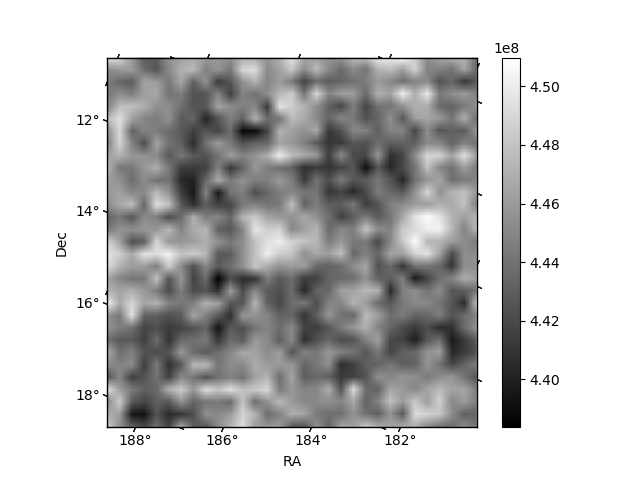
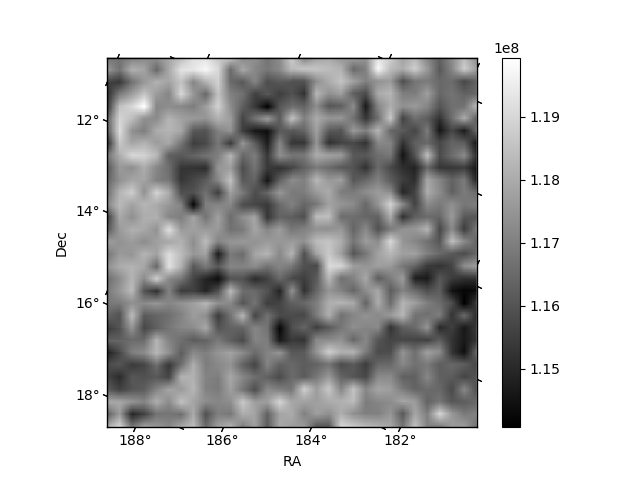
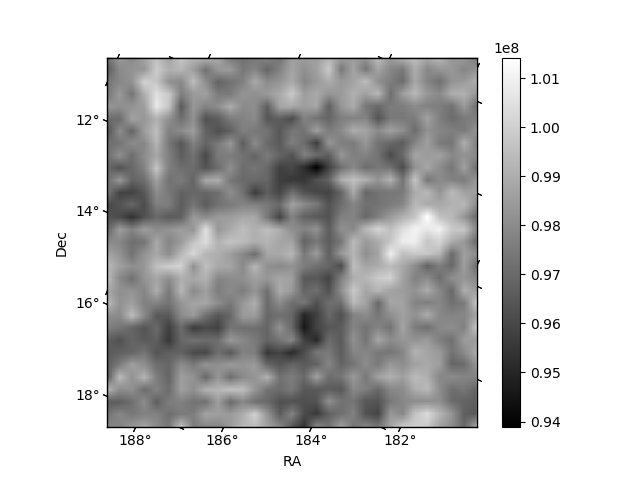
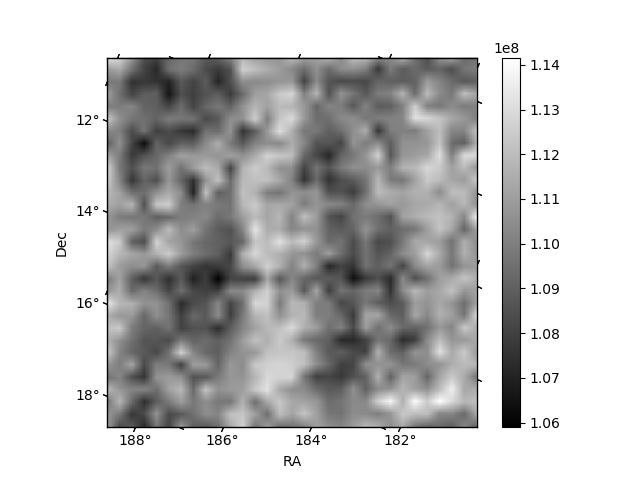
Histogram calculated using DETX and DETY for each event in the final _common_clean file
| Quadrant A | 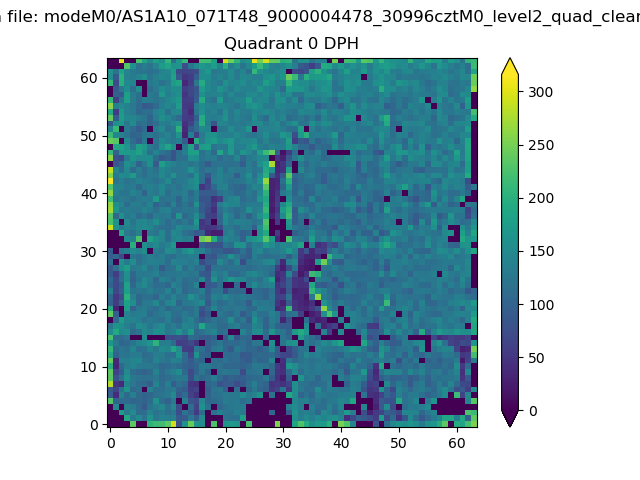 |
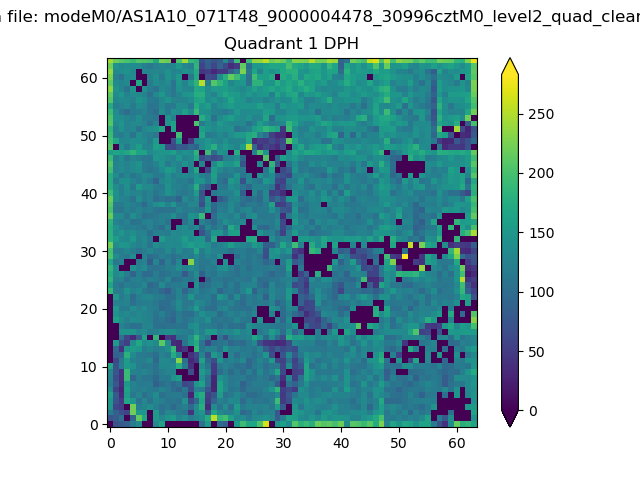 |
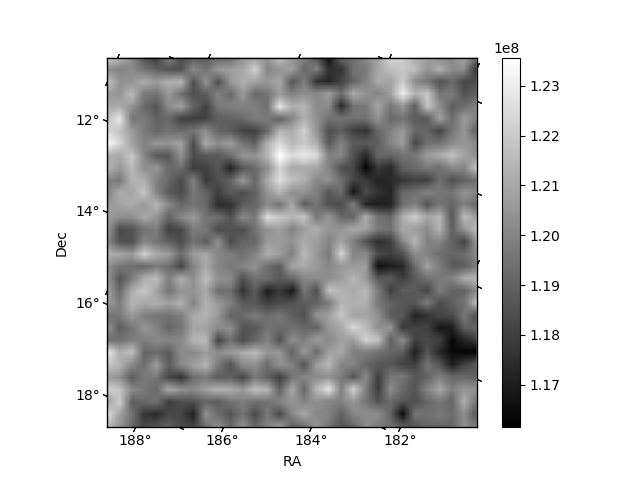
Quadrant B |
|---|---|---|---|
| Quadrant D | 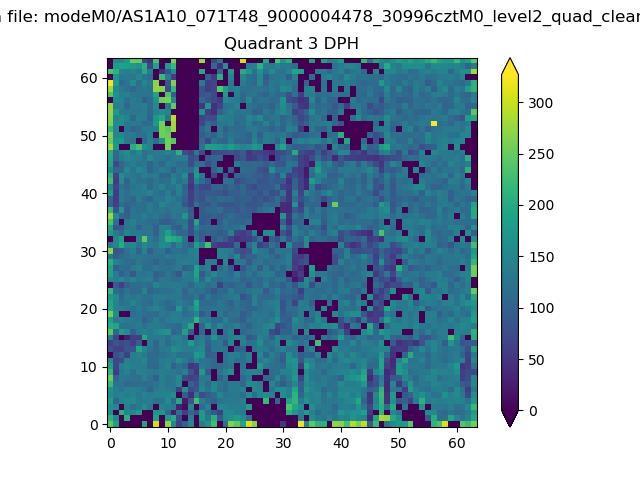 |
 |
Quadrant C |
| Plot type | Count rate plots | Images |
|---|---|---|
| Comparison with Poisson distribution Blue bars denote a histogram of data divided into 1 sec bins. Red curve is a Poisson curve with rate = median count rate of data. |
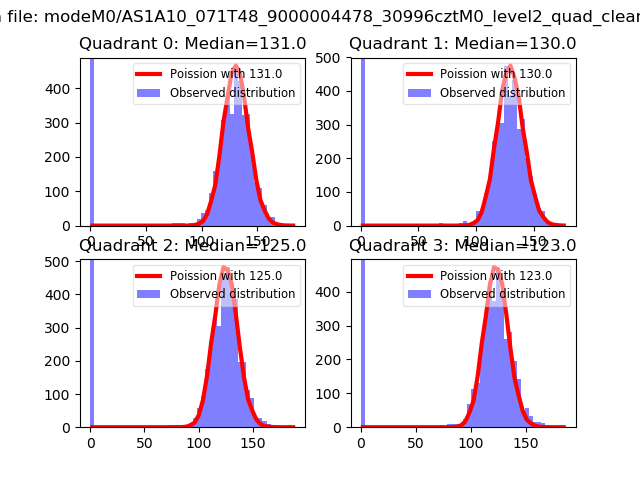 |
 |
| Quadrant-wise count rates Data is divided into 100 sec bins |
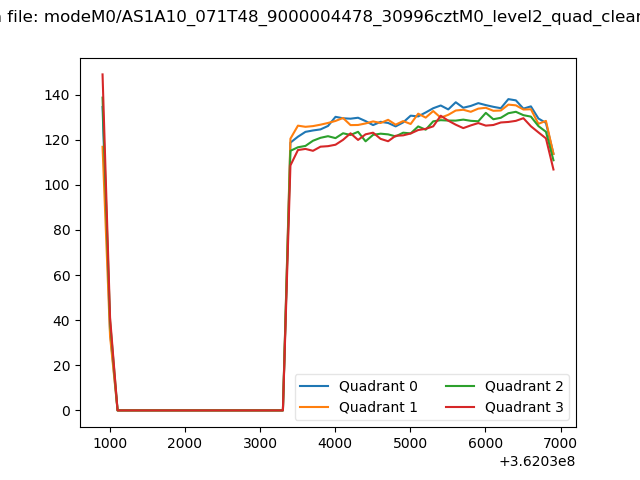 |
|
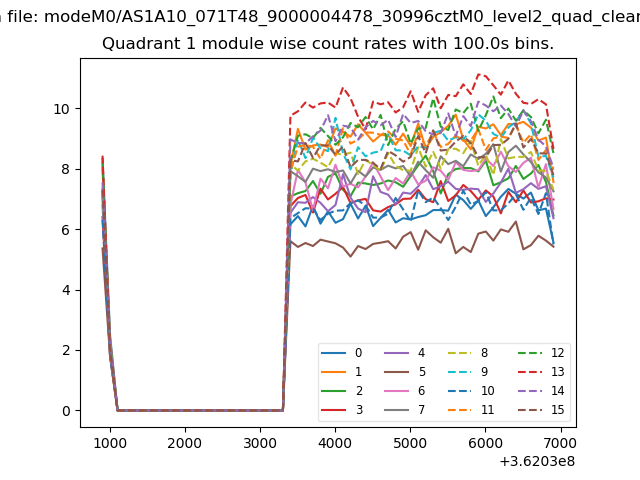
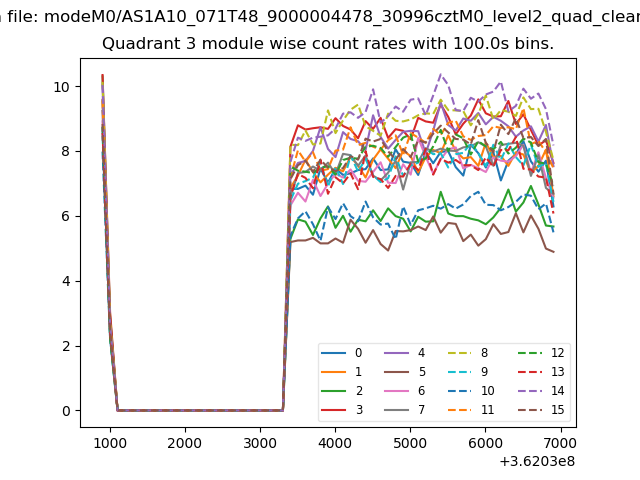
| Module-wise count rates for Quadrant A Data is divided into 100 sec bins |
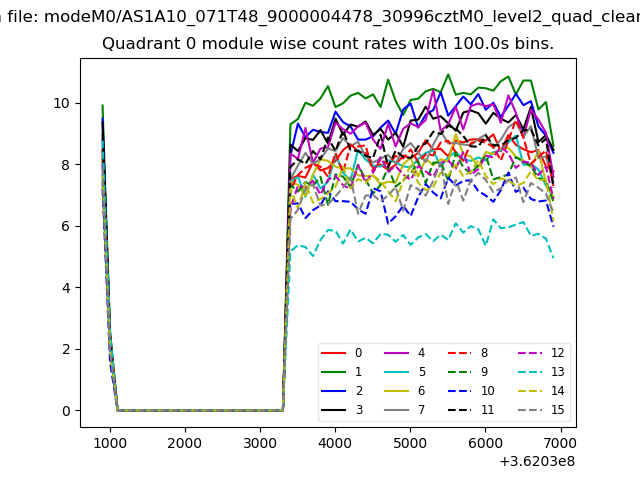 |
 |
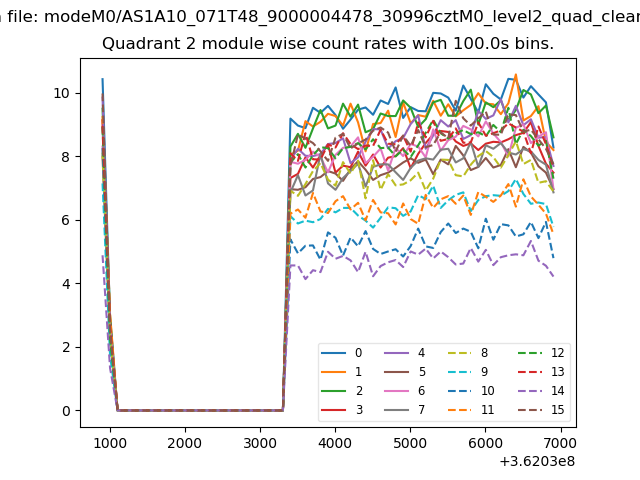
| Module-wise count rates for Quadrant B Data is divided into 100 sec bins |
 |
 |
| Module-wise count rates for Quadrant C Data is divided into 100 sec bins |
 |
 |
| Module-wise count rates for Quadrant D Data is divided into 100 sec bins |
 |
 |
| Parameter | Plot |
|---|---|
| CZT HV Monitor |  |
| D_VDD | 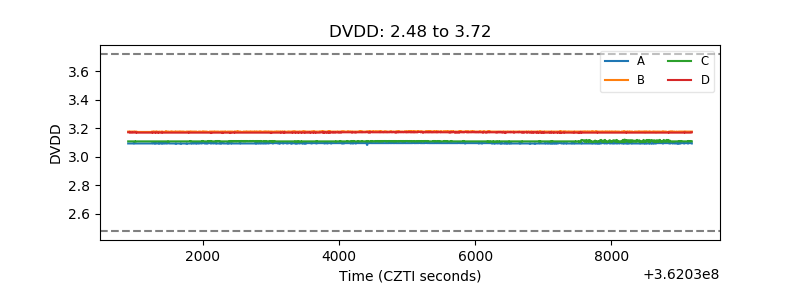 |
| Temperature 1 | 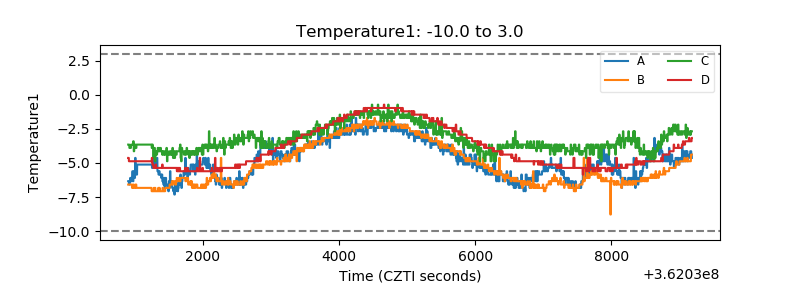 |
| Veto HV Monitor | 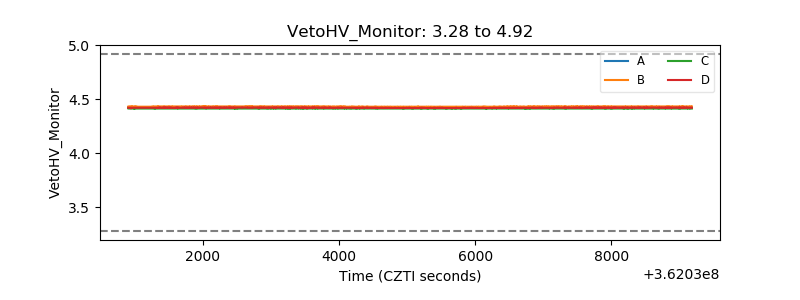 |
| Veto LLD | 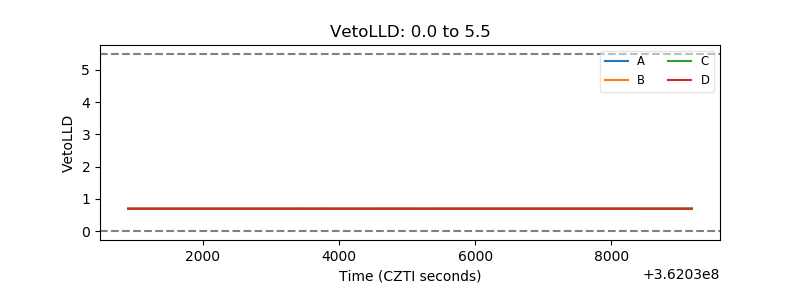 |
| Alpha Counter |  |
| _CPM_Rate |  |
| CZT Counter | 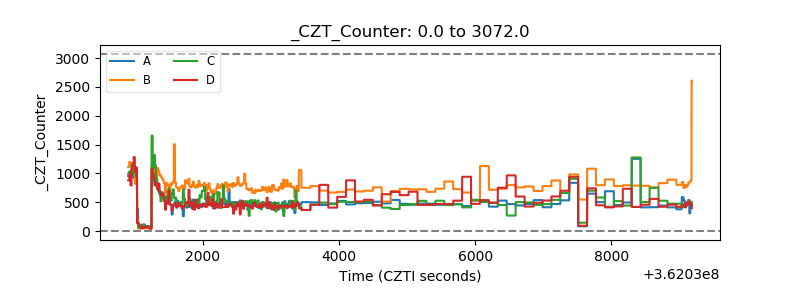 |
| +2.5 Volts monitor |  |
| +5 Volts monitor |  |
| _ROLL_ROT | 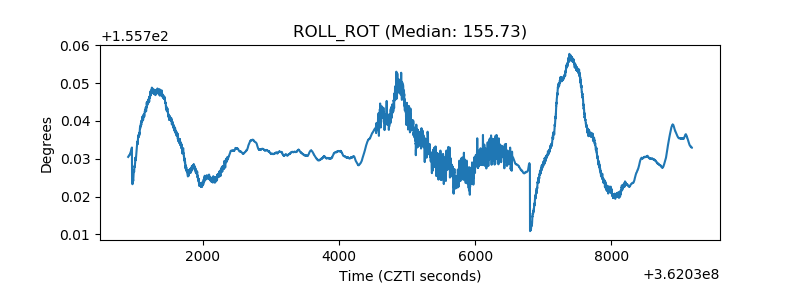 |
| _Roll_DEC | 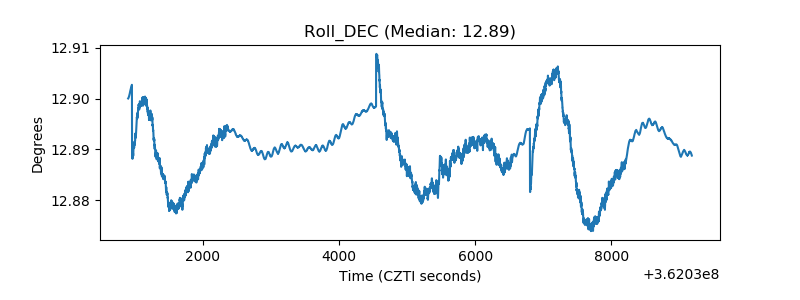 |
| _Roll_RA | 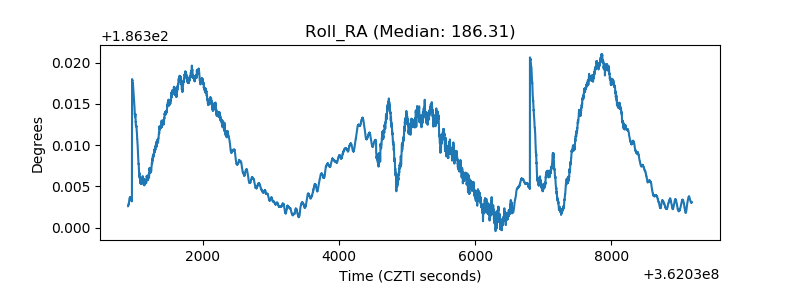 |
| Veto Counter | 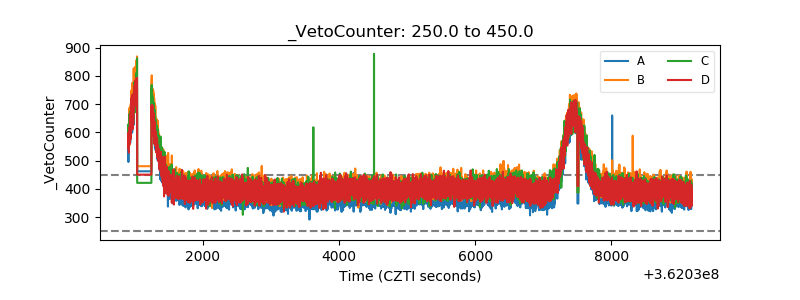 |