| Param | Original file | Final file |
|---|---|---|
| Filename | modeM0/AS1A10_071T48_9000004478_30999cztM0_level2.evt | modeM0/AS1A10_071T48_9000004478_30999cztM0_level2_quad_clean.evt |
| Size (bytes) | 982,013,760 | 167,253,120 |
| Size | 936.5 MB | 159.5 MB |
| Events in quadrant A | 5,851,786 | 1,080,748 |
| Events in quadrant B | 9,540,933 | 1,074,308 |
| Events in quadrant C | 6,412,145 | 1,037,513 |
| Events in quadrant D | 7,099,254 | 1,017,237 |
| Mode SS | |||
|---|---|---|---|
| Quadrant | BADHDUFLAG | Total packets | Discarded packets |
| A | 0 | 250 | 0 |
| B | 0 | 250 | 0 |
| C | 0 | 250 | 0 |
| D | 0 | 250 | 0 |
| Mode M9 | |||
|---|---|---|---|
| Quadrant | BADHDUFLAG | Total packets | Discarded packets |
| A | 0 | 13 | 0 |
| B | 0 | 13 | 0 |
| C | 0 | 13 | 0 |
| D | 0 | 13 | 0 |
| Mode M0 | |||
|---|---|---|---|
| Quadrant | BADHDUFLAG | Total packets | Discarded packets |
| A | 0 | 25266 | 3 |
| B | 0 | 37641 | 2 |
| C | 0 | 26516 | 2 |
| D | 0 | 28700 | 2 |
| Quadrant | Total seconds | Saturated seconds | Saturation percentage |
|---|---|---|---|
| A | 12387 | 153 | 1.235166% |
| B | 12388 | 255 | 2.058444% |
| C | 12388 | 291 | 2.349047% |
| D | 12388 | 186 | 1.501453% |
Noise dominated data is calculated using 1-second bins in cleaned event files. If a bin has >2000 counts, and if more than 50% of those come from <1% of pixels, then it is considered to be noise-dominated and hence unusable.
| Quadrant | # 1 sec bins | Bins with >0 counts | Bins with >2000 counts | High rate bins dominated by noise | Noise dominated (total time) | Noise dominated (detector-on time) | Marked lightcurve |
|---|---|---|---|---|---|---|---|
| A | 13592 | 12387 | 0 | 0 | 0.00% | 0.00% |  |
| B | 13593 | 12388 | 6 | 6 | 0.04% | 0.05% |  |
| C | 13593 | 12388 | 24 | 24 | 0.18% | 0.19% |  |
| D | 13593 | 12388 | 62 | 62 | 0.46% | 0.50% |  |
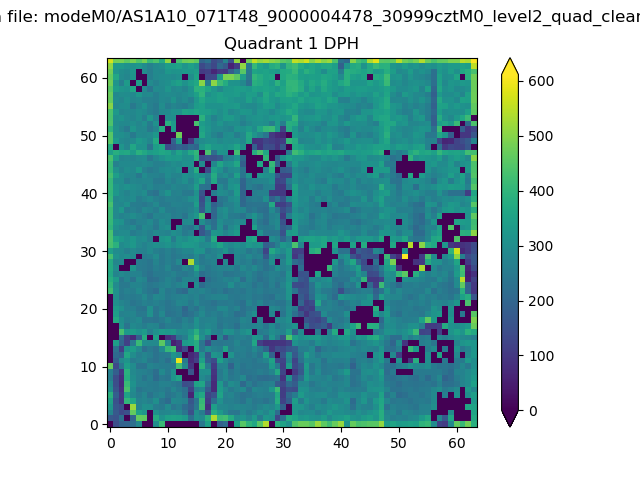
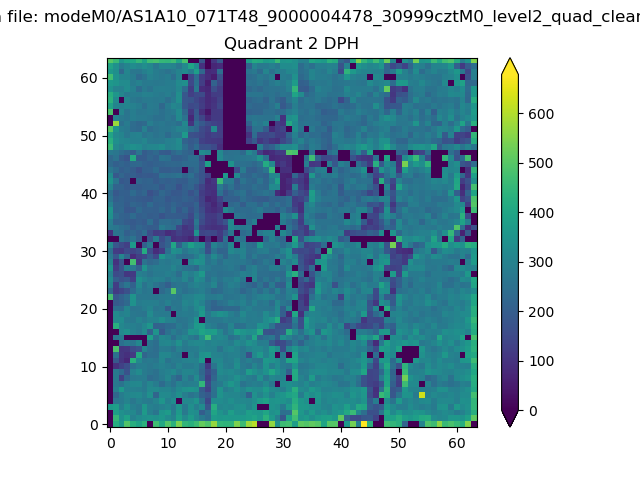
Top three noisy pixels from each quadrant. If the there are fewer than three noisy pixels in the level2.evt file, extra rows are filled as -1
| Pixel properties | Quadrant properties | ||||||
|---|---|---|---|---|---|---|---|
| Quadrant | DetID | PixID | Counts | Sigma | Mean | Median | Sigma |
| A | 13 | 254 | 22632 | 69.35 | 1516 | 1481 | 305.0 |
| A | 3 | 137 | 15759 | 46.81 | 1516 | 1481 | 305.0 |
| A | 0 | 226 | 12974 | 37.68 | 1516 | 1481 | 305.0 |
| B | 6 | 159 | 3402688 | 11791.07 | 1494 | 1454 | 288.5 |
| B | 0 | 190 | 107274 | 366.84 | 1494 | 1454 | 288.5 |
| B | 0 | 230 | 54265 | 183.08 | 1494 | 1454 | 288.5 |
| C | 0 | 10 | 387985 | 1134.61 | 1446 | 1451 | 340.7 |
| C | 14 | 238 | 238122 | 694.71 | 1446 | 1451 | 340.7 |
| C | 14 | 67 | 63427 | 181.92 | 1446 | 1451 | 340.7 |
| D | 8 | 195 | 743399 | 2151.95 | 1463 | 1424 | 344.8 |
| D | 1 | 239 | 326635 | 943.21 | 1463 | 1424 | 344.8 |
| D | 2 | 250 | 297441 | 858.54 | 1463 | 1424 | 344.8 |
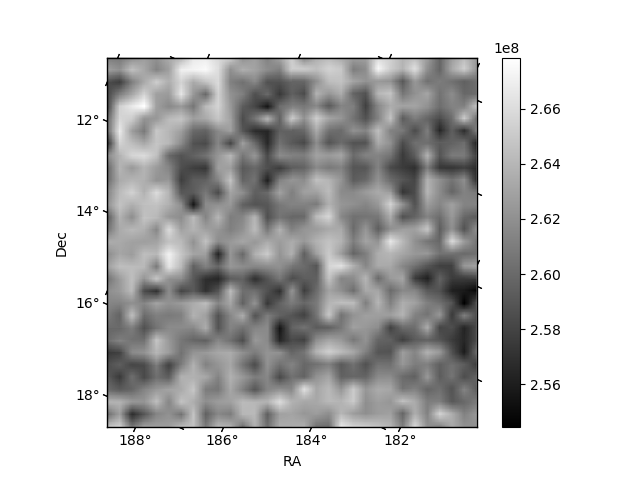
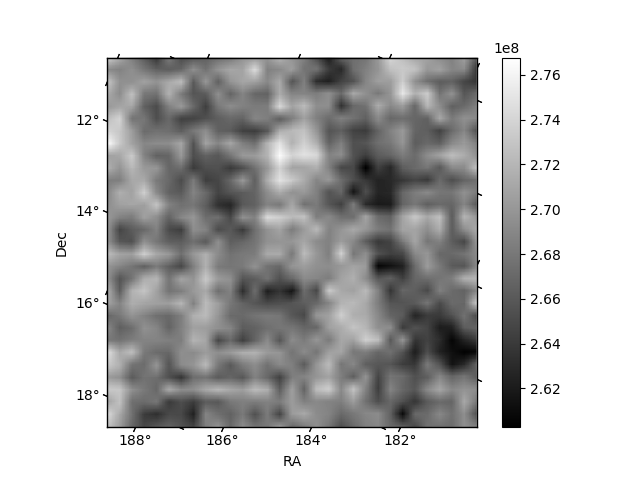
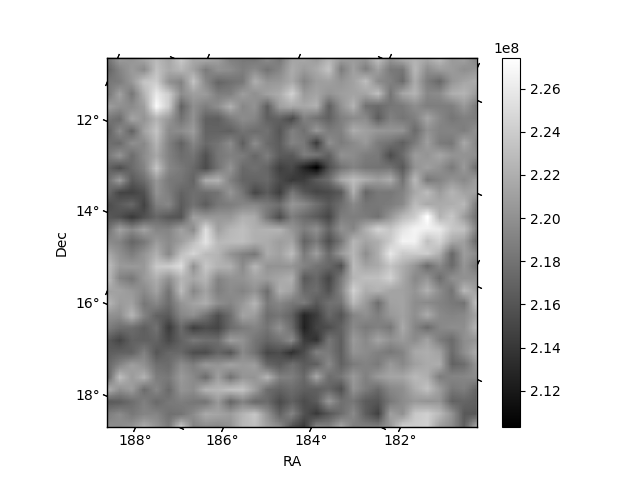
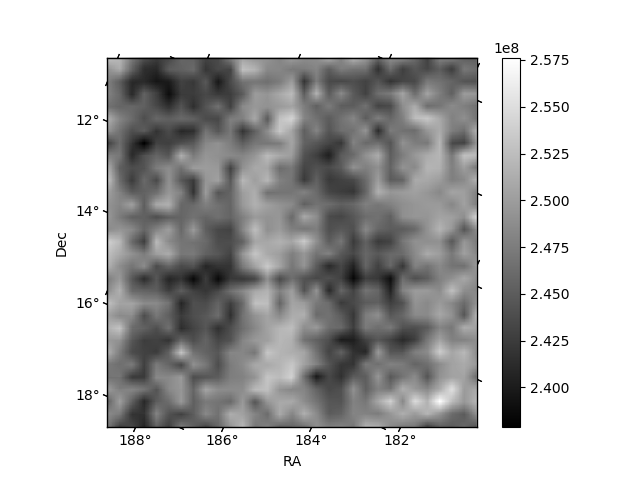
Histogram calculated using DETX and DETY for each event in the final _common_clean file
| Quadrant A | 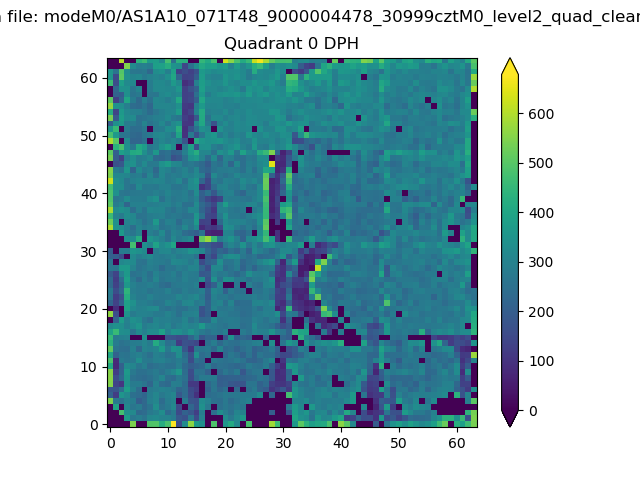 |
 |
Quadrant B |
|---|---|---|---|
| Quadrant D | 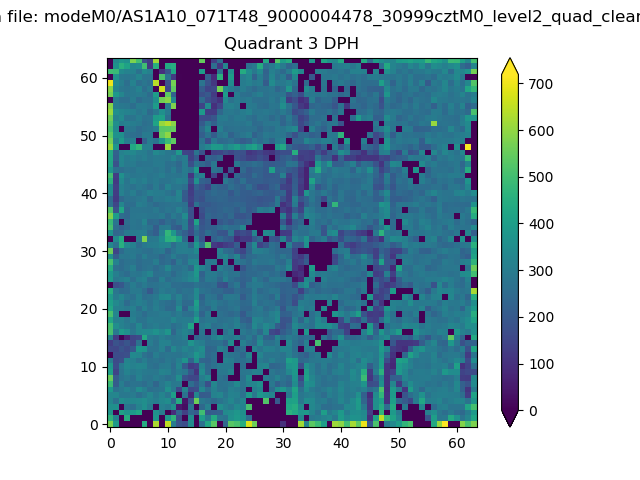 |
 |
Quadrant C |
| Plot type | Count rate plots | Images |
|---|---|---|
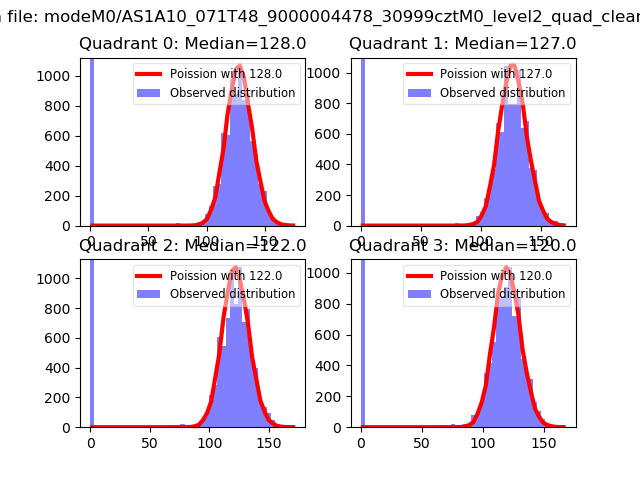
| Comparison with Poisson distribution Blue bars denote a histogram of data divided into 1 sec bins. Red curve is a Poisson curve with rate = median count rate of data. |
 |
 |
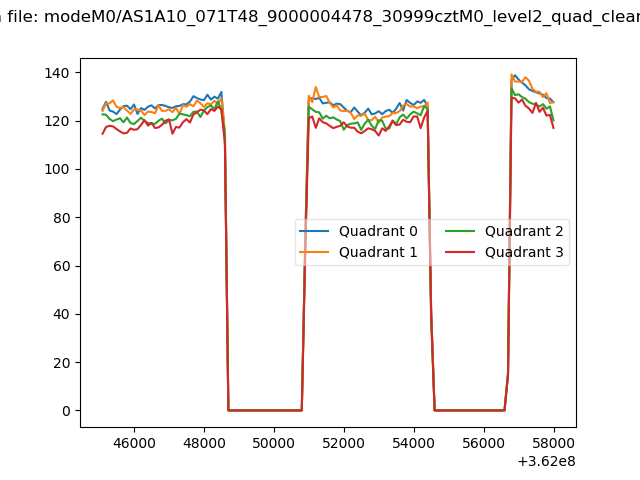
| Quadrant-wise count rates Data is divided into 100 sec bins |
 |
|
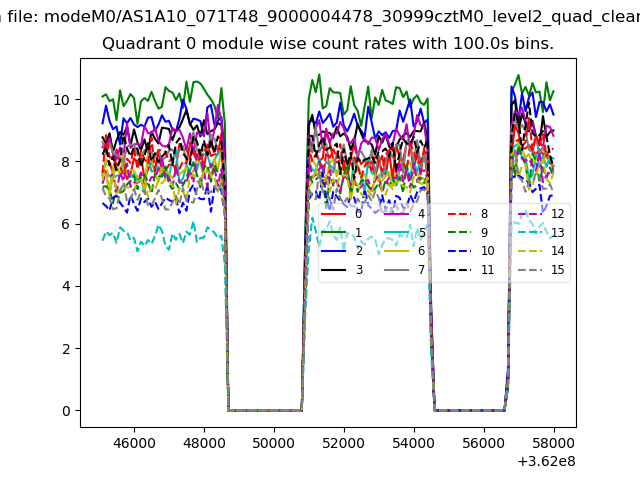
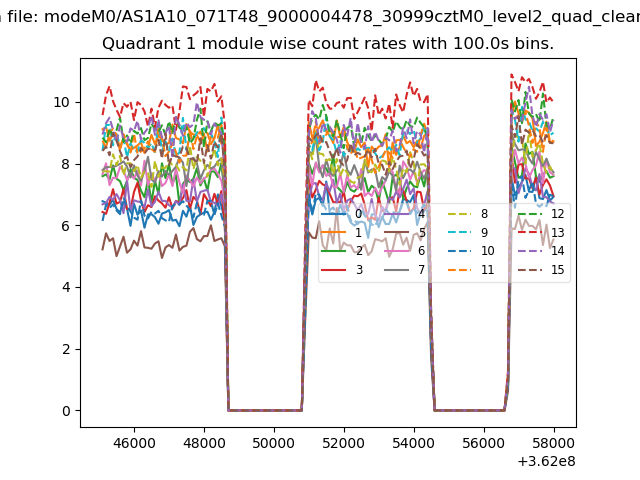
| Module-wise count rates for Quadrant A Data is divided into 100 sec bins |
 |
 |
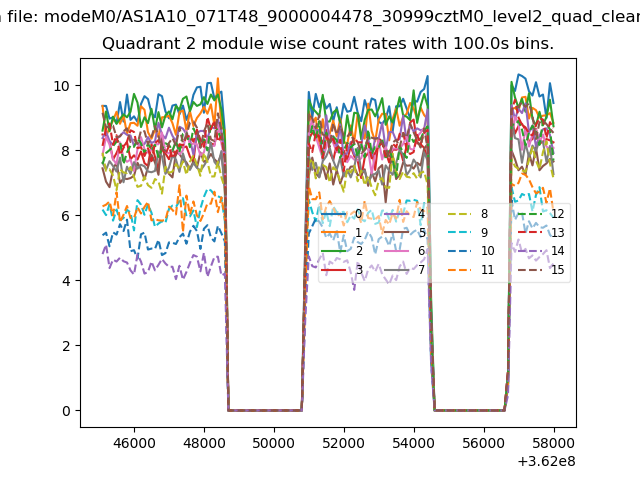
| Module-wise count rates for Quadrant B Data is divided into 100 sec bins |
 |
 |
| Module-wise count rates for Quadrant C Data is divided into 100 sec bins |
 |
 |
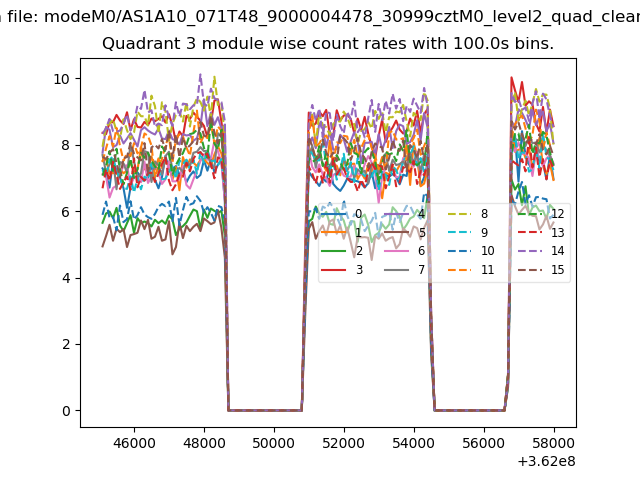
| Module-wise count rates for Quadrant D Data is divided into 100 sec bins |
 |
 |
| Parameter | Plot |
|---|---|
| CZT HV Monitor | 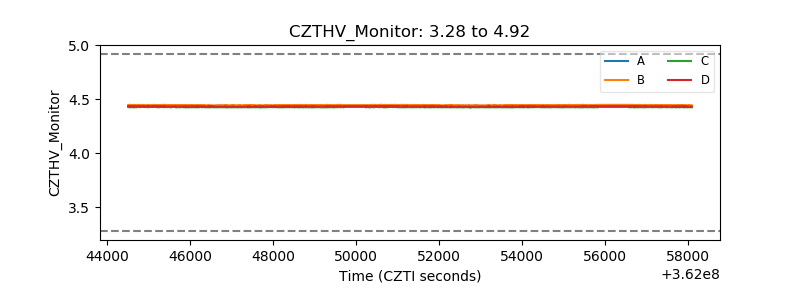 |
| D_VDD | 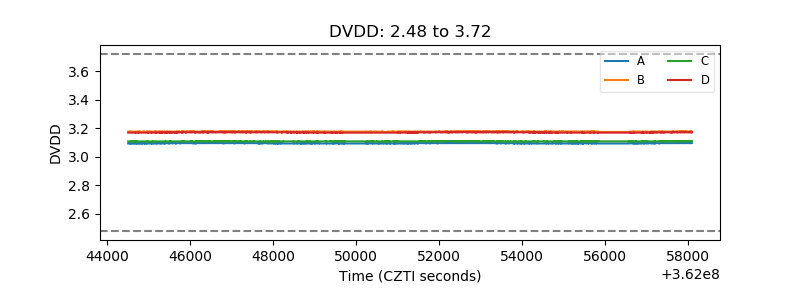 |
| Temperature 1 | 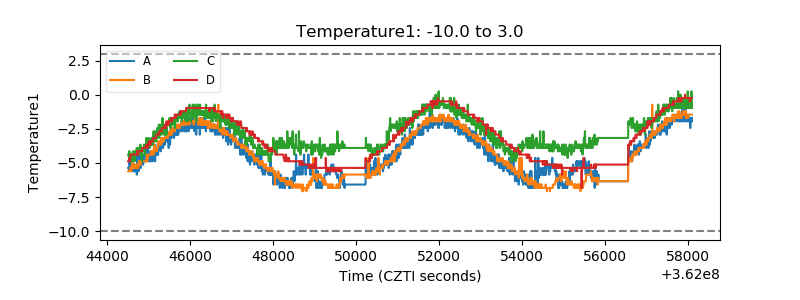 |
| Veto HV Monitor | 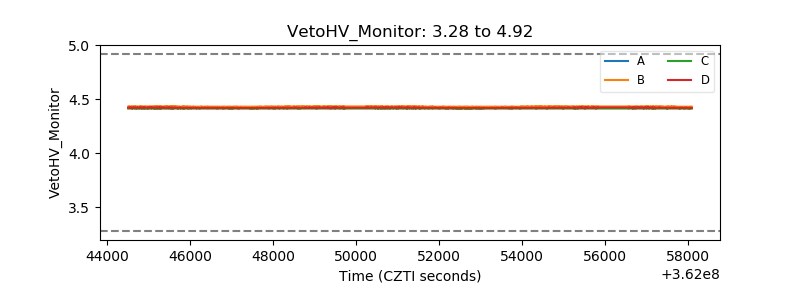 |
| Veto LLD | 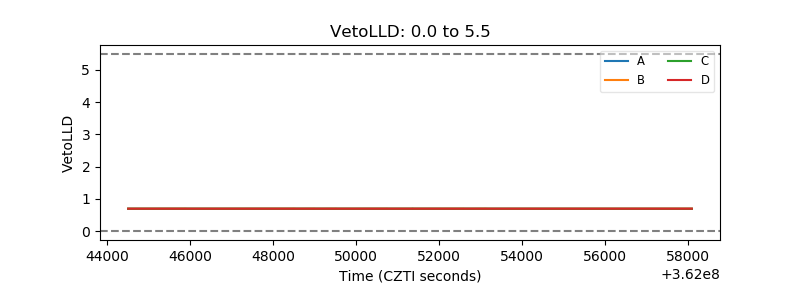 |
| Alpha Counter | 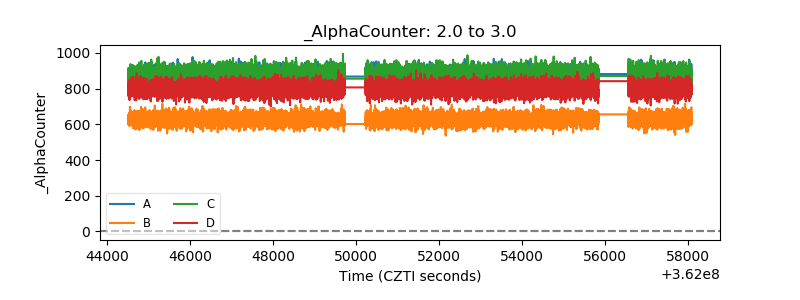 |
| _CPM_Rate | 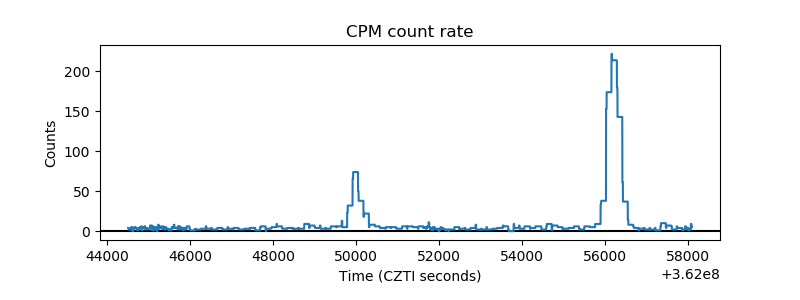 |
| CZT Counter | 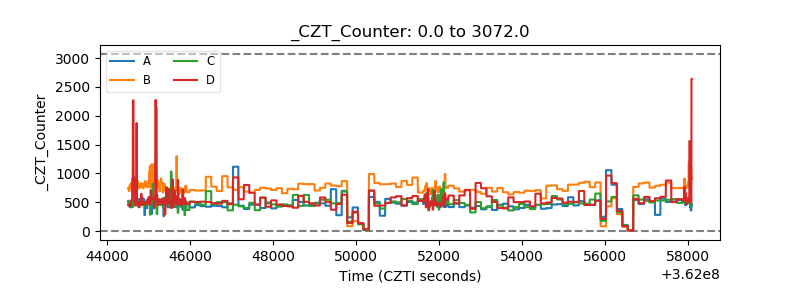 |
| +2.5 Volts monitor |  |
| +5 Volts monitor |  |
| _ROLL_ROT | 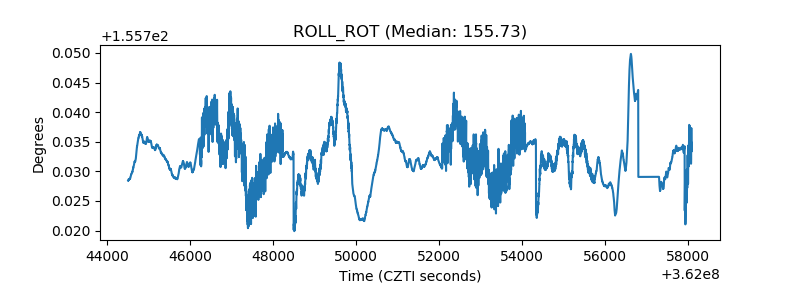 |
| _Roll_DEC | 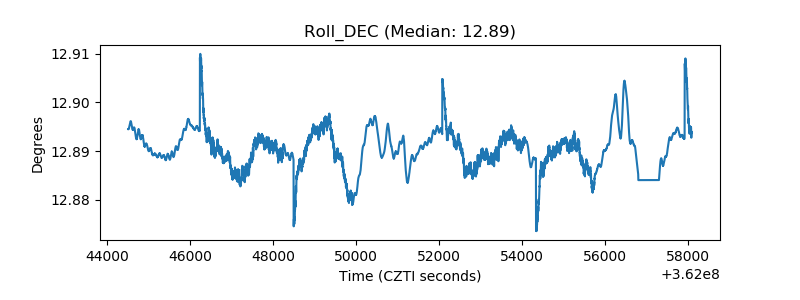 |
| _Roll_RA | 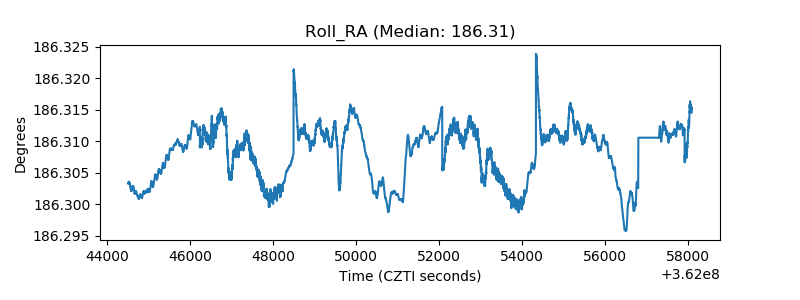 |
| Veto Counter | 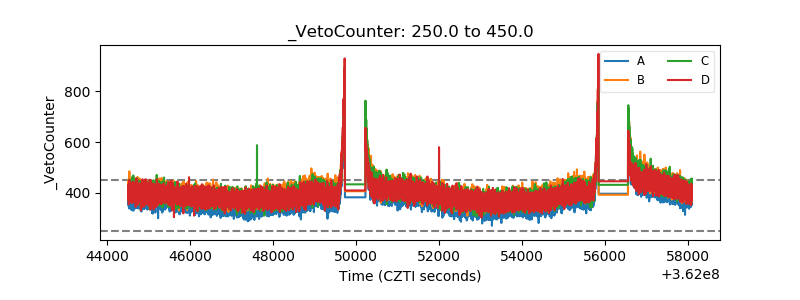 |