| Param | Original file | Final file |
|---|---|---|
| Filename | modeM0/AS1A10_071T48_9000004478_31001cztM0_level2.evt | modeM0/AS1A10_071T48_9000004478_31001cztM0_level2_quad_clean.evt |
| Size (bytes) | 551,430,720 | 97,093,440 |
| Size | 525.9 MB | 92.6 MB |
| Events in quadrant A | 3,180,274 | 645,939 |
| Events in quadrant B | 5,186,583 | 639,563 |
| Events in quadrant C | 3,733,067 | 603,804 |
| Events in quadrant D | 4,160,119 | 597,881 |
| Mode SS | |||
|---|---|---|---|
| Quadrant | BADHDUFLAG | Total packets | Discarded packets |
| A | 0 | 134 | 0 |
| B | 0 | 134 | 0 |
| C | 0 | 134 | 0 |
| D | 0 | 134 | 0 |
| Mode M9 | |||
|---|---|---|---|
| Quadrant | BADHDUFLAG | Total packets | Discarded packets |
| A | 0 | 11 | 0 |
| B | 0 | 11 | 0 |
| C | 0 | 11 | 0 |
| D | 0 | 11 | 0 |
| Mode M0 | |||
|---|---|---|---|
| Quadrant | BADHDUFLAG | Total packets | Discarded packets |
| A | 0 | 13682 | 2 |
| B | 0 | 19907 | 1 |
| C | 0 | 15365 | 1 |
| D | 0 | 16682 | 1 |
| Quadrant | Total seconds | Saturated seconds | Saturation percentage |
|---|---|---|---|
| A | 6495 | 72 | 1.108545% |
| B | 6496 | 121 | 1.862685% |
| C | 6496 | 243 | 3.740764% |
| D | 6496 | 248 | 3.817734% |
Noise dominated data is calculated using 1-second bins in cleaned event files. If a bin has >2000 counts, and if more than 50% of those come from <1% of pixels, then it is considered to be noise-dominated and hence unusable.
| Quadrant | # 1 sec bins | Bins with >0 counts | Bins with >2000 counts | High rate bins dominated by noise | Noise dominated (total time) | Noise dominated (detector-on time) | Marked lightcurve |
|---|---|---|---|---|---|---|---|
| A | 7530 | 6496 | 0 | 0 | 0.00% | 0.00% | 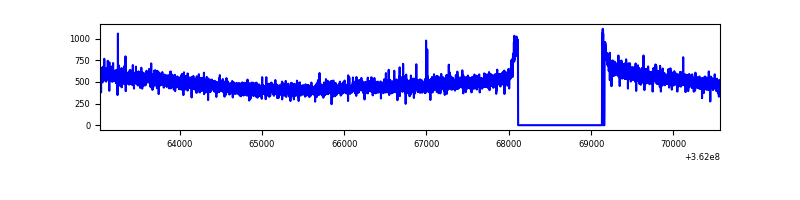 |
| B | 7531 | 6496 | 6 | 6 | 0.08% | 0.09% | 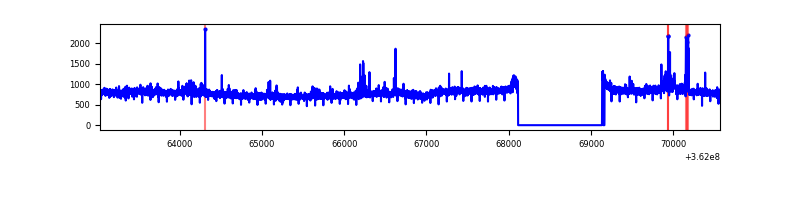 |
| C | 7531 | 6496 | 70 | 70 | 0.93% | 1.08% | 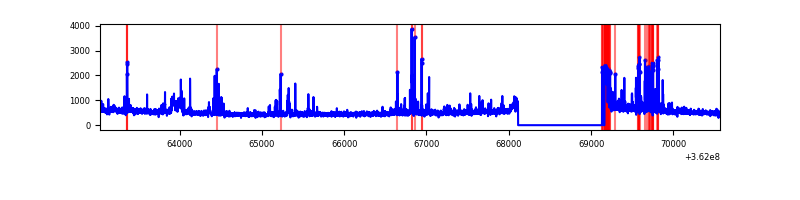 |
| D | 7531 | 6497 | 200 | 200 | 2.66% | 3.08% | 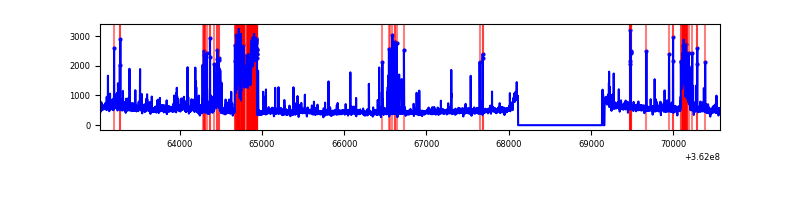 |
Top three noisy pixels from each quadrant. If the there are fewer than three noisy pixels in the level2.evt file, extra rows are filled as -1
| Pixel properties | Quadrant properties | ||||||
|---|---|---|---|---|---|---|---|
| Quadrant | DetID | PixID | Counts | Sigma | Mean | Median | Sigma |
| A | 13 | 254 | 12183 | 68.34 | 823 | 804 | 166.5 |
| A | 3 | 137 | 7951 | 42.92 | 823 | 804 | 166.5 |
| A | 0 | 226 | 6890 | 36.55 | 823 | 804 | 166.5 |
| B | 6 | 159 | 1872969 | 12140.58 | 807 | 788 | 154.2 |
| B | 0 | 155 | 55055 | 351.91 | 807 | 788 | 154.2 |
| B | 4 | 80 | 23194 | 145.3 | 807 | 788 | 154.2 |
| C | 0 | 10 | 467694 | 2570.15 | 776 | 779 | 181.7 |
| C | 14 | 238 | 125247 | 685.14 | 776 | 779 | 181.7 |
| C | 3 | 233 | 57688 | 313.26 | 776 | 779 | 181.7 |
| D | 13 | 174 | 474039 | 2525.95 | 793 | 772 | 187.4 |
| D | 12 | 33 | 245568 | 1306.54 | 793 | 772 | 187.4 |
| D | 8 | 195 | 204408 | 1086.86 | 793 | 772 | 187.4 |
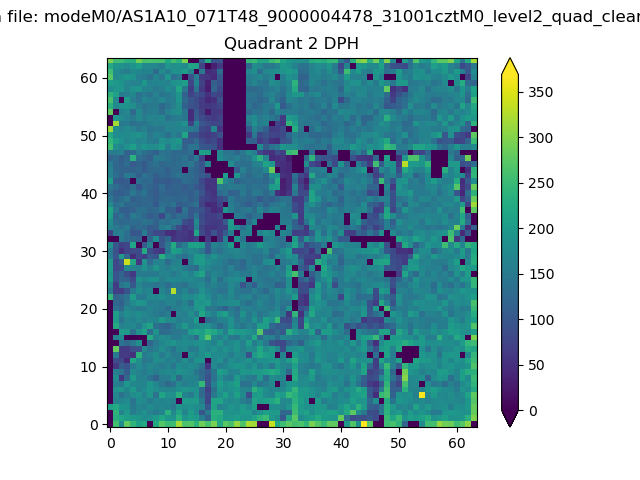
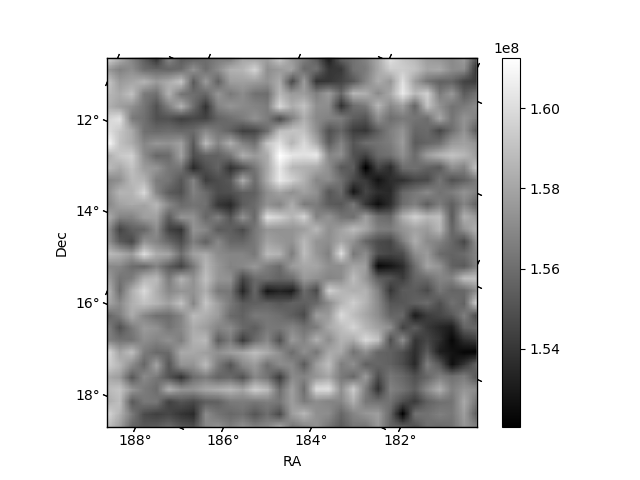
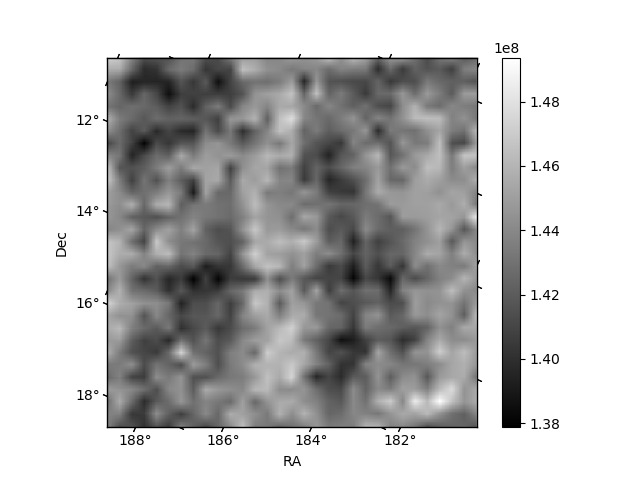
Histogram calculated using DETX and DETY for each event in the final _common_clean file
| Quadrant A | 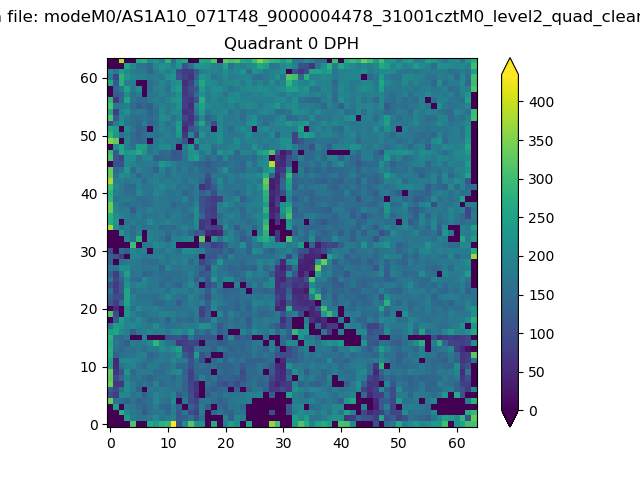 |
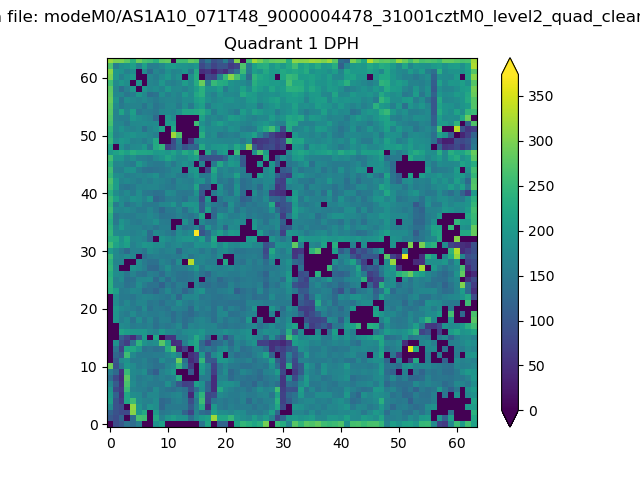 |
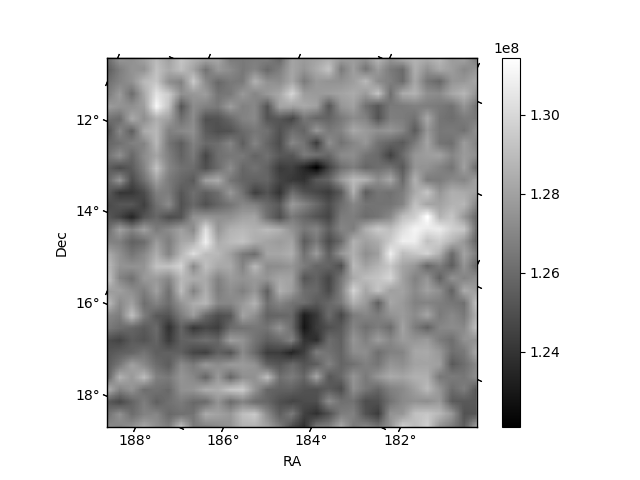
Quadrant B |
|---|---|---|---|
| Quadrant D | 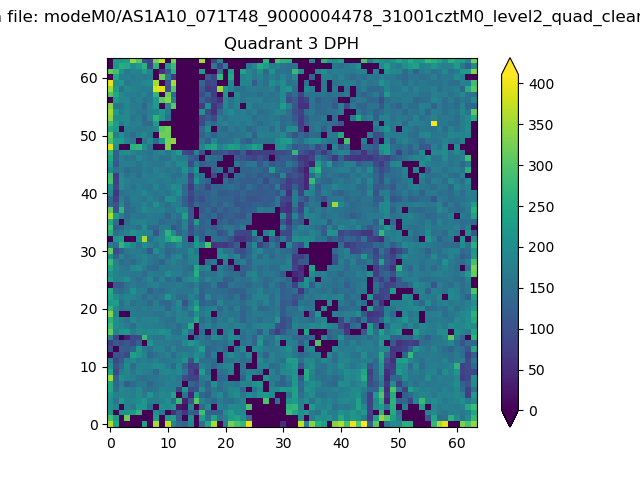 |
 |
Quadrant C |
| Plot type | Count rate plots | Images |
|---|---|---|
| Comparison with Poisson distribution Blue bars denote a histogram of data divided into 1 sec bins. Red curve is a Poisson curve with rate = median count rate of data. |
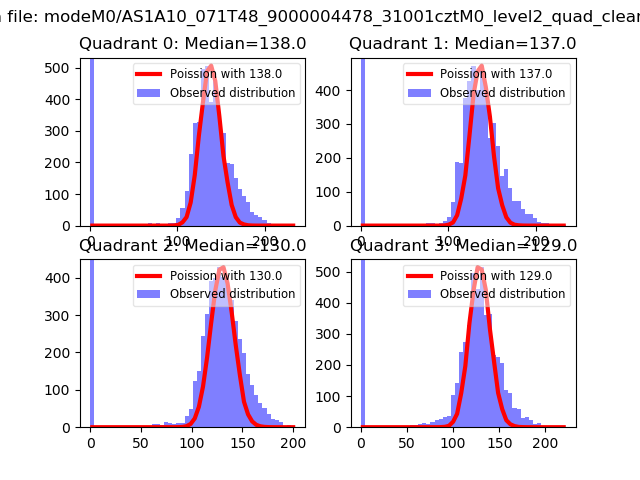 |
 |
| Quadrant-wise count rates Data is divided into 100 sec bins |
 |
|
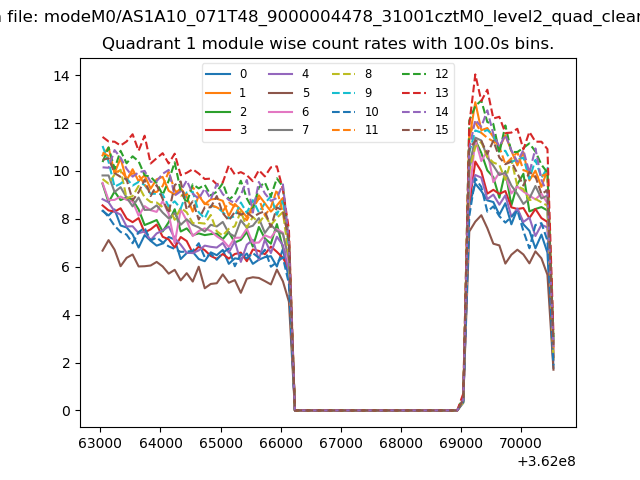
| Module-wise count rates for Quadrant A Data is divided into 100 sec bins |
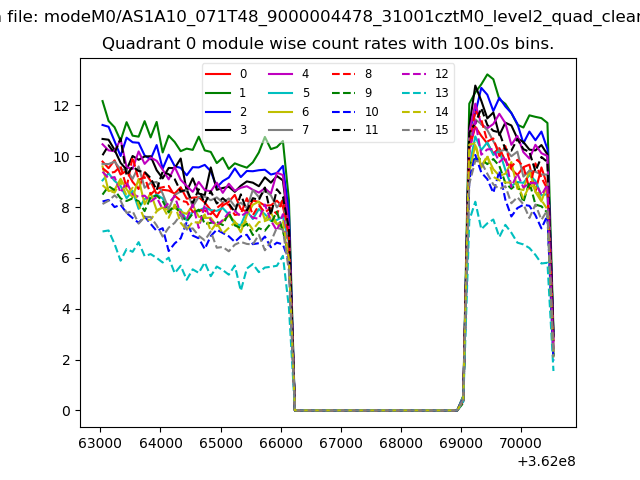 |
 |
| Module-wise count rates for Quadrant B Data is divided into 100 sec bins |
 |
 |
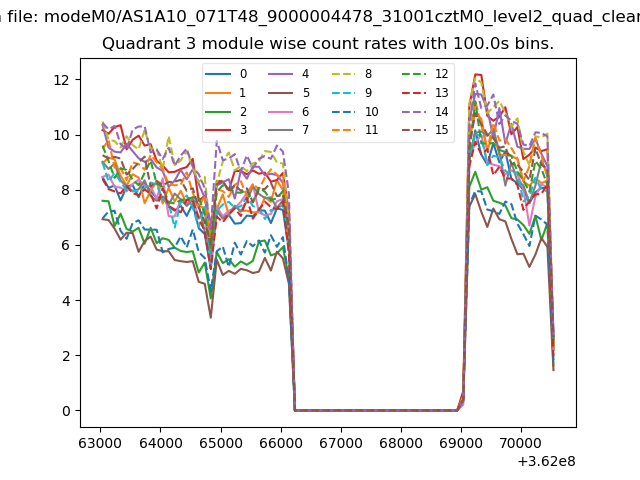
| Module-wise count rates for Quadrant C Data is divided into 100 sec bins |
 |
 |
| Module-wise count rates for Quadrant D Data is divided into 100 sec bins |
 |
 |
| Parameter | Plot |
|---|---|
| CZT HV Monitor | 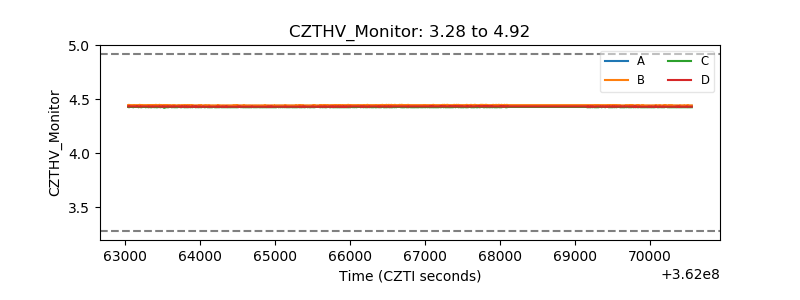 |
| D_VDD | 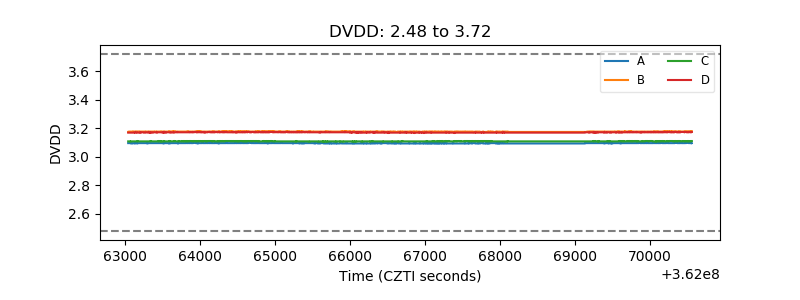 |
| Temperature 1 | 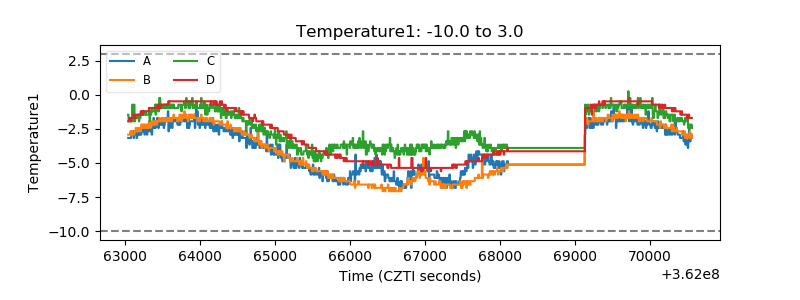 |
| Veto HV Monitor | 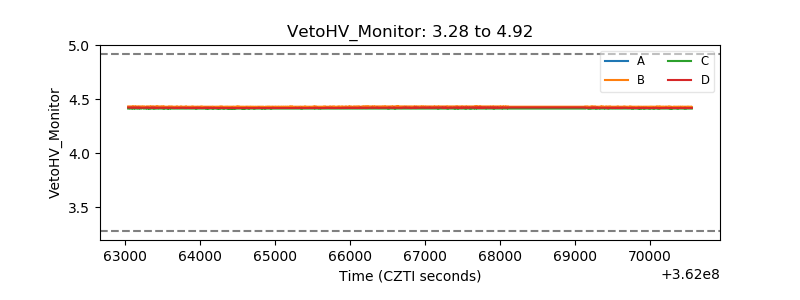 |
| Veto LLD | 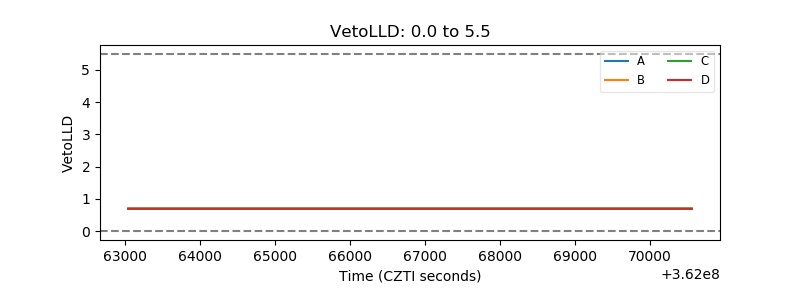 |
| Alpha Counter |  |
| _CPM_Rate |  |
| CZT Counter | 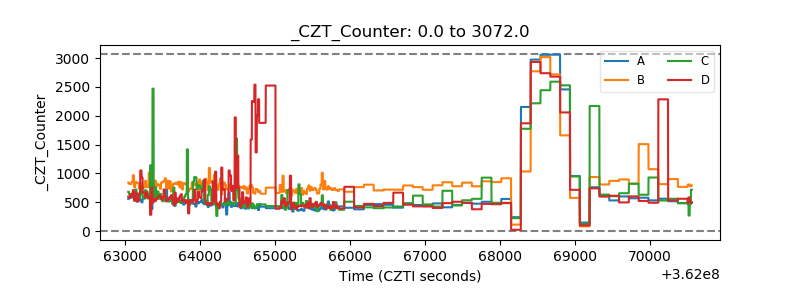 |
| +2.5 Volts monitor |  |
| +5 Volts monitor |  |
| _ROLL_ROT | 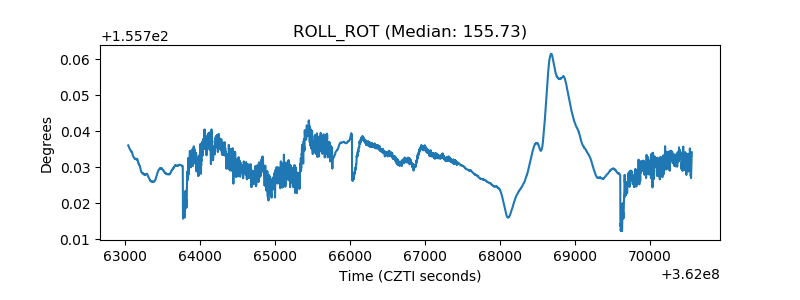 |
| _Roll_DEC | 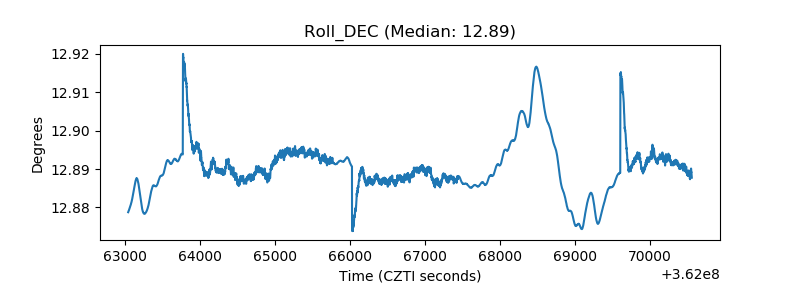 |
| _Roll_RA | 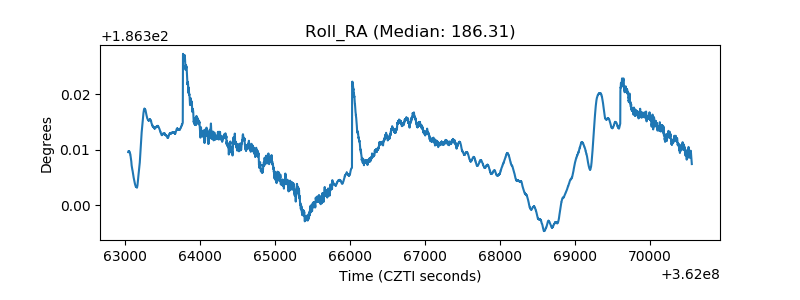 |
| Veto Counter | 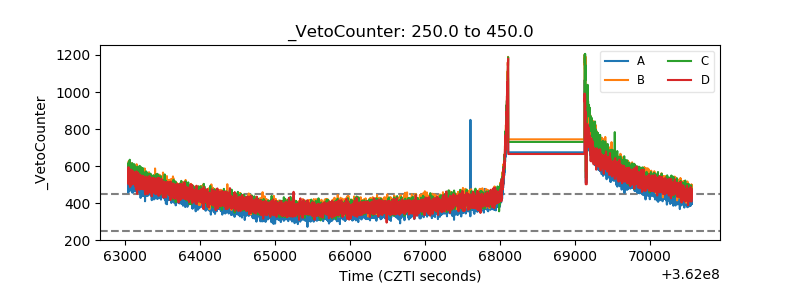 |