| Param | Original file | Final file |
|---|---|---|
| Filename | modeM0/AS1A10_071T48_9000004478_31003cztM0_level2.evt | modeM0/AS1A10_071T48_9000004478_31003cztM0_level2_quad_clean.evt |
| Size (bytes) | 566,262,720 | 98,184,960 |
| Size | 540.0 MB | 93.6 MB |
| Events in quadrant A | 3,265,752 | 656,377 |
| Events in quadrant B | 5,380,027 | 652,704 |
| Events in quadrant C | 4,076,464 | 610,417 |
| Events in quadrant D | 3,989,009 | 602,770 |
| Mode SS | |||
|---|---|---|---|
| Quadrant | BADHDUFLAG | Total packets | Discarded packets |
| A | 0 | 132 | 0 |
| B | 0 | 132 | 0 |
| C | 0 | 132 | 0 |
| D | 0 | 132 | 0 |
| Mode M9 | |||
|---|---|---|---|
| Quadrant | BADHDUFLAG | Total packets | Discarded packets |
| A | 0 | 15 | 0 |
| B | 0 | 16 | 0 |
| C | 0 | 16 | 0 |
| D | 0 | 16 | 0 |
| Mode M0 | |||
|---|---|---|---|
| Quadrant | BADHDUFLAG | Total packets | Discarded packets |
| A | 0 | 13939 | 2 |
| B | 0 | 20570 | 2 |
| C | 0 | 16335 | 2 |
| D | 0 | 16128 | 2 |
| Quadrant | Total seconds | Saturated seconds | Saturation percentage |
|---|---|---|---|
| A | 6473 | 47 | 0.726093% |
| B | 6473 | 134 | 2.070137% |
| C | 6473 | 332 | 5.128997% |
| D | 6473 | 180 | 2.780782% |
Noise dominated data is calculated using 1-second bins in cleaned event files. If a bin has >2000 counts, and if more than 50% of those come from <1% of pixels, then it is considered to be noise-dominated and hence unusable.
| Quadrant | # 1 sec bins | Bins with >0 counts | Bins with >2000 counts | High rate bins dominated by noise | Noise dominated (total time) | Noise dominated (detector-on time) | Marked lightcurve |
|---|---|---|---|---|---|---|---|
| A | 7683 | 6474 | 0 | 0 | 0.00% | 0.00% | 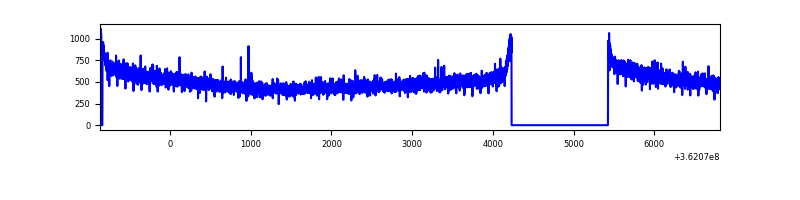 |
| B | 7683 | 6473 | 10 | 10 | 0.13% | 0.15% | 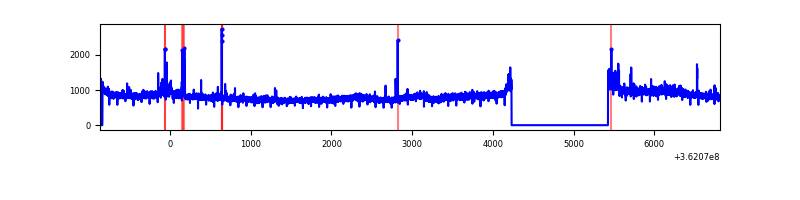 |
| C | 7683 | 6473 | 159 | 159 | 2.07% | 2.46% | 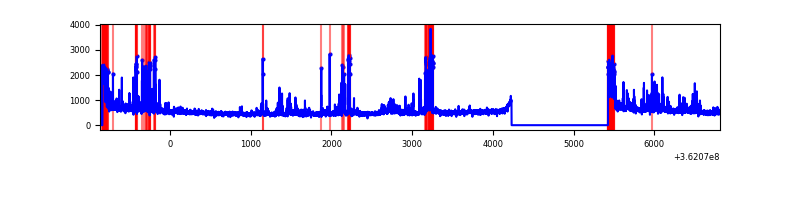 |
| D | 7683 | 6475 | 126 | 126 | 1.64% | 1.95% | 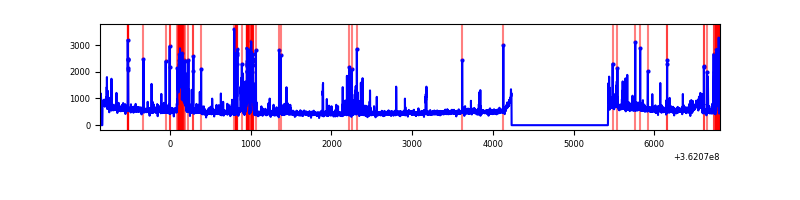 |
Top three noisy pixels from each quadrant. If the there are fewer than three noisy pixels in the level2.evt file, extra rows are filled as -1
| Pixel properties | Quadrant properties | ||||||
|---|---|---|---|---|---|---|---|
| Quadrant | DetID | PixID | Counts | Sigma | Mean | Median | Sigma |
| A | 13 | 254 | 12023 | 65.98 | 846 | 829 | 169.6 |
| A | 3 | 137 | 7982 | 42.16 | 846 | 829 | 169.6 |
| A | 0 | 226 | 7231 | 37.74 | 846 | 829 | 169.6 |
| B | 6 | 159 | 1903866 | 12084.41 | 834 | 816 | 157.5 |
| B | 0 | 155 | 85943 | 540.56 | 834 | 816 | 157.5 |
| B | 0 | 190 | 43176 | 268.99 | 834 | 816 | 157.5 |
| C | 0 | 10 | 776991 | 4186.6 | 792 | 797 | 185.4 |
| C | 14 | 238 | 128563 | 689.14 | 792 | 797 | 185.4 |
| C | 8 | 229 | 33619 | 177.03 | 792 | 797 | 185.4 |
| D | 12 | 33 | 348671 | 1831.43 | 811 | 793 | 189.9 |
| D | 8 | 195 | 225777 | 1184.45 | 811 | 793 | 189.9 |
| D | 2 | 250 | 161503 | 846.07 | 811 | 793 | 189.9 |
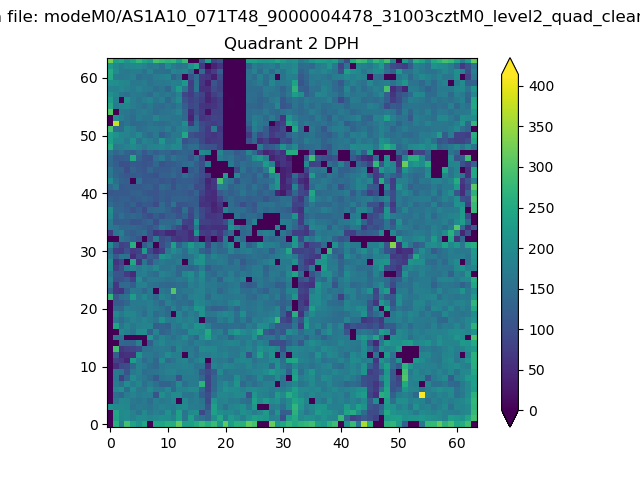
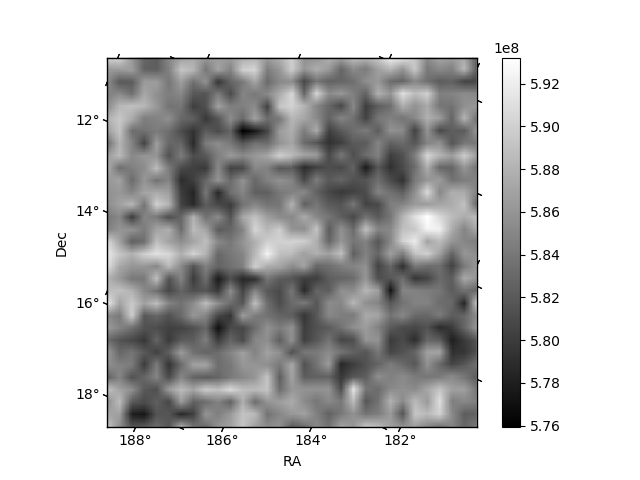
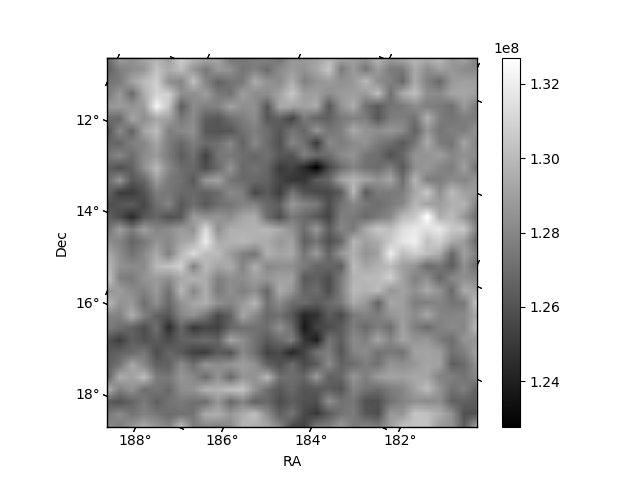
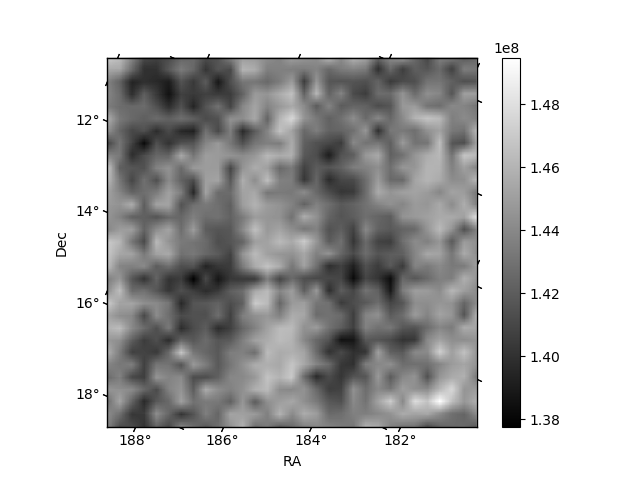
Histogram calculated using DETX and DETY for each event in the final _common_clean file
| Quadrant A | 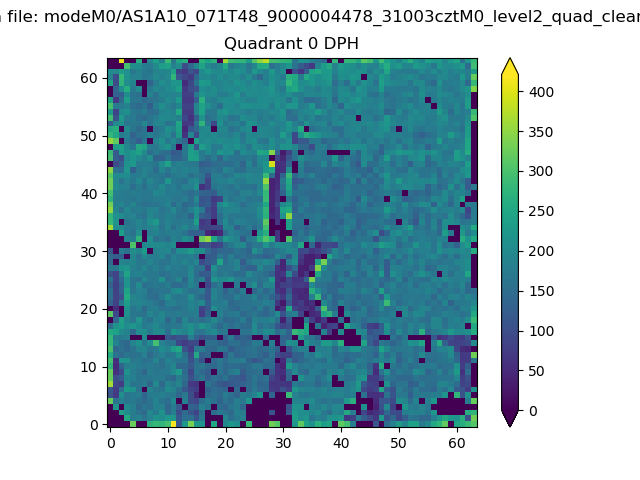 |
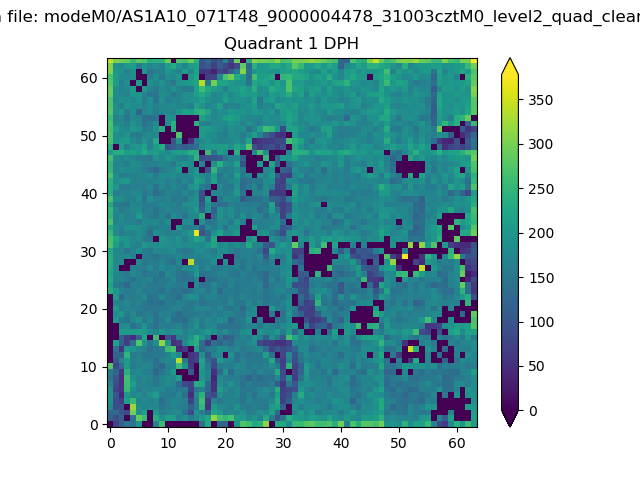 |
Quadrant B |
|---|---|---|---|
| Quadrant D | 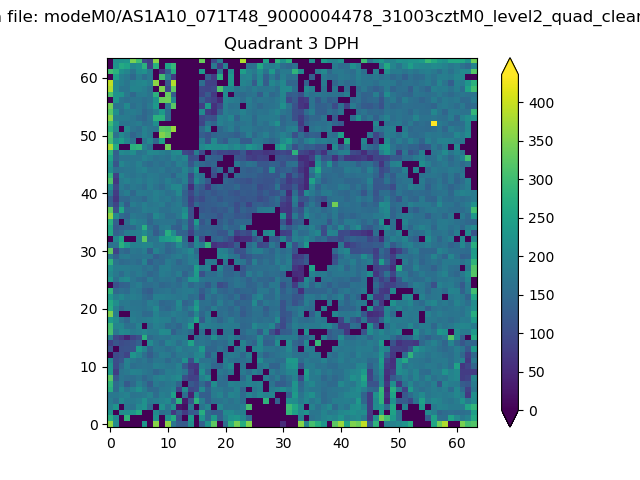 |
 |
Quadrant C |
| Plot type | Count rate plots | Images |
|---|---|---|
| Comparison with Poisson distribution Blue bars denote a histogram of data divided into 1 sec bins. Red curve is a Poisson curve with rate = median count rate of data. |
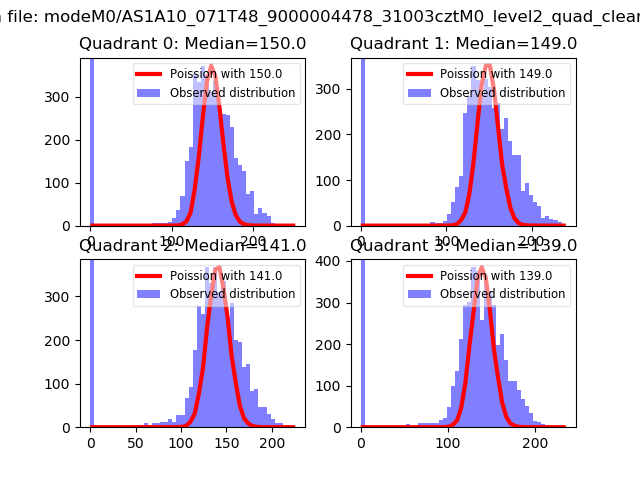 |
 |
| Quadrant-wise count rates Data is divided into 100 sec bins |
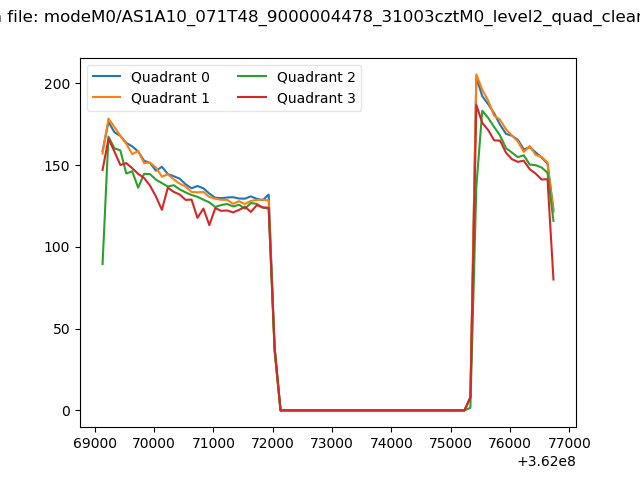 |
|
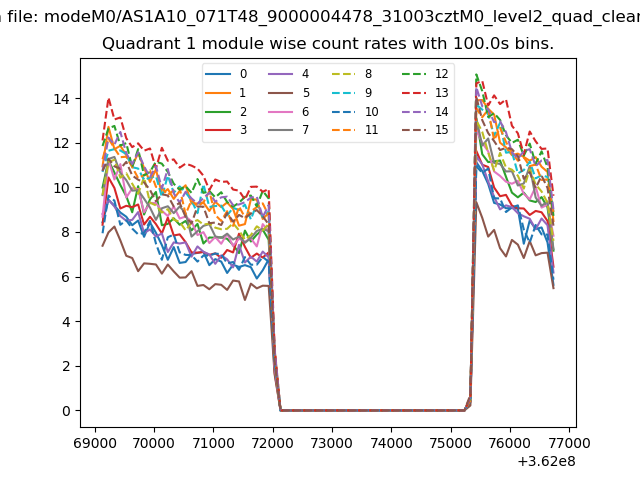
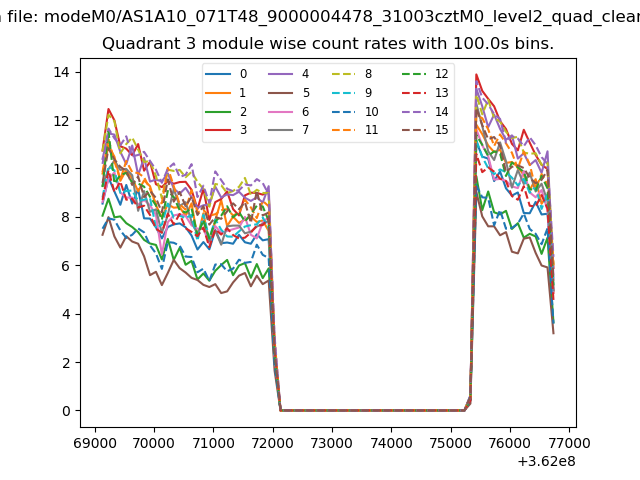
| Module-wise count rates for Quadrant A Data is divided into 100 sec bins |
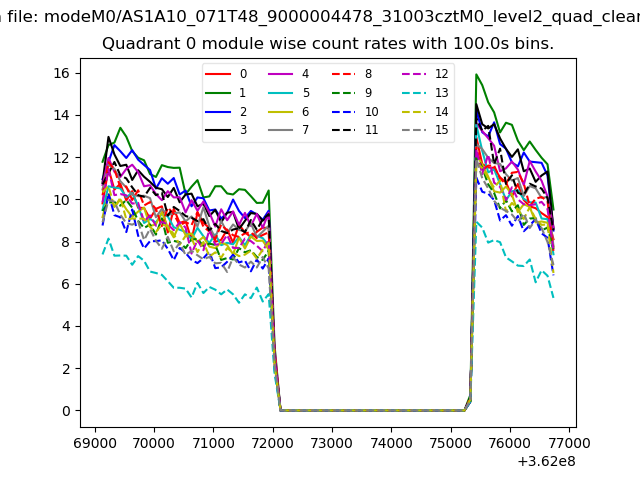 |
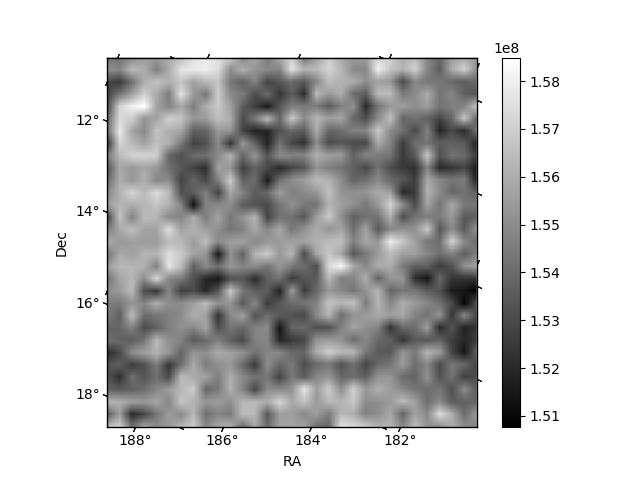 |
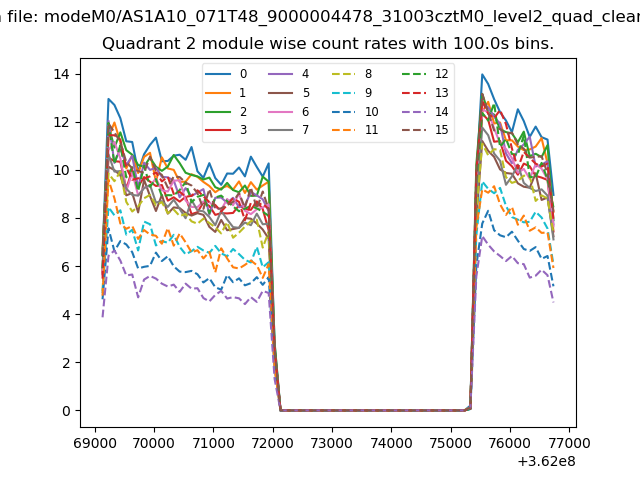
| Module-wise count rates for Quadrant B Data is divided into 100 sec bins |
 |
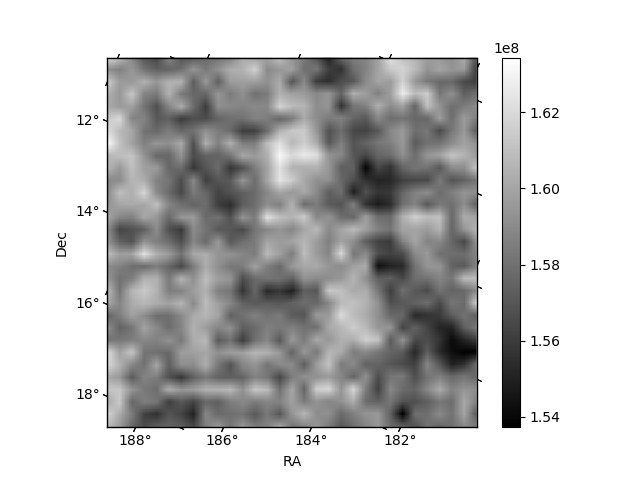 |
| Module-wise count rates for Quadrant C Data is divided into 100 sec bins |
 |
 |
| Module-wise count rates for Quadrant D Data is divided into 100 sec bins |
 |
 |
| Parameter | Plot |
|---|---|
| CZT HV Monitor | 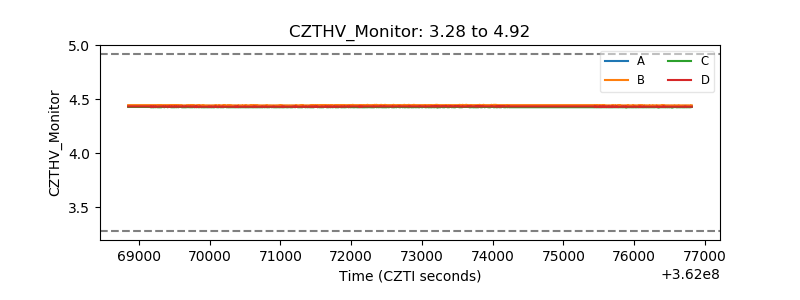 |
| D_VDD | 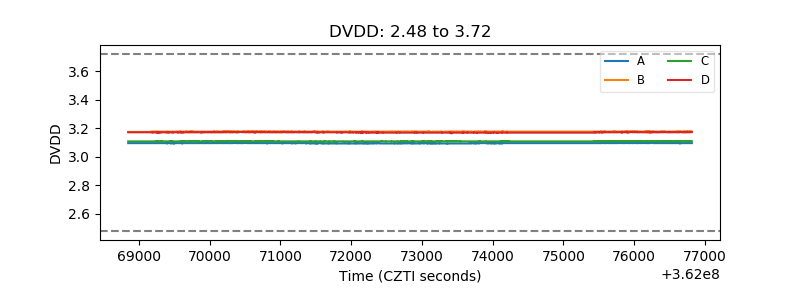 |
| Temperature 1 | 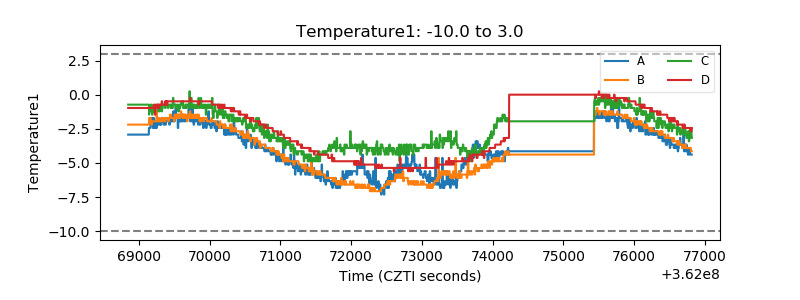 |
| Veto HV Monitor | 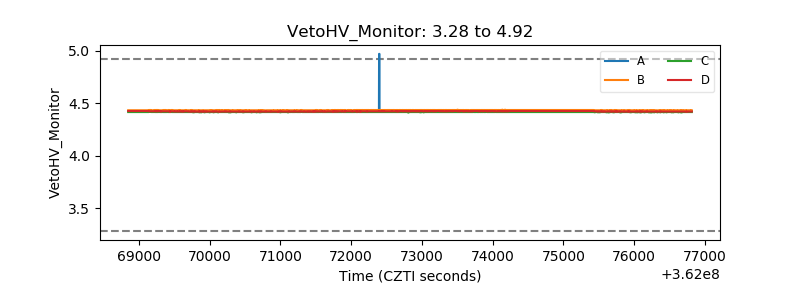 |
| Veto LLD | 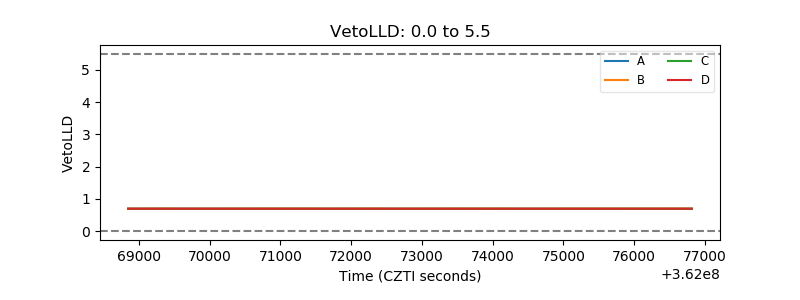 |
| Alpha Counter | 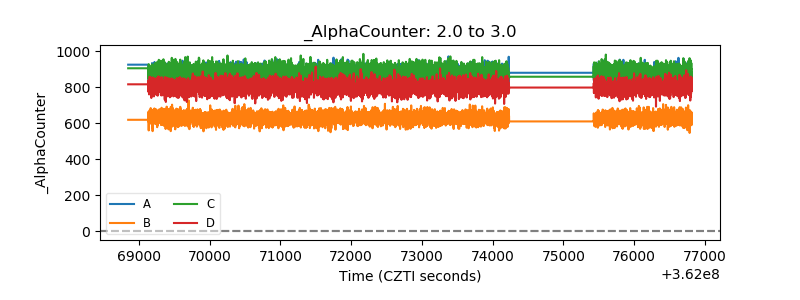 |
| _CPM_Rate | 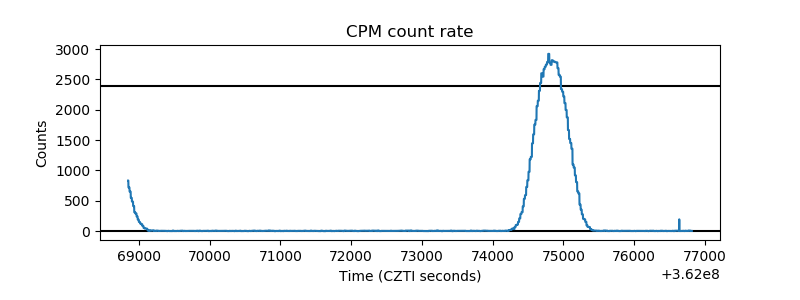 |
| CZT Counter | 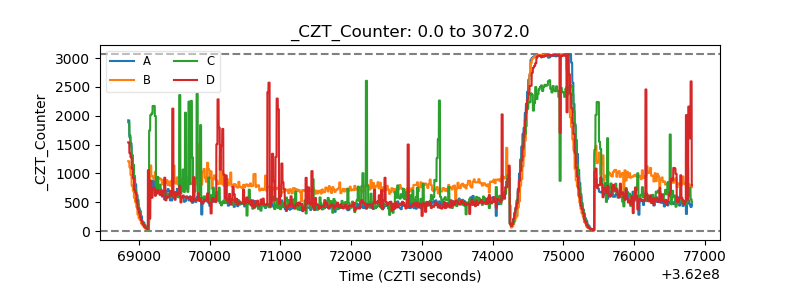 |
| +2.5 Volts monitor |  |
| +5 Volts monitor |  |
| _ROLL_ROT | 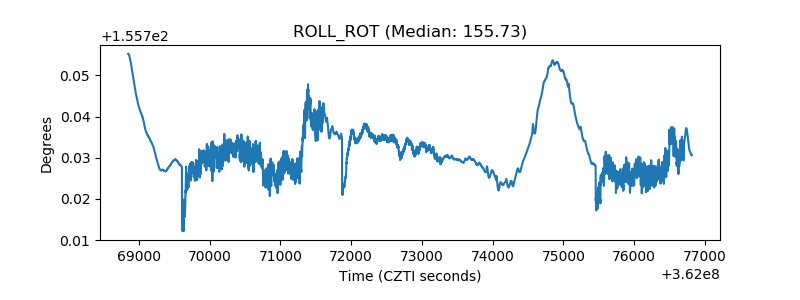 |
| _Roll_DEC | 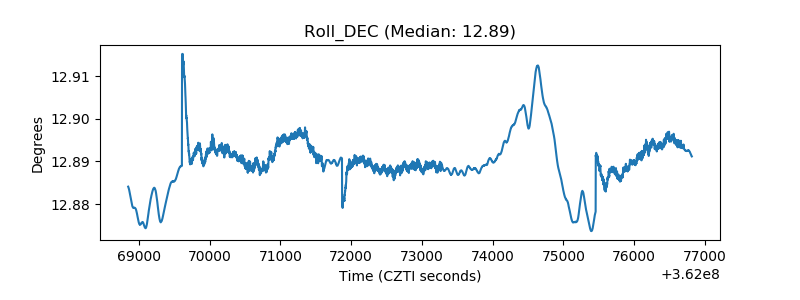 |
| _Roll_RA | 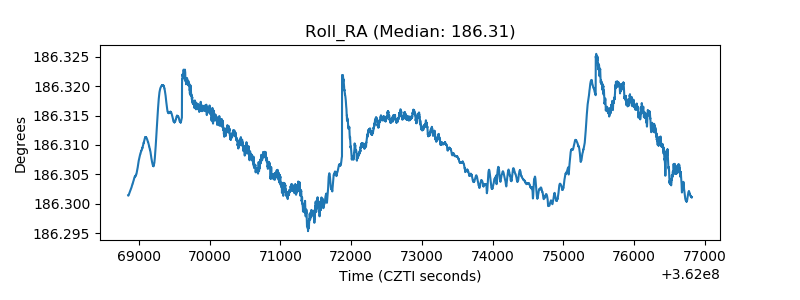 |
| Veto Counter | 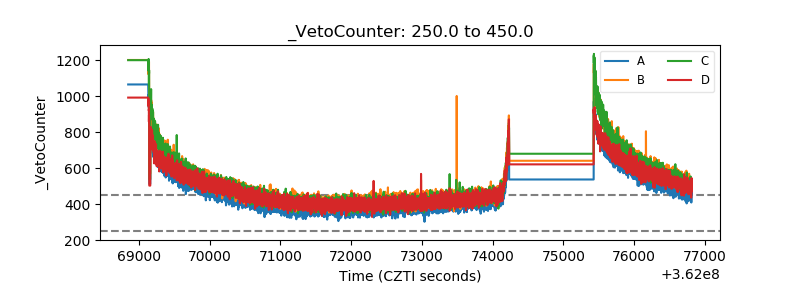 |