| Param | Original file | Final file |
|---|---|---|
| Filename | modeM0/AS1A10_071T52_9000004480cztM0_level2.fits | modeM0/AS1A10_071T52_9000004480cztM0_level2_quad_clean.evt |
| Size (bytes) | 754,649,280 | 545,057,280 |
| Size | 719.7 MB | 519.8 MB |
| Events in quadrant A | 4,766,356 | 3,051,067 |
| Events in quadrant B | 4,452,448 | 2,991,773 |
| Events in quadrant C | 4,515,262 | 2,848,609 |
| Events in quadrant D | 3,937,982 | 2,432,684 |
| Mode M0 | |||
|---|---|---|---|
| Quadrant | BADHDUFLAG | Total packets | Discarded packets |
| A | 0 | 157667 | 0 |
| B | 0 | 232383 | 0 |
| C | 0 | 171195 | 0 |
| D | 0 | 201360 | 0 |
| Mode M9 | |||
|---|---|---|---|
| Quadrant | BADHDUFLAG | Total packets | Discarded packets |
| A | 0 | 120 | 0 |
| B | 0 | 120 | 0 |
| C | 0 | 120 | 0 |
| D | 0 | 120 | 0 |
| Mode SS | |||
|---|---|---|---|
| Quadrant | BADHDUFLAG | Total packets | Discarded packets |
| A | 0 | 1540 | 0 |
| B | 0 | 1540 | 0 |
| C | 0 | 1540 | 0 |
| D | 0 | 1540 | 0 |
| Quadrant | Total seconds | Saturated seconds | Saturation percentage |
|---|---|---|---|
| A | 75544 | 1092 | 1.445515% |
| B | 75544 | 2005 | 2.654082% |
| C | 75544 | 2496 | 3.304035% |
| D | 75544 | 3962 | 5.244626% |
Noise dominated data is calculated using 1-second bins in cleaned event files. If a bin has >2000 counts, and if more than 50% of those come from <1% of pixels, then it is considered to be noise-dominated and hence unusable.
| Quadrant | # 1 sec bins | Bins with >0 counts | Bins with >2000 counts | High rate bins dominated by noise | Noise dominated (total time) | Noise dominated (detector-on time) | Marked lightcurve |
|---|---|---|---|---|---|---|---|
| A | 87719 | 75535 | 0 | 0 | 0.00% | 0.00% |  |
| B | 87719 | 75530 | 0 | 0 | 0.00% | 0.00% |  |
| C | 87719 | 75521 | 0 | 0 | 0.00% | 0.00% |  |
| D | 87719 | 75476 | 0 | 0 | 0.00% | 0.00% | 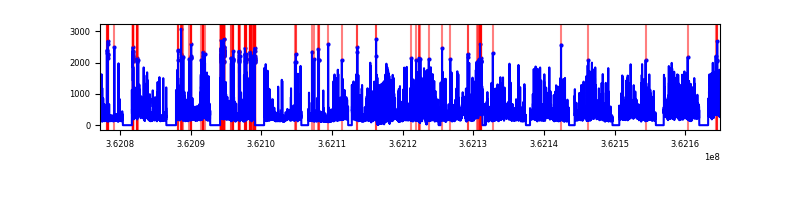 |
Top three noisy pixels from each quadrant. If the there are fewer than three noisy pixels in the level2.evt file, extra rows are filled as -1
| Pixel properties | Quadrant properties | ||||||
|---|---|---|---|---|---|---|---|
| Quadrant | DetID | PixID | Counts | Sigma | Mean | Median | Sigma |
| A | 0 | 29 | 4606 | 11.25 | 1240 | 1163 | 306.0 |
| A | 7 | 110 | 3789 | 8.58 | 1240 | 1163 | 306.0 |
| A | 0 | 30 | 3613 | 8.0 | 1240 | 1163 | 306.0 |
| B | 2 | 9 | 3559 | 10.62 | 1176 | 1126 | 229.1 |
| B | 2 | 8 | 3036 | 8.34 | 1176 | 1126 | 229.1 |
| B | 5 | 232 | 3009 | 8.22 | 1176 | 1126 | 229.1 |
| C | 12 | 241 | 3154 | 6.69 | 1195 | 1117 | 304.6 |
| C | 3 | 126 | 3058 | 6.37 | 1195 | 1117 | 304.6 |
| C | 3 | 187 | 3004 | 6.2 | 1195 | 1117 | 304.6 |
| D | 6 | 231 | 2822 | 6.05 | 1122 | 1020 | 297.7 |
| D | 10 | 189 | 2818 | 6.04 | 1122 | 1020 | 297.7 |
| D | 3 | 14 | 2742 | 5.78 | 1122 | 1020 | 297.7 |
Histogram calculated using DETX and DETY for each event in the final _common_clean file
| Quadrant A |  |
 |
Quadrant B |
|---|---|---|---|
| Quadrant D | 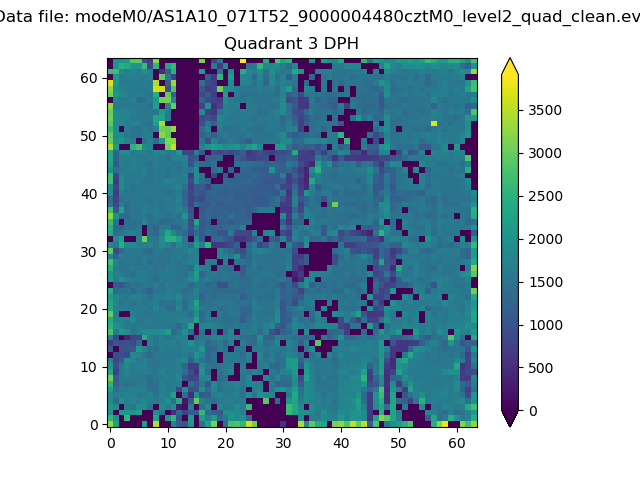 |
 |
Quadrant C |
| Plot type | Count rate plots | Images |
|---|---|---|
| Comparison with Poisson distribution Blue bars denote a histogram of data divided into 1 sec bins. Red curve is a Poisson curve with rate = median count rate of data. |
 |
 |
| Quadrant-wise count rates Data is divided into 100 sec bins |
 |
|
| Module-wise count rates for Quadrant A Data is divided into 100 sec bins |
 |
 |
| Module-wise count rates for Quadrant B Data is divided into 100 sec bins |
 |
 |
| Module-wise count rates for Quadrant C Data is divided into 100 sec bins |
 |
 |
| Module-wise count rates for Quadrant D Data is divided into 100 sec bins |
 |
 |
| Parameter | Plot |
|---|---|
| CZT HV Monitor |  |
| D_VDD |  |
| Temperature 1 |  |
| Veto HV Monitor |  |
| Veto LLD |  |
| Alpha Counter |  |
| _CPM_Rate |  |
| CZT Counter |  |
| +2.5 Volts monitor |  |
| +5 Volts monitor |  |
| _ROLL_ROT |  |
| _Roll_DEC |  |
| _Roll_RA |  |
| Veto Counter |  |